도시 협곡에서 유입류 풍속과 난류 슈미트수에 대한 대기오염물질 확산의 민감도 연구
Abstract
In this study, sensitivity of inflow wind speed and turbulent Schmidt number to pollutant dispersion in an urban street canyon is investigated, by comparing CFD-simulated results to wind-tunnel results. For this, we changed systematically inflow wind speed at the street-canyon height (1.5~10.0 m s−1 with the increment of 0.5 m s−1) and turbulent Schmidt number (0.2~1.3 with interval of 0.1). Also, we performed numerical experiments under the conditions that turbulent Schmidt numbers selected with the magnitude of mean kinetic energy at each grid point were assigned in the street canyon. With the increase of the inflow wind speed, the model underestimated (overestimated) pollutant concentration in the upwind (downwind) side of the street canyon because of the increase of pollutant advection. This implies that, for more realistic reproduction of pollutant dispersion in urban street canyons, large (small) turbulent Schmidt number should be assigned for week (strong) inflow condition. In the cases of selectively assigned turbulent Schmidt number, mean bias remarkably decreased (maximum 60%) compared to the cases of constant turbulent Schmidt number assigned. At week (strong) inflow wind speed, root mean square error decreases as the area where turbulent Schmidt number is selectively assigned becomes large (small).
Keywords:
CFD model, pollutant concentration, wind speed, turbulent Schmidt number, street canyon1. 서 론
난류 슈미트 수(turbulent Schmidt number, Sct)는 대기 난류 운동에 의한 운동량 확산 계수와 질량 확산계수의 비로 표현되는 무차원수로 수치 실험에서 운동량과 질량의 확산 및 대류 과정을 동시에 고려하는 유체에서 질량에 대한 난류 확산 계수를 결정하는데 사용된다(Flesch et al., 2002). Sct는 대기오염물질과 같은 스칼라 물질의 확산과 분포 형성에 중요하다(He et al., 1999; Koeltzsch, 2000; Flesch, 2002; Riddle et al., 2004; Huang et al., 2005; Tang et al., 2006; Wang et al., 2006). Koeltzsch (2000)는 대기 경계층 내부에서 고도 변화에 따른 Sct에 대한 민감도 분석을 수행하였으며, Tang et al. (2006)은 실제 도시 지역의 확산 조건에 부합하는 Sct를 산출하기 위하여 지표 고도에서 굴뚝으로부터 배출된 대기오염물질의 확산에 대한 Sct를 변화시키는 실험을 수행하였다. Wang et al. (2006)은 굴뚝 높이와 Sct에 따른 대기오염물질의 확산 특성 연구를 수행하였다. 대기 확산 모델을 이용한 대부분의 이전 연구들에서는 도시 지역에서의 Sct를 고정된 수로 사용하였다(Zhang et al., 1996; Brzoska et al., 1997; Li and Stathopoulos, 1997; Baik et al., 2003; Kim and Baik, 2003; Lien et al., 2006; Wang and McNamara, 2006). 그러나 실제 도시 지역에서는 풍속, 기온, 건물 크기와 위치 등에 따라 대기 오염물질의 확산 속도가 다르기 때문에, 특성에 따른 Sct의 설정이 필요하다.
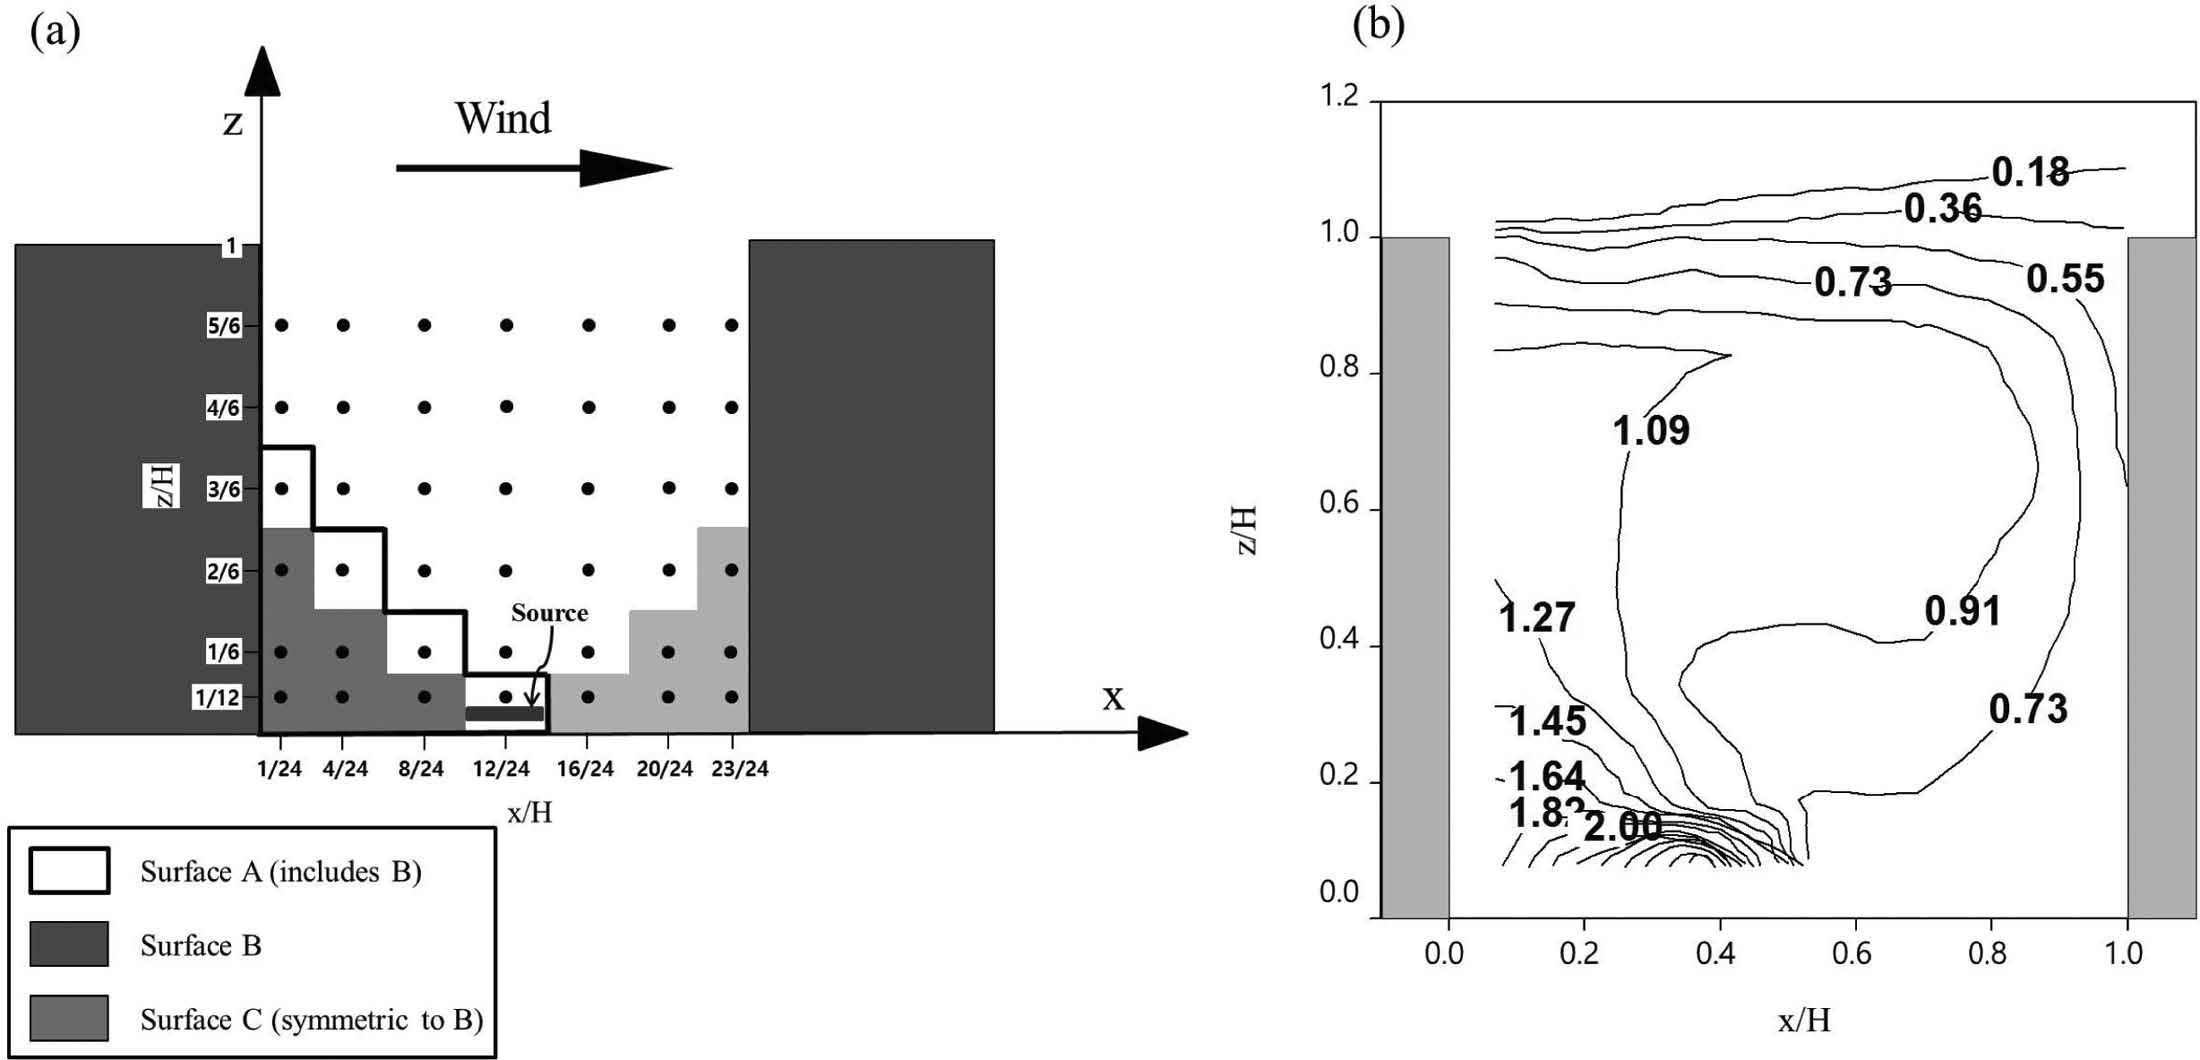
(a) Building configuration and sampling locations and (b) contours of relative concentration (K/K¯) measured in the 20th street canyon in Pavageau and Schatzmann (1999).
최근에는 도시 지역에서의 흐름과 확산 연구를 위하여 상세 규모에 대한 흐름과 확산 분석이 가능한 전산유체역학(computational fluid dynamics, CFD) 모델이 주로 사용되고 있다(Kim and Baik, 2005; Lee and Kim, 2011; Park et al., 2013). CFD 모델은 흐름과 대기오염물질 확산에 대한 개개 건물의 영향과 작은 규모의 대기 운동을 효과적으로 고려할 수 있다(Kim and Baik, 2005). CFD 모델이 상세한 건물과 지형을 고려함으로써 상세 규모의 대기오염물질 확산을 기존의 가우시안 모델보다 현실적으로 재현할 수 있으나, 풍속과 지형 특성을 반영한 Sct의 사용이 필요하다. 본 연구에서는 CFD 모델을 이용하여 외관비가 1인 도시 협곡에서 유입 풍속이 변할 때, 대기오염물질 확산의 Sct에 대한 민감도 실험을 수행하고, Pavageau and Schatzmann (1999)의 풍동 실험 결과와 비교함으로써 보다 현실적인 대기오염물질 확산 수치 모의를 위해 필요한 적정 Sct의 범위를 제안하고자 한다.
2. 연구 방법
2.1 풍동 실험 개요
Pavageau and Schatzmann (1999)은 독일 Hamburg 대학 풍동 실험 장치를 이용하여, 도시 협곡 바닥 근처의 선오염으로부터 배출된 대기오염물질의 농도 분포를 연구하였다. 26개의 건물과 외관비(도시 협곡 높이와 너비의 비)가 1인 25개의 도시 협곡을 고려하였고, 분석은 20번째 도시 협곡에서 수행하였다. Figure 1a와 같이 도시 협곡 중앙에 위치한 선오염원으로부터 대기오염물질을 배출시켰다. 관측 농도(C), 참고 고도에서의 풍속(UH), 도시 협곡 높이(H), 도시 협곡 길이(L), 배출율(Q)를 이용하여 무차원화한 농도(K)를 다음과 같이 정의하였다.
| (1) |
Pavageau and Schatzmann (1999)에 따르면, 도시 협곡 평균 농도()는 55이고, 도시 협곡에서 정의한 3구역(A, B, C in Fig. 1a)의 평균 농도는 각각 120, 91, 32이다. 본 연구에서는 풍속, 도시 협곡 높이와 길이, 배출량에 대한 의존성을 소거하기 위하여, 대기오염 물질 농도를 평균 농도로 나눈 상대 농도()를 비교에 사용하였다. Figure 1b는 Pavageau and Schatzmann (1999)이 측정한 상대 농도장을 나타낸다. 외관비가 1인 도시 협곡에서 나타나는 전형적인 대기오염물질 분포 패턴이 나타남을 확인할 수 있다. 도시 협곡 바닥 근처에서는 지붕 고도의 유입류와 반대 방향을 갖는 역류(reverse flow)가 오염원을 지나게 된다. 이 흐름은 풍상측 건물 근처에서 상승하고 풍하측 건물 부근에서 하강하게 되는데, 이와 같은 흐름 패턴의 영향으로 도시 협곡 풍상측 바닥 근처, 풍상측 건물 부근, 도시 협곡 지붕 고도 부근, 풍하측 건물 부근으로 가면서 대기오염물질 농도가 낮아지는 것을 확인할 수 있다.
2.2 수치 실험 방법
본 연구에서 사용한 CFD 모델은 Park and Kim (2014)이 사용한 것과 동일하다. 이 모델은 3차원, 비정수, 비회전, 비압축 대기 흐름계를 가정하며, 코리올리 효과를 배제한다. 난류 모수화를 위하여 표준 κ−ε 난류 종결 방법을 사용한다. Reynolds-averaged Navier-Stokes equations (RANS) 방정식에 기초한 지배방정식 계는 엇갈림(staggered grid system) 격자계에서 유한체적법(finite volume method)과 Patankar (1980)가 제안한 SIMPLE (semi-implicit method for pressure-linked equation) 알고리즘을 사용하여 풀이된다. 벽면 경계에서는 난류 경계층 효과를 잘 반영하도록 벽면 함수(wall function)를 사용하였다(Versteeg and Malalasekera, 1995).
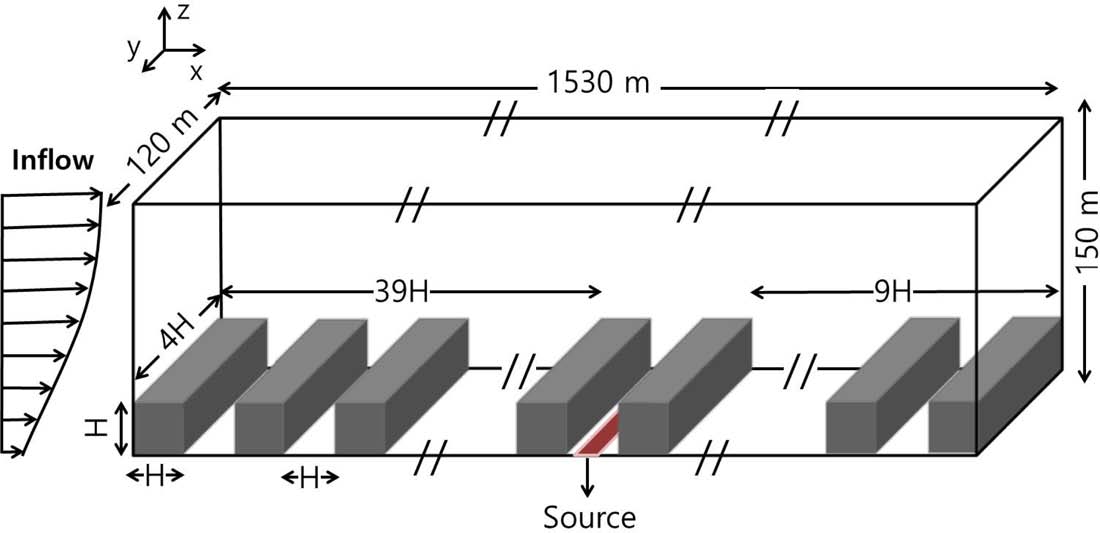
본 연구에서는 Pavageau and Schatzmann (1999)의 풍동 실험 결과와 비교하기 위하여, 풍동 실험과 동일한 건물 구조로 구축하였다(Fig. 2). 모델 격자수는 x, y, z 방향으로 각각 1530, 20, 150개이고, 격자 크기는 x, y, z 방향으로 각각 1 m, 6 m, 1 m이다. 건물높이, 너비, 길이는 각각 30 m, 120 m, 30 m로 설정하였으며, 26개의 건물과 25개의 도시 협곡을 고려하였다. 바람(U,V,W)의 유입 조건은 Pavageau and Schatzmann (1999)과 동일한 지수 법칙[식(2)~(4)]을 사용하였고, 난류 운동 에너지(k)와 그 소멸율(ε)은 Castro and Apsley (1997)의 연직 분포[식(5)와 (6)]를 사용하였다.
| (2) |
| (3) |
| (4) |
| (5) |
| (6) |
여기서, u*, κ, δ는 각각 마찰 속도, 거칠기 길이(= 0.05 m), von Karman 상수(= 0.4), 경계층 두께(= 1000 m)를 나타내고, Cμ는 경험적 상수(= 0.0845)를 나타낸다(Yakhot et al., 1992). zref는 30 m로 건물 높이와 같고 Uref는 zref에서의 풍속을 나타낸다. 먼저 0.5초 간격으로 3600초 동안 CFD 모델을 수치 적분하여, 정상 상태에 도달한 대기 흐름장을 구축한다. 정상 상태에 도달한 대기 흐름장을 이용하고, 선오염원 상의 매 격자점에서 800 ppb s−1로 비율로 오염물질이 배출된다고 가정하여, 대기 확산 모델을 0.5초 간격으로 3600초까지 수치 적분하였다.

Turbulent Schmidt number (Sct) selectively assigned in the street canyon based on mean kinetic energy.
건물 지붕 고도(H)에서의 유입 풍속(UH)을 1.5 m s−1부터 10 m s−1까지 0.5 m s−1간격으로 체계적으로 변화시켰다. 각 UH에 대해, 도시 협곡에서 난류 슈미트 수(Sct)에 대한 대기오염물질 확산의 민감도 분석을 수행하였다. 선행 연구에 따르면, 0.7에서 0.9 사이의 Sct사용이 일반적이고, 최대 0.2에서 1.3 사이의 값이 사용되어 왔다(Tominaga and Stathopoulos, 2007). 민감도 분석을 위해, 각각의 UH에 대해, Sct를 0.2부터 1.3까지 0.1 간격으로 변화시켰고, 이 결과를 Pavageau and Schatzmann (1999)의 풍동 실험과 비교하였다. 보다 현실적인 대기 확산 현상을 수치 모의하기 위해서는 고정된 Sct를 사용하기 보다는 풍속 크기에 따라 적절한 Sct를 차등 적용하여 사용할 필요가 있다(Yimer et al., 2002). 따라서, 본 연구에서는 도시 협곡 내부의 평균 운동 에너지(mean kinetic energy) 크기에 따라 Sct를 차등적으로 적용한 실험(Table 1)과 Sct를 차등 적용하는 영역을 변화시키는 실험을 추가로 수행하였다(Fig. 3).
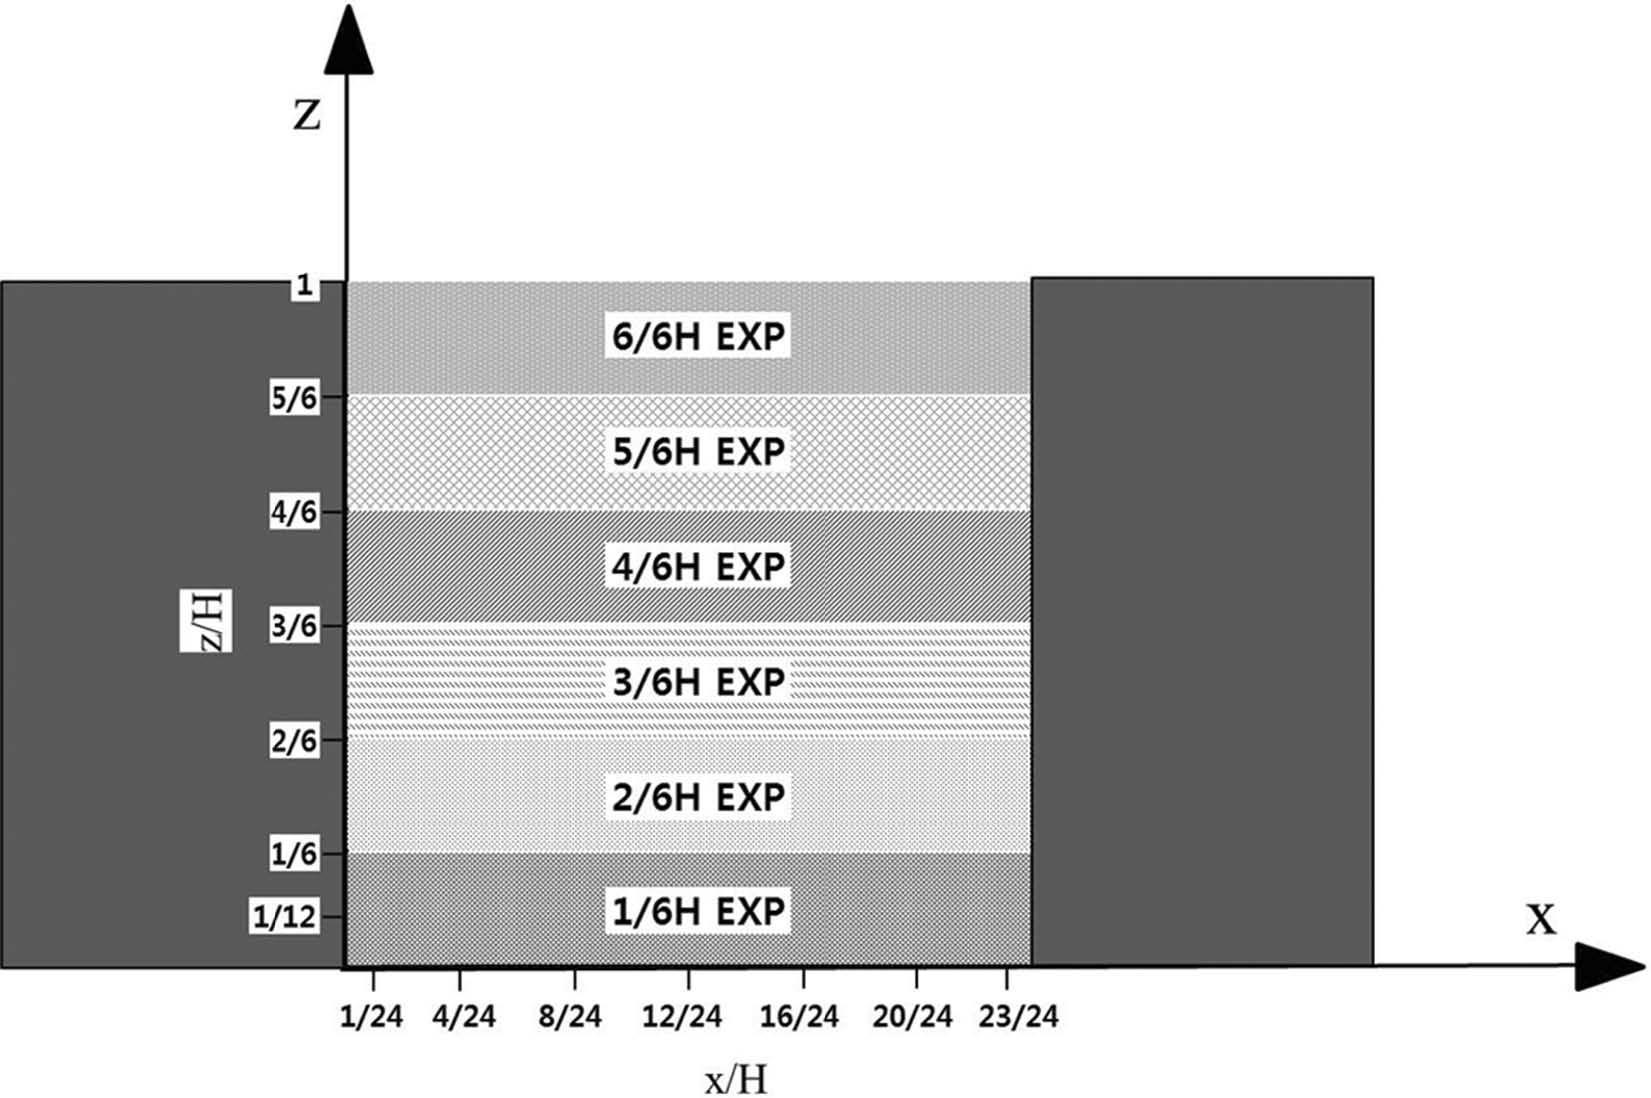
The areas where selected turbulent Schmidt number is assigned based on mean kinetic energy as in Table 1. Here, 1/6H, 2/6H, 3/6H, 4/6H, 5/6H, and 6/6H EXPs indicate that selected turbulent Schmidt number is assigned from the street bottom (z/ H = 0) to z/H = 1/6, 2/6, 3/6, 4/6, 5/6 , and 6/6, respectively.
3. 결과 및 고찰
3.1 유입류 풍속과 난류 슈미트 수의 영향
대기오염물질 확산에 대한 유입류 풍속 민감도 분석을 수행하였다. Figure 4는 20번째 도시 협곡의 중앙(y/H = 2.0)에서 조사한 바람 벡터장을 나타낸다. UH가 증가하여도 도시 협곡에 형성된 흐름 패턴은 거의 일정하게 나타났다. 도시 협곡으로 유입되는 바람은 풍하측 건물 부근에서 하강한다. 도시 협곡 하층(z/H < 0.5)에서는 유입류와 반대 방향의 역류(reverse flow)가 나타난다. 하층의 역류는 풍상측 건물 부근에서 상승하면서 도시 협곡 내부에 소용돌이가 형성된다. 3차원 도시 협곡에서는 소용돌이 중심 위치가 풍상측과 지붕 고도 부근에 치우쳐 나타난다(Kim and Baik, 2004; Park et al., 2015). 그러나 y 방향으로 무한히 긴 2차원 도시 협곡을 가정한 본 연구에서는 중심 위치가 도시 협곡 중심(x/H = 0.5, z/H = 0.5)에 위치한 roll-type의 소용돌이가 형성되었고, 이 결과는 Baik et al. (2007)과 유사하다. Figure 5는 UH가 1.5, 5, 10 m s−1인 경우, Sct를 0.5와 0.9로 설정하여 수치 모의한 대기오염물질의 무차원 농도장을 나타낸다. 풍동 실험과 비교하였을 때, 전반적으로 대기오염물질 분포패턴은 비교적 잘 모의됨을 확인할 수 있다. 유입류 풍속이 증가함에 따라, 도시 협곡 내에 형성된 소용돌이 강도가 증가하고(Fig. 4) 풍속 증가에 의해 대기오염물질의 이류가 강화되면서 풍상측에서는 농도가 낮아지고 풍하측에서는 농도가 높아지는 것을 확인할 수 있다. 또한, Sct가 0.5인 경우가 0.9인 경우보다 풍상측(풍하측)의 농도가 높게(낮게) 나타남을 확인할 수 있다(Figs. 5 and 6).
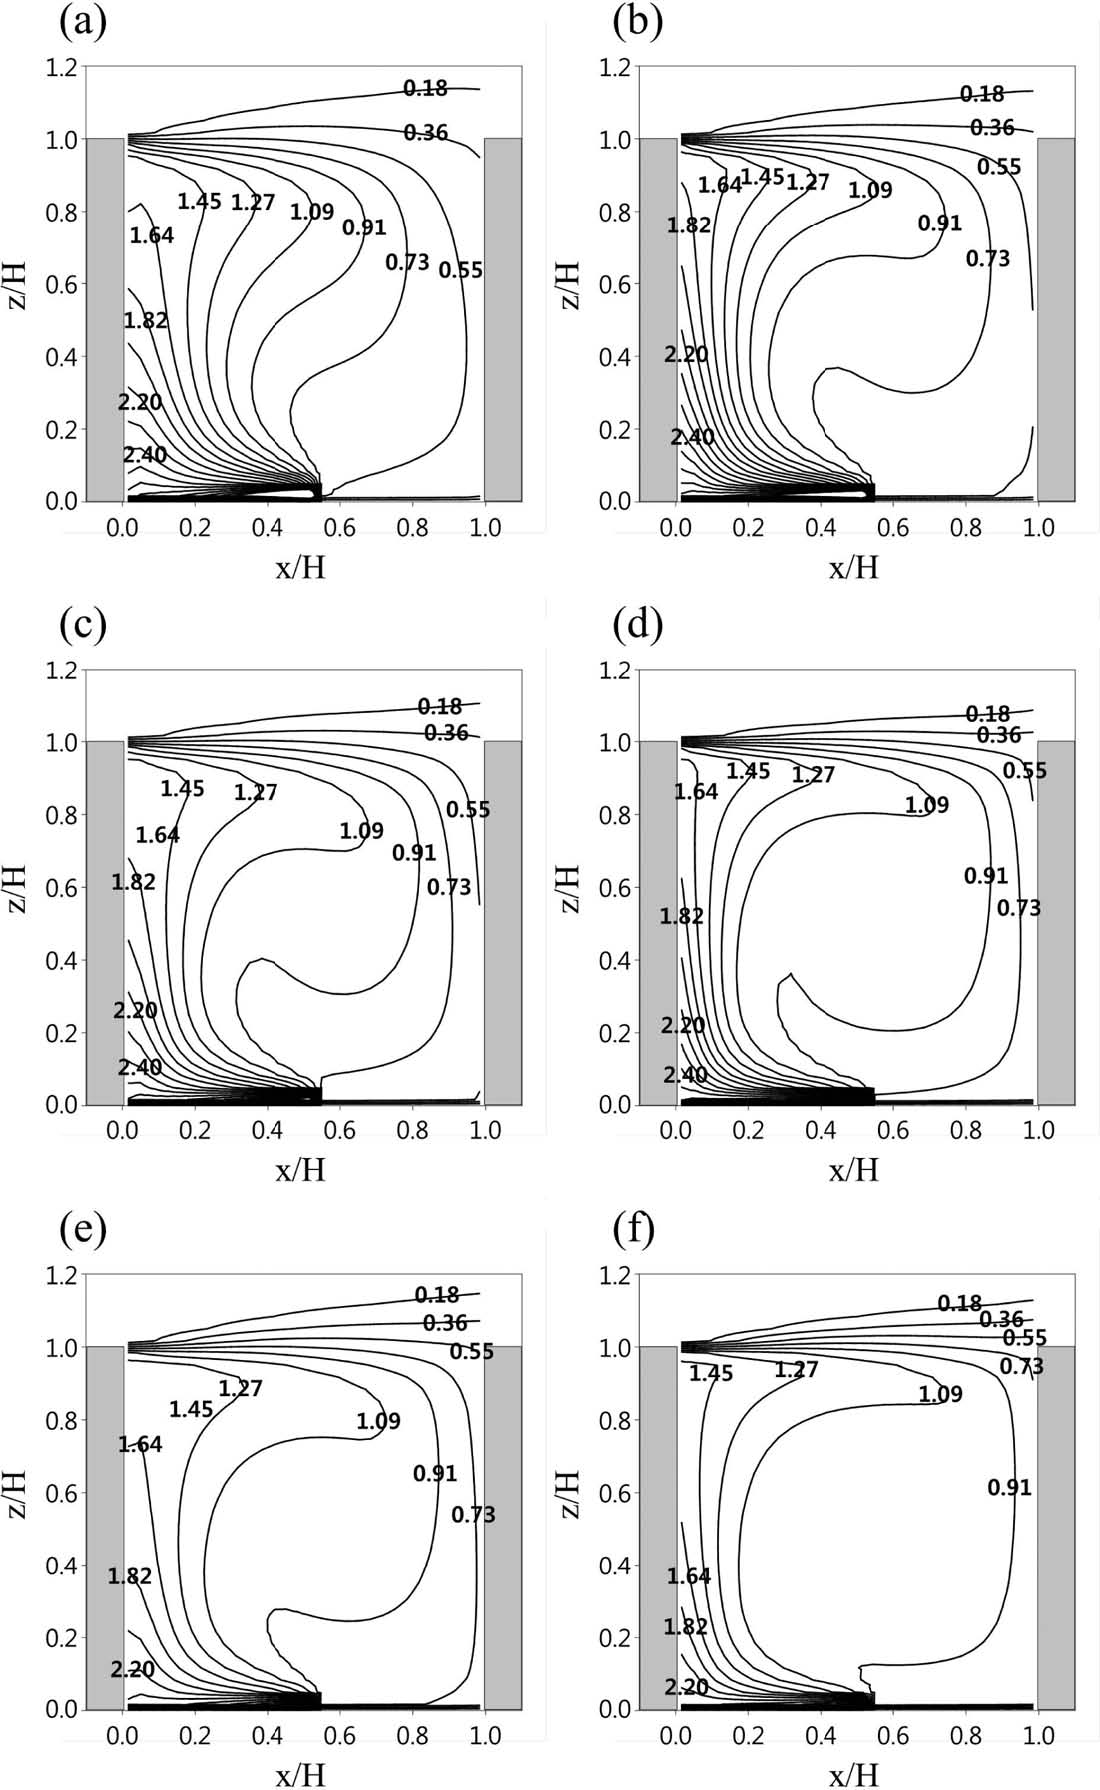
Contours of relative concentration (K/K¯) in the 20th street canyon simulated with the turbulent Schmidt number (Sct) of 0.5 (left panel) and 0.9 (right panel) in the cases of the inflow wind speed (UH) of 1.5 [(a) and (b)], 5 [(c) and (d)], and 10 m s−1 [(e) and (f)] at z = H.
유입류 풍속이 일정할 때, Sct에 따른 도시 협곡 내부의 대기오염물질 확산 재현 능력을 조사하였다. Figure 6은 UH가 1.5, 5, 10 m s−1일 때 Sct의 변화에 따른 상대농도의 풍동 실험에 대한 편차(mean bias)와 제곱근 오차(root mean square error, RMSE)를 도시 협곡 내부 영역별(surface A, B, and C in Fig. 1a)로 나타낸 것이다. UH가 1.5 m s−1일 때(Fig. 6a), A 영역에서는 모든 Sct에 대해서 농도를 과대 모의하였고, Sct가 증가함에 따라 풍동 실험과의 편차가 감소하였다. 비교적 높은 농도가 나타나는 B 영역에서 Sct에 대한 변화 경향은 A 영역과 유사하게 나타났다. 그러나, B 영역의 편차 크기는 A 영역보다 작게 나타났다. B 영역에서 Sct가 1.0 이하일 때에는 과대 모의하였으나 1.1 이상에서는 과소 모의하였다. 풍하측 영역인 C 영역에서는 Sct가 1.1 이하일 때, 과소 모의하였고, 그 크기는 감소하였다. 세 영역의 제곱근 오차(RMSE)는 Sct가 증가할수록 감소하였다. UH가 5 m s−1 일 때(Fig. 6b), A 영역에서는 Sct가 0.3 이하일 때에는 과대 모의를, 0.4 이상일 때에는 과소 모의를 하였고, Sct가 증가함에 따라 편차가 증가하는 경향을 보였다. B 영역의 농도는 모든 Sct에 대해 과소 모의를 하였고, Sct가 증가함에 따라 편차가 증가하는 것을 확인할 수 있다. C 영역에서는 Sct가 0.2를 제외하고는 과대 모의를 하였고 Sct가 증가함에 따라 편차가 증가하였다. 세 지역에서 구한 RMSE는 Sct가 증가함에 따라 증가하였다. UH가 10 m s−1일 때는 Sct가 0.2일 때를 제외하고는 UH가 5 m s−1인 경우와 유사한 변화 경향을 보였고, 편차는 더 크게 나타났다 유입류 풍속이 증가할수록, 오염원 근처의 풍속이 강해지고 평균 바람에 의한 이류 효과가 커지면서 풍상측 건물 부근의 대기오염물질 농도를 과소 모의하는 경향이있고, 풍하측 건물 부근에서는 소용돌이에 의해 이류된 대기오염물질이 증가하면서 과대 모의하는 경향이 나타난 것으로 판단된다. UH가 약할 때에는 Sct가 클수록, 즉, 난류에 의한 확산 효과가 작을수록 풍동 실험 결과와의 편차가 감소하였다. 그러나 UH가 비교적 강할 때에는 Sct가 작을수록 풍동 실험 결과와의 편차가 감소하였는데, 선행 연구 결과(Wang, 2006)와 잘 일치한다.
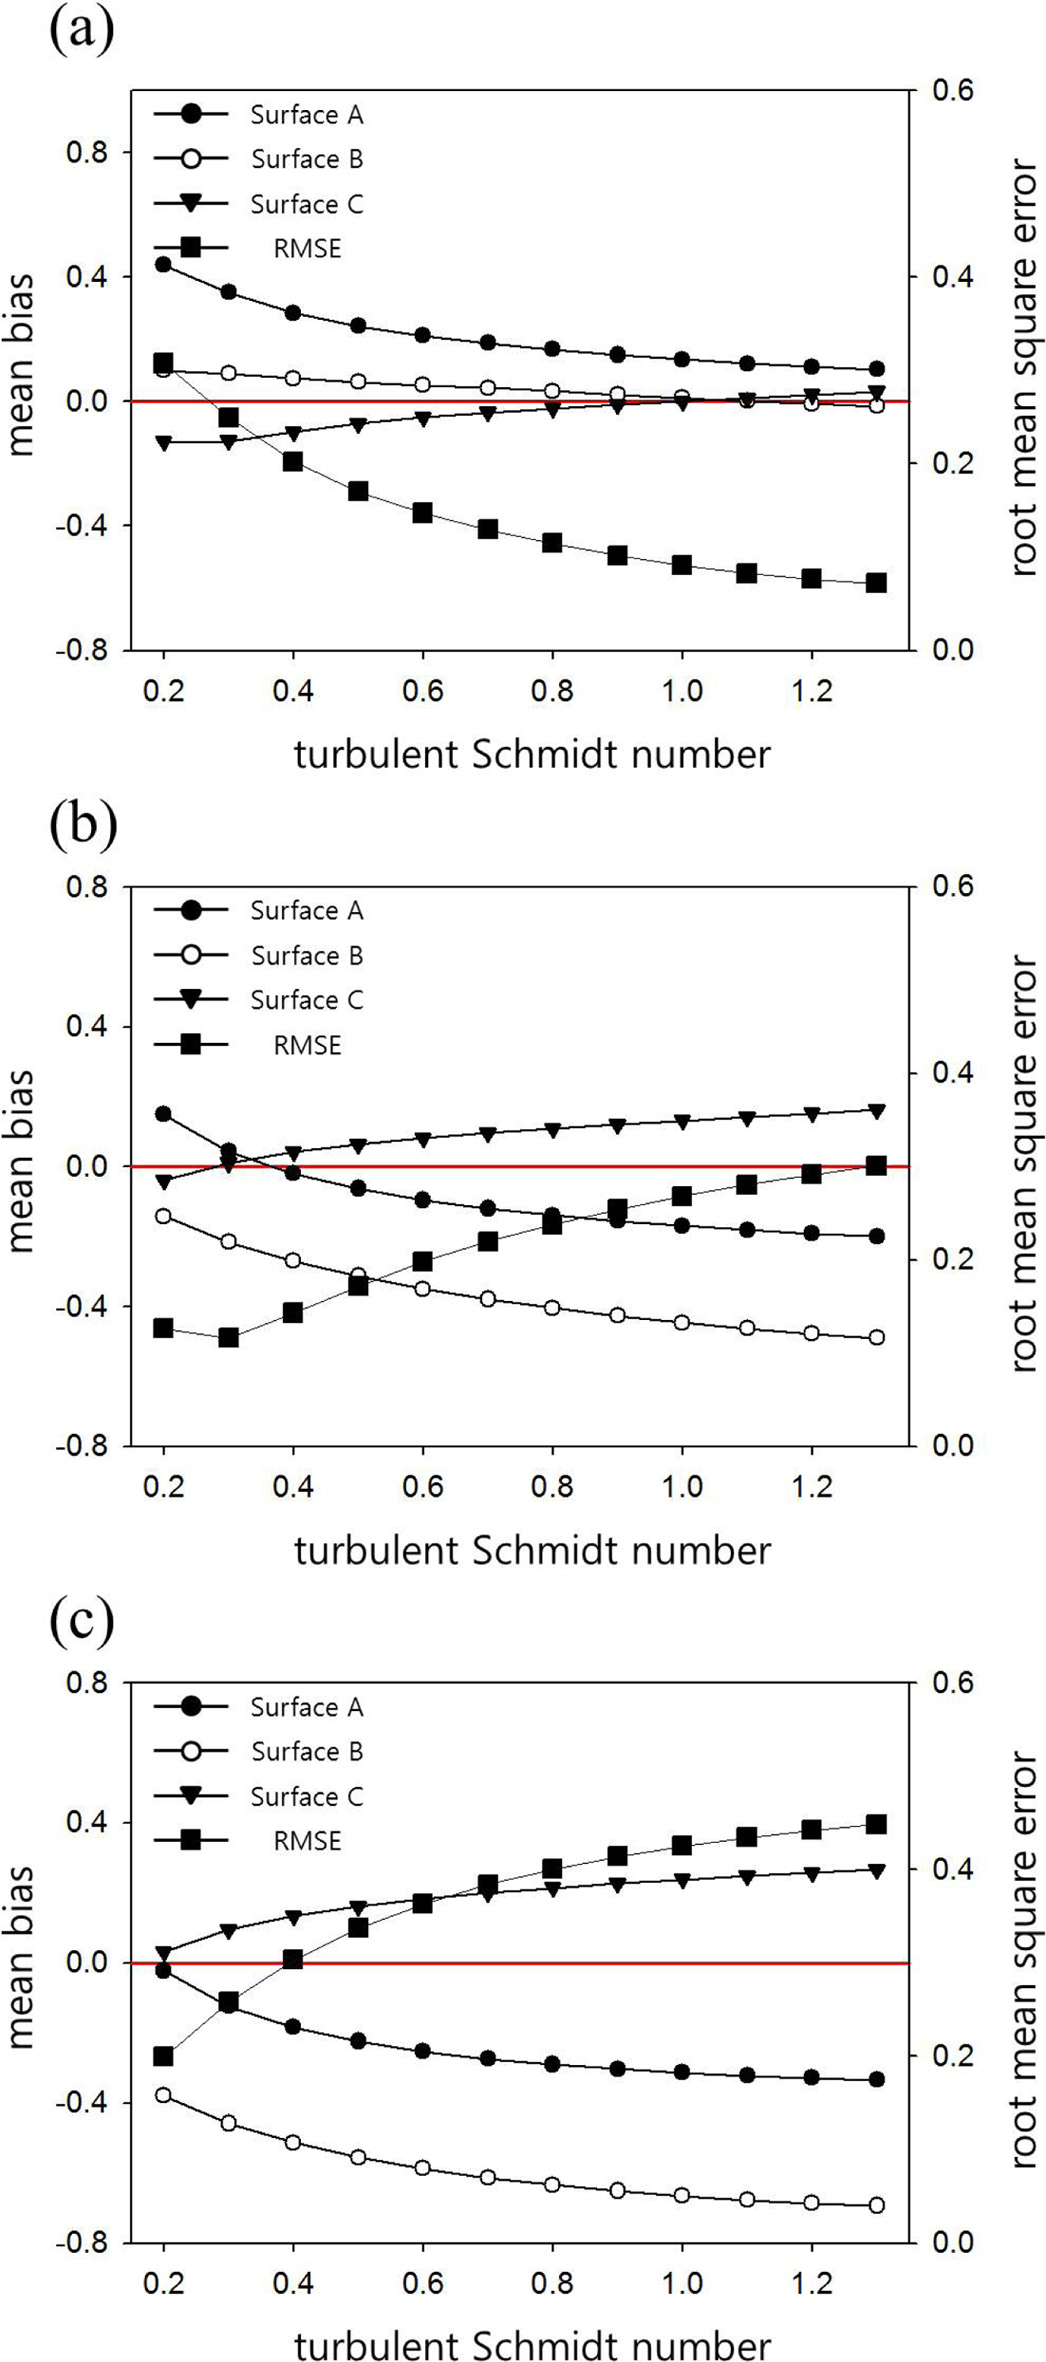
Mean bias defined as difference between simulated and measured relative concentrations in each measurement area (A, B, and C in Fig. 1a) and root mean square errors (RMSEs) averaged over the measurement areas in the case of the inflow wind speed (UH) of (a) 1.5, (b) 5.0, and (c) 10.0 m s−1 at z = H.
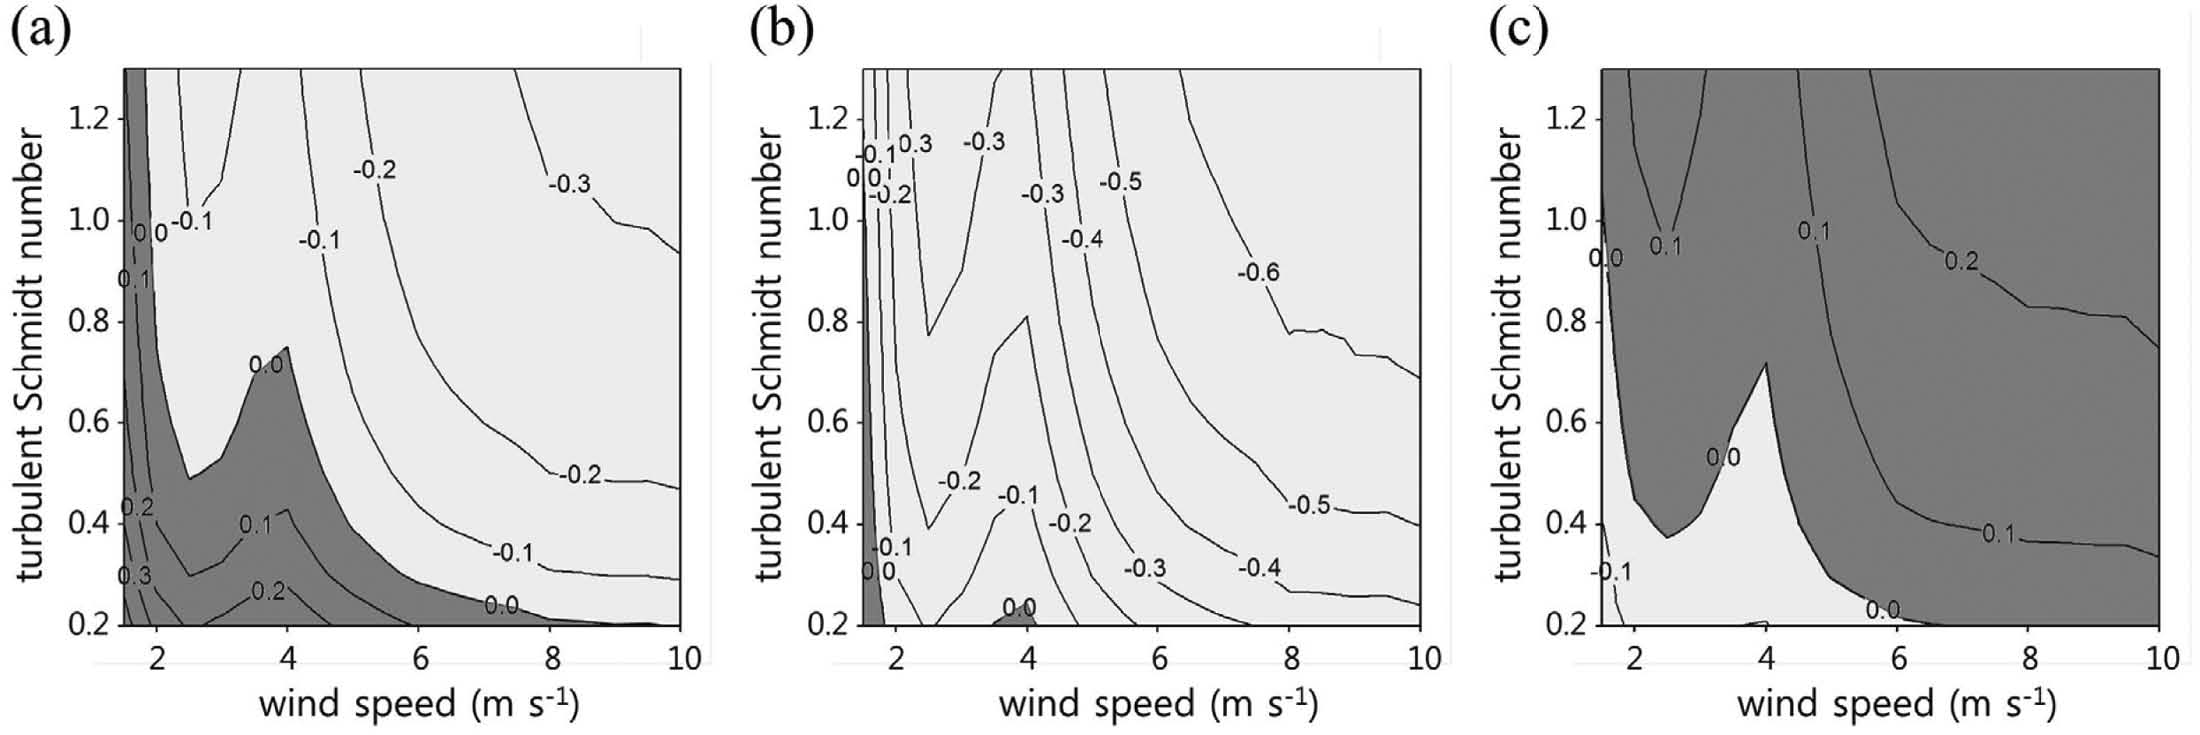
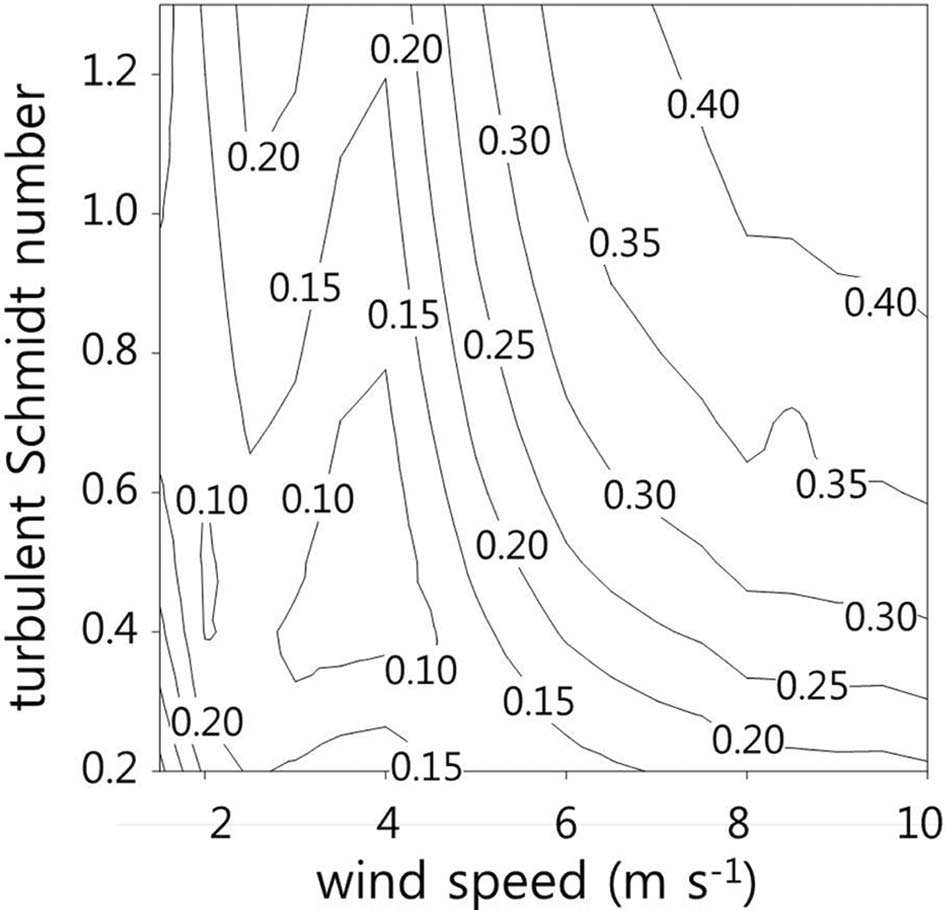
Isopleth of mean bias with inflow wind speed and turbulent Schmidt number (Sct) taken in the measurement area, (a) A, (b) B, and (c) C in Fig. 1a. Dark and light shadings indicate overestimation and underestimation of relative concentration, respectively.
Figure 7은 도시 협곡 내의 세 영역, A, B, C에서 UH와 Sct의 변화에 따른 대기오염물질 상대 농도의 편차를 나타낸다. A에서는 UH와 Sct가 비교적 큰 경우에 과소 모의하고 비교적 작은 경우에 과대 모의함을 확인할 수 있다(Fig. 7a). 이에 반해, B에서는UH가 2 m s−1 이상인 경우에는 대체로 과소 모의하였는데, 특히, Sct가 증가할수록 편차가 증가함을 볼 수 있다(Fig. 7b). C에서는 UH가 2 m s−1 이상인 경우에 대체로 과대 모의함을 볼 수 있다.
Figure 8은 도시 협곡에서 계산한 상대 농도의 RMSE를 UH와 Sct의 함수로 나타낸 것이다. UH가 2 m s−1이하인 경우에서 Sct에 대한 민감도가 매우 작았고 Sct가 작은 경우보다는 큰 경우에 RMSE가 작게 나타났다. UH가 2 m s−1 이상인 경우에는 대체로 Sct가 작을수록 RMSE가 감소하였다. 그러나, UH가 약 3~5 m s−1이고 Sct가 0.3~0.7 사이일 때, RMSE가 낮게 나타남을 확인할 수 있다. 앞의 결과를 종합해 보면, UH가 비교적 작을 때에는 Sct를 비교적 크게 설정할수록 보다 현실적인 대기오염물질 확산을 수치 모의할 수 있고, UH가 비교적 강할 때에는 Sct를 작게 설정할수록 보다 현실적인 대기오염물질 확산을 수치 모의할 수 있음을 시사한다.
3.2 난류 슈미트 수의 차등 적용
앞에서 제시한 바와 같이, UH와 Sct에 따라 도시 협곡 내 대기오염물질 확산에 대한 수치 모의 능력에 비교적 큰 차이가 나타났다. 선행 연구(Tominaga and Stathopoulos, 2007)에 따르면, 대기오염물질 확산에 대한 수치 모의 능력 향상을 위해서는 풍속의 크기 및 건물 구조에 따라 적절한 Sct의 선택이 필요하다. 본 연구에서는 오염원이 존재하는 20번째 도시 협곡 내에서 평균 운동 에너지 크기에 따라 Sct를 선택적으로 채택하는 수치 실험을 수행하였다. 이를 위하여, 각각의 UH에 대한 실험에서 도시 협곡 내부의 평균운동 에너지에 대해 RMSE가 가장 작게 나타나는 Sct의 조사를 선행하였다(Table 1). 풍동 실험의 농도관측지점(black dots in Fig. 1a) 위치를 반영하여 오염원이 위치한 영역을 포함하면서 Sct를 선택적으로 적용하는 영역을 도시 협곡 높이(H)의 1/6부터 1까지 1/6H간격으로 증가시키는 수치 실험을 수행하였다(Fig. 3). Sct를 차등적으로 적용 하지 않은 나머지 영역에 대해서는 각 풍속에서 RMSE가 가장 작게 나타나는 Sct (Fig. 6)를 적용하였다.
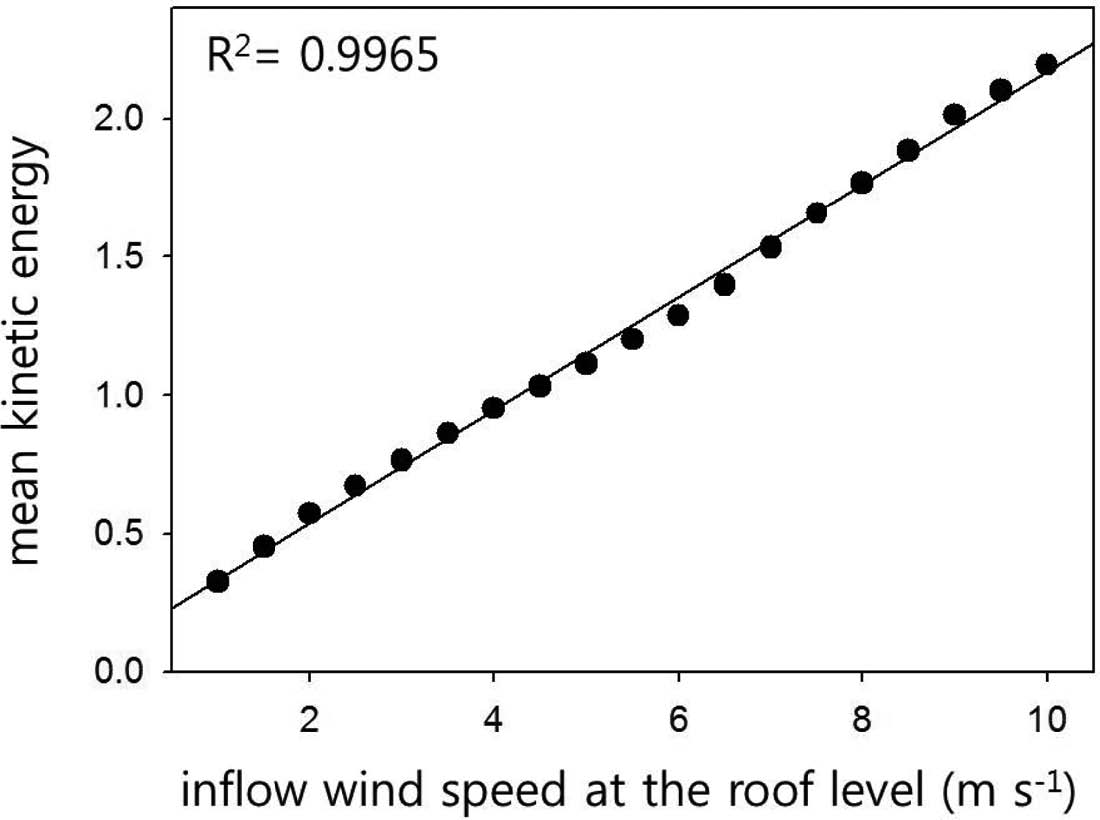
Correlation between inflow wind speed at the roof level (z/H = 1) and mean kinetic energy averaged over the street canyon.
Figure 9는 UH와 도시 협곡 내에서 평균한 평균 운동 에너지의 상관 관계를 나타낸다. UH가 증가함에 따라 평균 운동 에너지가 거의 선형적으로 증가한 것을 확인할 수 있다. 즉, 도시 협곡 내 평균 운동 에너지는 UH의 크기를 잘 반영하여 나타남을 알 수 있다.
Figure 10a는 각 UH에 대해 Sct 변화에 따른 RMSE 평균과 변화폭을 나타내고, Fig. 10b는 Table 1과 같이 평균 운동 에너지에 따라 Sct를 선택하고, Fig. 3과 같이 이를 적용한 영역을 변화시켰을 때에 평균한 RMSE를 나타낸다. UH가 4.5 m s−1 이상인 경우에 Sct를 선택적으로 지정하는 방법의 효과가 크게 나타나고, RMSE가 현저하게 감소(최대 60%)하는 것을 확인할 수 있다. 이는, Fig. 8에 나타난 바와 같이, UH가 작을 때에는 Sct에 따른 RMSE의 차가 비교적 크지 않고(최대 0.1), 반대로 UH가 클 때에는 Sct에 따른 RMSE의 차가 상대적으로 크게 나타나기 때문(최대 0.2)인 것으로 판단된다. UH가 5.0 m s−1 이하인 경우에는 도시 협곡 내부에서 Sct를 선택적으로 적용하는 영역이 클수록 RMSE 감소 효과가 크게 나타나지만, UH가 5.5 m s−1 이상인 경우에는 반대로 나타났다.
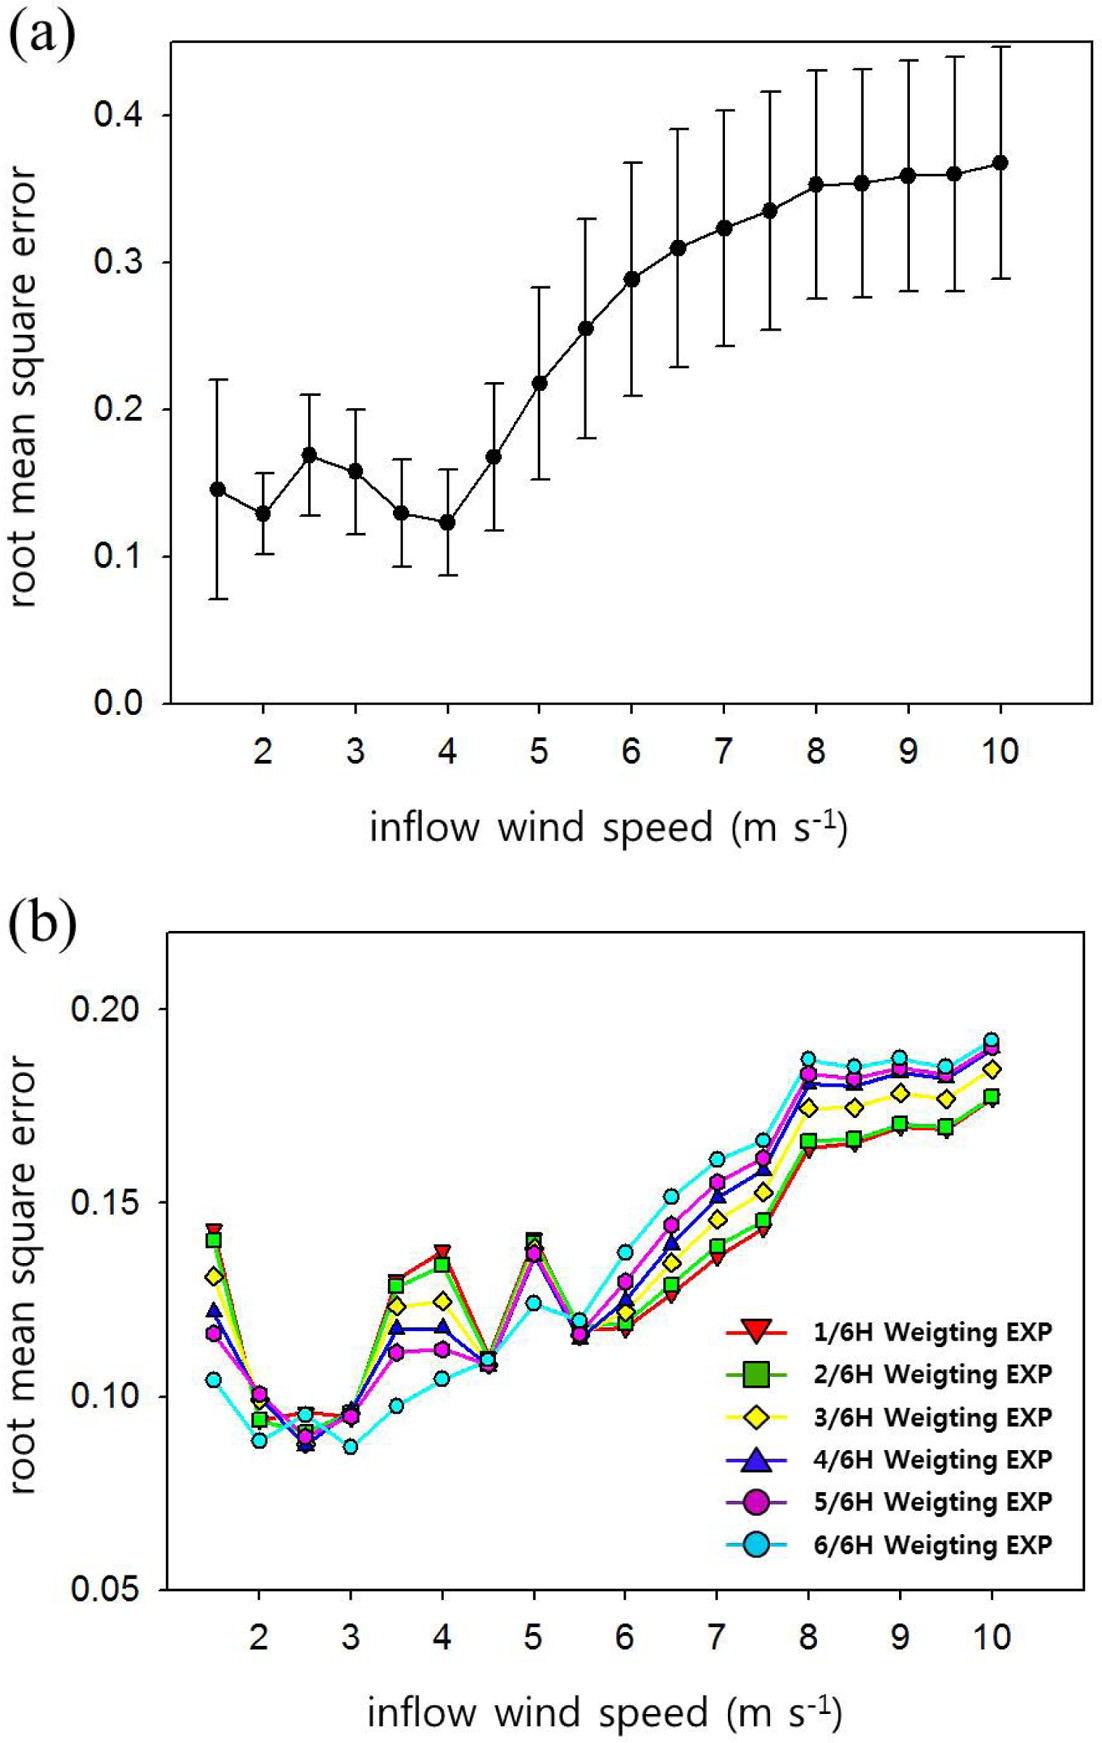
RMSEs with inflow wind speed in the cases (a) that constant turbulent Schmidt number is applied in the whole numerical domain and (b) that selected turbulent Schmidt numbers are applied in the street canyon. In (a), RMSE is averaged for all turbulent Schmidt number at fixed inflow wind speed and error bars indicate the ranges of RMSE with turbulent Schmidt number at fixed inflow wind speed.
선행 연구 결과로부터 보고된 바와 같이, 보다 현실적으로 대기오염물질 확산 현상을 수치 모의하기 위해서는 고려하는 건물 모양이나 바람의 세기에 따라 적절한 Sct의 사용이 필요하다. 본 연구에서 고려한 이상적인 도시 협곡에서는 공간적으로 고정한 Sct를 사용하기보다는 평균 운동 에너지의 크기에 따라 선택적으로 지정한 Sct의 사용이 대기오염물질 농도 예측에 있어서 풍동 실험 결과와의 차를 줄일 수 있는 방법임을 알 수 있다.
4. 요약 및 결론
본 연구에서는 이상적인 도시 협곡에서 수행한 풍동 실험 결과를 기반으로 유입류 풍속과 난류 슈미트수에 대한 민감도 분석을 통하여 보다 현실적인 대기확산 수치 모의를 위한 난류 슈미트 수 산정 방법을 연구하였다. 유입류 풍속과 난류 슈미트 수의 민감도 분석을 위하여 건물 높이에서의 유입 풍속을 1.5 m s−1부터 10 m s−1까지 0.5 m s−1 간격으로 체계적으로 변화시켰고, 각각의 유입류 풍속에 대해 난류 슈미트 수를 0.2부터 1.3까지 0.1 간격으로 변화시켜 수치 실험을 수행하였다. 각각의 수치 실험 결과를 Pavageau and Schatzmann (1999)의 풍동 실험 장치를 이용한 도시 협곡에서의 대기오염물질 확산 실험 결과와 비교·분석 하였다. 또한, 도시 협곡 내부의 평균 운동 에너지의 크기에 따라 난류 슈미트 수를 차등적으로 적용하는 수치 실험을 추가적으로 수행하였다.
건물 높이의 유입류 풍속이 1.5 m s−1인 경우에는 난류 슈미트 수가 증가함에 따라 도시 협곡 풍상측에서는 풍동 실험과의 편차가 감소하였다. 풍하측에서는 난류 슈미트 수가 1.0 이하일 때에는 과대 모의하였으나 1.1 이상에서는 과소 모의하였고 편차의 크기는 감소하였다. 건물 높이의 유입류 풍속이 5 m s−1일 때, 풍상측에서는 난류 슈미트 수가 0.3 이하일 때 과대모의를, 0.4 이상일 때에는 과소 모의를 하였고 난류 슈미트 수가 증가할수록 편차가 증가하였다. 풍하측에서는 난류 슈미트 수가 0.2 를 제외하고는 과대 모의 하였고 난류 슈미트 수가 증가함에 따라 편차가 증가하였다. 건물 높이의 유입류 풍속이 10m s−1일 때, 풍상측과 풍하측에서의 편차 경향이 건물 높이의 유입류 풍속이 5 m s−1인 경우와 유사하게 나타났으나 그 크기가 증가하였다. 즉, 유입류 풍속이 증가할수록 대기오염물질 이류가 증가하면서 풍상측 건물 부근의 대기오염물질 농도를 과소 모의하였고, 풍하측 건물 부근에서는 이류에 의해 대기오염물질이 증가하면서 과대 모의하였다. 따라서, 도시 협곡에서의 대기오염물질의 확산을 수치 모의할 때, 유입류가 약한 경우에는 난류 슈미트 수를 크게 설정하고, 반대로, 유입류가 강한 경우에는 난류 슈미트 수를 작게 설정하면, 보다 현실적인 수치 모의가 가능할 것으로 판단된다.
도시 협곡 내 평균 운동 에너지 크기 구간별로 난류 슈미트 수를 선택적으로 설정한 실험을 수행하였다. 평균 운동 에너지 크기에 따라 난류 슈미트 수를 차등 적용한 수치 실험 결과는 고정된 난류 슈미트수를 적용한 실험에 비해 편차가 현저하게(최대 60%) 감소하였다. 유입류 풍속이 비교적 작은 경우(5.0 m s−1 이하)에는 도시 협곡 내부에서 난류 슈미트 수를 선택적으로 적용하는 영역이 클수록 오차 감소 효과가 크게 나타났고, 유입류 풍속이 비교적 큰 경우(5.5 m s−1 이상)에는 반대의 결과가 나타났다.
지금까지 풍동이나 수조(water tank) 실험 결과로부터 수치 모델의 성능을 검증해 온 대부분의 연구는 풍동이나 수조에서 사용한 모형 건물과 실제 크기의 건물을 상사(similarity) 관계를 이용하고, 풍동이나 수조 실험에서 사용한 유입류의 연직 분포를 이용하였다. 본 연구 결과에 따르면, 모형 건물에 대한 실험결과와 수치 모의 결과를 비교·검증할 때에 유입류 풍속의 선택에 신중함을 기해야 하고, 보다 현실적으로 대기오염물질 확산을 모의할 때에는 적절한 난류 슈미트 수의 선택이 필요하다는 것을 알 수 있다.
도시 지역에서 보다 현실적인 대기오염물질 확산을 수치 모의 하기 위한 난류 슈미트 수를 선정함에 있어서 고려하는 건물의 형태, 바람의 세기, 외관비 등의 요소에 의한 효과에 대하여 추가적인 연구가 필요할 것으로 판단된다.
Acknowledgments
이 연구는 기상청 기상산업 지원 및 활용기술개발사업(KMIPA2015-5042)의 지원으로 수행되었습니다. 논문에 대해 유익한 지적을 해주신 심사위원님께 감사드립니다.
References
-
Baik, J.-J., J.-J. Kim, and H.-J.-S. Fernando, (2003), A CFD Model for Simulating Urban Flow and Dispersion, J. Appl. Meteorol, 42, p1636-1648.
[https://doi.org/10.1175/1520-0450(2003)042<1636:ACMFSU>2.0.CO;2]

-
Baik, J.-J., Y.-S. Kang, and J.-J. Kim, (2007), Modeling reactive pollutant dispersion in an urban street canyon, Atmos. Environ, 41, p934-949.
[https://doi.org/10.1016/j.atmosenv.2006.09.018]

-
Brzoska, M.-A., D. Stock, and B. Lamb, (1997), Determination of plume capture by the building wake, J. Wind Engineering Industrial Aerodyn, 67&68, p909-922.
[https://doi.org/10.1016/S0167-6105(97)00128-1]

-
Castro, I.-P., and D.-D. Apsley, (1997), Flow and dispersion over topography: a comparison between numerical and laboratory data for two dimensional flow, Atmos. Environ, 31, p839-850.
[https://doi.org/10.1016/s1352-2310(96)00248-8]

-
Flesch, T.-K., J.-H. Prueger, and J.-L. Hatfield, (2002), Turbulent Schmidt number from a tracer experiment, Agric. Forest Meteor, 111, p299-307.
[https://doi.org/10.1016/S0168-1923(02)00025-4]

-
He, G., Y. Guo, and A.-T. Hsu, (1999), The effect of Schmidt number on turbulent scalar mixing in a jet-in-crossflow, Int. J. Heat and Mass Transfer, 42, p3727-3738.
[https://doi.org/10.1016/S0017-9310(99)00050-2]

-
Huang, H., J. Imran, A.-M. ASCE, and C. Pirmez, (2005), Numerical Model of Turbidity Currents with a Deforming Bottom Boundary, J. Hydrauric Engineering, 131, p283-293.
[https://doi.org/10.1061/(ASCE)0733-9429(2005)131:4(283)]

-
Kim, J.-J., and J.-J. Baik, (2003), Effects of inflow turbulence intensity on flow and pollutant dispersion in an urban street canyon, J. Wind Engineering Industrial Aerodyn, 53, p309-329.
[https://doi.org/10.1016/S0167-6105(02)00395-1]

-
Kim, J.-J., and J.-J. Baik, (2004), A numerical study of the effects of ambient wind direction on flow and dispersion in urban street canyons using the RNG k-ε turbulence model, Atmos. Environ, 38, p3039-3048.
[https://doi.org/10.1016/j.atmosenv.2004.02.047]

- Kim, J.-J., and J.-J. Baik, (2005), Classification of Flow Regimes in Urban Street Canyons Using a CFD Model, J. Korean Soc. Atmos. Environ, 21, p525-535.
-
Koeltzsch, K., (2000), The height dependence of the turbulent Schmidt number within the boundary layer, Atmos. Environ, 34, p1147-1151.
[https://doi.org/10.1016/S1352-2310(99)00369-6]

- Lee, Y.-S., and J.-J. Kim, (2011), Effects of an Apartment on Flow and Dispersion in an Urban Area, Atmos. Korean Meteor. Soc, 21, p95-108.
-
Li, Y., and T. Stathopoulos, (1997), Numerical evaluation of wind-induced dispersion of pollutants around a building, J. Wind Engineering Industrial Aerodyn, 67&68, p757-766.
[https://doi.org/10.1016/S0167-6105(97)00116-5]

-
Lien, F.-S., E. Yee, H. Ji, A. Keats, and K.-J. Hsieh, (2006), Progress and challenges in the development of physically- based numerical models for prediction of flow and contaminant dispersion in the urban environment, Int. J. Computational Fluid Dyn, 20, p323-337.
[https://doi.org/10.1080/10618560600898528]

-
Park, S.-J., D.-Y. Kim, and J.-J. Kim, (2013), Effects of Atmospheric Stability and Surface Temperature on Microscale Local Airflow in a Hydrological Suburban Area, Atmos. Korean Meteor. Soc, 23, p13-21.
[https://doi.org/10.14191/atmos.2013.23.1.013]

-
Park, S.-J., and J.-J. Kim, (2014), Effects of Building-roof Cooling on Scalar Dispersion in Urban Street Canyons, Atmos. Korean Meteor. Soc, 24, p331-341.
[https://doi.org/10.14191/atmos.2014.24.3.331]

-
Park, S.-J., J.-J. Kim, M.-J. Kim, R.-J. Park, and H.-B. Cheong, (2015), Characteristics of flow and reactive pollutant dispersion in urban street canyons, Atmos. Environ, 108, p20-31.
[https://doi.org/10.1016/j.atmosenv.2015.02.065]

- Patankar, S.-V., (1980), Numerical Heat Transfer and Fluid Flow.
-
Pavageau, M., and M. Schatzmann, (1999), Wind tunnel measurements of concentration fluctuations in an urban street canyon, Atmos. Environ, 33, p3961-3971.
[https://doi.org/10.1016/S1352-2310(99)00138-7]

-
Riddle, A., D. Carruthers, A. Sharpe, C. McHugh, and J. Stocker, (2004), Comparisons between FLUENT and ADMS for atmospheric dispersion modelling, Atmos. Environ, 38, p1029-1038.
[https://doi.org/10.1016/j.atmosenv.2003.10.052]

- Tang, W., A. Huber, B. Bell, and W. Schwarz, (2006), Application of CFD simulations for short-range atmospheric dispersion over open fields and within arrays of building, AMS 14th Joint Conference on the Applications of Air Pollution Meteorology with the A&WMA, Atlanta GA, J1.8.
-
Tominaga, Y., and T. Stathopoulos, (2007), Turbulent Schmidt numbers for CFD analysis with various types of flowfield, Atmos. Environ, 41, p8091-8099.
[https://doi.org/10.1016/j.atmosenv.2007.06.054]

- Versteeg, H. K., and W. Malalasekera, (1995), An Introduction to Computational Fluid Dynamics: The Finite Volume Method, Longman, Malaysia, p257.
- Wang, X., (2006), M.A.Sc. Thesis, Concordia University, Montreal, Quebec, Canada.
-
Wang, X., and K.-F. Mcnamara, (2006), Evaluation of CFD Simulation using RANS Turbulence Models for Building Effects on Pollutant Dispersion, Environ. Fluid Mech, 6, p181-202.
[https://doi.org/10.1007/s10652-005-5656-9]

- Wang, X., T. Stathopoulos, and P. Saathoff, (2006), Numerical evaluation of dispersion of pollutants in the building environment: comparisons with models and experiments, The Fourth International Symposium on Computational Wind Engineering, Yokohama, Japan, p805-808.
-
Yakhot, V., S.-A. Orszag, S. Thangam, T.-B. Gatski, and C.-G. Speziale, (1992), Development of turbulence models for shear flows by a double expansion technique, Phys. Fluids A, 4, p1510-1520.
[https://doi.org/10.1063/1.858424]

-
Yimer, I., I. Campbell, and L.-Y. Jiang, (2002), Estimation of the turbulent Schmidt number from experimental profiles of axial velocity and concentration for High-Reynolds-Number Jet Flows, Can. Aeronautics Space J, 48, p195-200.
[https://doi.org/10.5589/q02-024]

-
Zhang, Y.-Q., S.-P. Arya, and W.-H. Snyder, (1996), A Comparison of Numerical and Physical Modeling of Stable Atmospheric Flow and Dispersion around a Cubical Building, Atmos. Environ, 30, p1327-1345.
[https://doi.org/10.1016/1352-2310(95)00326-6]

