WRF-Chem 모형을 이용한 한반도 대기질 모의: 화학 초기 및 측면 경계 조건의 영향
Abstract
There is an increasing need to improve the air quality over South Korea to protect public health from local and remote anthropogenic pollutant emissions that are in an increasing trend. Here, we evaluate the performance of the WRF-Chem (Weather Research and Forecasting- Chemistry) model in simulating near-surface air quality of major Korean cities, and investigate the impacts of time-varying chemical initial and lateral boundary conditions (IC/BCs) on the air quality simulation using a chemical downscaling technique. The model domain was configured over the East Asian region and anthropogenic MICS-Asia 2010 emissions and biogenic MEGAN-2 emissions were applied with RACM gaseous chemistry and MADE/SORGAM aerosol mechanism. Two simulations were conducted for a 30-days period on April 2010 with chemical IC/BCs from the WRF-Chem default chemical species profiles (‘WRF experiment’) and the MOZART-4 (Model for OZone And Related chemical Tracers version 4) (‘WRF_MOZART experiment’), respectively. The WRF_MOZART experiment has showed a better performance to predict near-surface CO, NO2, SO2, and O3 mixing ratios at 7 major Korean cities than the WRF experiment, showing lower mean bias error (MBE) and higher index of agreement (IOA). The quantitative impacts of the chemical IC/BCs have depended on atmospheric residence time of the pollutants as well as the relative difference of chemical mixing ratios between the WRF and WRF_MOZART experiments at the lateral boundaries. Specifically, the WRF_MOZART experiment has reduced MBE in CO and O3 mixing ratios by 60~80 ppb and 5~10 ppb over South Korea than those in the WRF-Chem default simulation, while it has a marginal impact on NO2 and SO2 mixing ratios. Without using MOZART-4 chemical IC, the WRF simulation has required approximately 6-days chemical spin-up time for the East Asian model domain. Overall, the results indicate that realistic chemical IC/BCs are prerequisite in the WRF-Chem simulation to improve a forecast skill of local air quality over South Korea, even in case the model domain is sufficiently large to represent anthropogenic emissions from China, Japan, and South Korea.
Keywords:
WRF-Chem, MOZART-4, chemical IC/BCs, criteria pollutants, South Korea1. 서 론
대기오염은 인간과 생태계에 직·간접적 영향을 끼치며, 이로 인해 야기되는 피해를 줄이기 위해 지속적인 환경 및 보건 모니터링과 주요 오염물질들의 배출량 규제 등 다각적 노력이 이루어지고 있다. 우리나라는 지리적으로 대규모 인위적 배출원 지역인 중국 대륙의 풍하측에 위치하고 있어, 국내 대기질은 우리나라의 자체 배출량뿐만 아니라 장거리 수송에 의한 영향도 함께 고려하여야 한다. 최근 중국의 급속한 경제성장은 인위적 오염물질의 배출량 증가로 나타나고 있으며(Klimont et al., 2001; Zhang et al., 2007, 2009; Liu et al., 2011; Lee et al., 2014), 국내 대기질에 미치는 장거리 수송에 의한 영향도 이와 함께 증가할 것으로 보여진다. 따라서 정확한 국내 대기질 예측을 위해서는 국내/외 배출량의 시공간적 분포 특성을 이해하고 장거리 수송 및 화학 변환 과정을 보다 정확하게 파악하여야 한다. 대기질 예측을 위해서 복잡한 기상 및 화학 과정들의 시공간 변동을 모의할 수 있는 오일러리안(Eulerian) 대기 화학 모형이 주로 사용되고 있으며(예, Kim, 2011; Kim and Lee, 2011; Hong et al., 2012; Jeon et al., 2014), 국내에서는 주로 대기 화학 모형의 입력 자료로 활용되는 인위적/자연적 배출량 산정에 관한 연구가 다수 수행되었다(예, Cho et al., 2006; Moon and Koo, 2006; Kim et al., 2008a, b, c).
대기 화학 모형은 대기 화학종의 이류, 확산, 배출, 침적, 화학 변환 과정을 포함하는 지배 방정식을 3차원 격자계를 이용하여 수치적으로 계산함으로써 대기 중 농도의 시/공간 변화를 예측한다. 이들 모형을 지역 규모에 적용할 경우에는 화학 배출량뿐만 아니라 모형에서 다루는 화학종의 화학 초기 및 경계 조건을 필요로 한다(Seinfeld and Pandis, 1997; Zannetti, 2003). 지역규모 대기질 예측 모형에서 화학 초기장을 생산하는 방식은 크게 전지구 대기 화학 모형의 예측결과를 이용하는 방식과 통계 자료 혹은 관측으로 얻어진 대기 농도의 연직 분포를 모의 영역에 균일하게 할당하는 방식으로 나누어 볼 수 있으며(예, Song et al., 2008; Lee et al., 2011; Hong et al., 2012), 화학자료동화를 통한 초기화 방식에 관한 연구도 지속적으로 수행되고 있다(예, Elbern et al., 1997; Elbern and Schmidt, 1999, 2001; Elbern et al., 2007; Wu et al., 2015). 화학 측면 경계 조건의 할당 방식도 초기 조건의 생산 방식과 유사하게 전지구 대기 화학 모형의 예측 결과를 모의 영역의 측면 경계에 시/공간 내삽하는 방식과 통계 자료 혹은 관측으로부터 얻어진 정적(static) 연직 분포를 가정하여 계산하는 방식이 주로 사용된다(예, Tang et al., 2007, 2009; Song et al., 2008; Lee et al., 2011; Hong et al., 2012). 전지구 대기 화학 모형의 예측 결과를 지역 규모 대기질 예측을 위한 화학 초기 및 경계 조건으로 활용하는 방식인 화학적 상세화(chemical downscaling) 기법은 고정된 연직 분포를 가정하는 방식에 비해 화학적 시/공간 변동성을 보다 현실적으로 반영할 수 있다는 장점을 가진다(Jonson et al., 2001; Hogrefe et al., 2006; In et al., 2007; Song et al., 2008; Samaali et al., 2009; Borge et al., 2010; Lee et al., 2011).
한반도를 포함한 동아시아 지역의 대기질 모의는 지역규모 대기 화학 모형인CMAQ (Community Multiscale Air Quality) 모형이 주로 사용되어 왔으며(예, Hong et al., 2012; Jeon et al., 2014), Hong et al. (2012)은 전지구 대기 화학 모형 GEOS-Chem (Goddard Earth Observing System-Chemistry)을 이용한 화학적 상세화 기법을 CMAQ 모형에 적용하여 동아시아 지역의 O3농도 모의에 미치는 영향을 조사하였다. 본 연구에서는 최근 지역규모 대기질 모의에 많이 활용되는 WRF-Chem (Weather Research and Forecasting-Chemistry)모형을 이용하여 한반도 대기질 모의 성능을 평가하고, 전지구 대기 화학 모형 MOZART-4 (Model for Ozone and Related chemical Tracers, version 4)의 모의 결과를 이용한 화학적 상세화 기법을 적용하여 화학 초기 및 경계 조건이 한반도 지상 대기질 농도 예측에 미치는 영향을 조사하고자 한다. WRF-Chem 모형은 기상장과 화학장을 동시에 적분하는 온라인(‘online’) 모형으로 미리 계산된 기상장을 입력 자료로 이용하여 수송 및 화학 변환 과정을 계산하는 오프라인(‘offline’) 방식의 CMAQ 모형과는 구별된다. WRF-Chem 모형을 이용한 국내 연구로, Kang et al. (2012)은 비반응성 광물 입자의 배출량 모듈을 적용하여 2007년 겨울철 고농도 황사 사례 모의를 수행하였으며, Moon et al. (2014)은 반응성 화학 과정과 광물 입자 옵션을 함께 적용하여 황사 사례 예측의 민감도 분석을 수행하였다. 이들 연구들은 고농도 황사 사례에 대한 WRF-Chem 모형의 예측 성능을 살펴본 연구로 인위적/자연적 배출원에 기인한 기체상/입자상 화학 과정을 생략하거나 통계적으로 생산된 저해상도의 동아시아 지역 배출량 자료가 활용되었다. 본 연구에서는 WRF-Chem 모형에 상향식 배출량 산정 기법에 의해 생산된 보다 현실적인 인위적 배출량을 적용하여 한반도 기체상 대기질 모의 성능을 평가하고자 하며, 또한 전지구 모형 예측 결과에 기초한 화학 초기 및 경계 조건이 한반도 대기질 예측에 미치는 영향을 살펴보고자 한다.
2. 수치 모형 및 연구 방법
2.1 WRF-Chem 모형 및 실험 설계
본 연구에서 사용한 대기 화학 모형은 WRF-Chem version 3.6으로, 중규모 기상 모형인 WRF 모형에 대기질 모의를 위한 화학 과정을 포함하고 있다(Grell et al., 2005). WRF 모형은 압축(compressible) 대기와 비정역학(nonhydrostatic) 방정식을 포함하는 대기 역학 방정식계를 지상 기압면 기준의 지형 좌표계(terrainfollowing coordinate)를 이용하여 나타내고, 이를 Arakawa-C 격자계를 바탕으로 차분화하며, 대기 복사, 난류 혼합, 구름 물리, 지표-대기 상호 작용, 중력파 항력 등 대기 물리과정들에 대한 다양한 모수화 방안을 포함하고 있다(Skamarock et al., 2008). WRF-Chem 모형은 대기질 예측을 위한 화학 과정인 기체상 및 에어로졸 화학 과정, 건식/습식 침적 과정, 인위적/자연적 배출량 산정 과정, 그리고 기상장에 의한 수송/확산과정을 포함한다. 기상 변수와 화학종 변수를 수치 적분 과정에서 동시에 계산하는 방식(‘online’)을 채택하고 있어, 기상장 모형의 예측 결과를 대기질 모형의 입력 자료로 활용하는 방식(‘offline’) (예, Ginoux et al., 2001; In and Park, 2002; Gong et al., 2003)에 비해 보다 현실적인 기상 및 화학 과정의 모수화와 기상-화학 상호 작용을 연구할 수 있는 기반을 제공해준다. 이런 이유로 최근 다양한 시/공간 규모의 기상/기후 및 대기질 연구에서 활용도를 높여가고 있다(예, Fast et al., 2009; Tuccella et al., 2012; Meij et al., 2015).
한반도 대기질 수치모의를 위한 모형의 모의 영역은 한반도를 포함한 동아시아 지역(5700 × 4050 km2)으로 설정하여(Fig. 1), 종관 규모 이하의 기상 현상이 모형에 의해 명시적으로 모의될 수 있도록 하였으며, 한반도 대기질에 직접적인 영향을 미치는 근접한 중국과 일본 지역의 인위적 배출원이 모의 영역 내에 잘 포함될 수 있도록 하였다. 모의 영역의 남쪽과 동쪽 경계는 해양에 걸쳐 있고, 서쪽과 북쪽 경계는 중국과 러시아를 포함한 아시아 대륙에 위치하고 있으며, 동아시아 지역의 주요 인위적 오염물질 배출원 지역은 모의 영역의 중앙 지역에 위치한다(Fig. 1b). 화학적 상세화 기법은 전지구 대기 화학 모형에 의해 모의된 화학장에 포함된 오차가 지역규모 대기질 모형의 예측 결과에 직접 전파될 수 있는 단점을 가지므로(Lee et al., 2011), 모의 영역을 관심 영역보다 넓게 설정하는 방법(Seinfeld and Pandis, 1997)을 적용하여 시/공간적으로 저해상도를 가지는 전지구 대기화학 모형의 예측 결과가 한반도 대기질 모의에 직접적으로 미칠 수 있는 영향을 최소화하였다.
모형의 수평 격자 해상도는 30 km로 설정하였으며, 연직 격자는 모형의 최하층높이(약 15 m)에서 최상부 50 hPa (~20 km)까지 43개 연직층으로 구성하였으며, 대기경계층 내에 18층의 연직 격자를 포함하여 하층대기의 공간해상도를 높게 설정하였다. 전지구 재분석 기상장인 NCEP-FNL (National Center for Environment Prediction-Final Operational Global Analysis)(공간해상도 1o × 1o; 시간 해상도 6 hr) 자료를 이용하여 기상 변수의 초기 및 경계 조건을 할당하였으며, 적분수행 기간(30일) 동안 매 24시간마다 FNL 자료를 이용하여 기상장의 초기 및 경계 조건을 갱신하였다. 또한 적분 수행 기간 동안 자유 대기층의 온도, 습도, 바람 성분에 대해 FNL 자료를 이용한 4DDA (4 Dimensional Data Assimilation) 분석 너징(analysis nudging)기법을 적용하였다. 기상장 수치 적분을 위해 격자규모 구름 물리과정은 WSM3 (Hong et al., 2004), 적운 모수화 과정은 Grell-Freitas 방안(Grell and Freitas, 2013), 단파와 장파 복사 전달 과정은 각각 Dudhia 방안(Dudhia, 1989)과 RRTMG (Iacono et al., 2008), 대기 경계층 난류 혼합 과정은 YSU (Hong et al., 2006), 지표-대기 상호 작용 과정은 Noah LSM (Chen and Dudhia, 2001)을 사용하였다(Table 1).
기체상 및 에어로졸 화학 변환 과정은 RACM (Regional Atmospheric Chemistry Mechanism) (Stockwell et al., 1997)과 MADE/SORGAM (Modal Aerosol Dynamics model for Europe/Secondary organic aerosol model) (Ackermann et al., 1998; Schell et al., 2001)을 이용하였다. 본 연구에 사용한 RACM 화학 모듈은 73 화학 종과 237 화학 반응식을 포함하고 있으며, KPP (Kinetic PreProcessor) (Damian et al., 2002; Sandu et al., 2003)를 통해 WRF-Chem에 적용되었다. 광화학 반응 계수(photolysis rate)는 TUV (Tropospheric Ultraviolet-Visible method) (Madronich, 1987) 방안을 이용하였으며, 이 방안은 복사전달 방정식의 계산 과정에서 모의된 오존, 수상(hydrometeors), 에어로졸을 고려하는 특징을 가진다. 본 연구에서 사용된 화학과정 옵션의 구성은 다양한 지역에서 기체상 및 에어로졸 화학 과정 및 대기질 예측 연구를 통해 모의 성능이 평가되고 있다(예, Kim, 2011; Lee et al., 2011). 인위적 배출량은 아시아 대기질 모형의 비교/검증 연구를 위해 개발된 MICS-Asia 2010 (Model Inter-Comparison Study for Asia 2010) (Carmichael et al., 2002) 배출목록을 이용하였으며, SMOKE (Sparse Matrix Operator Kernel for Emissions; Coats, 1996; Benjey et al., 2001) 모듈을 통해 SAPRC-99 (Statewide Air Pollution Research Center, Version 99)메커니즘(Carter, 2000) 화학종에 따라 산출하였다. 인위적 VOCs (Volatile Organic Compounds) 배출량은 Table 2에 따라 RACM 매커니즘에 맞게 재할당 후 모의에 사용하였다. 한편, 자연적 배출량은 MEGAN-2 (Model of Emissions of Gases and Aerosols from Nature version 2) 모듈을 이용하였으며, 적분 수행 과정에서 계산되는 기상장을 이용하여 ‘온라인’ 방식으로 자연 배출량이 산출된다(Guenther et al., 2006).
WRF-Chem 모형의 한반도 대기질 모의 성능을 조사하기 위해 2010년 4월 1일부터 4월 30일까지 30일간에 대해 모형의 적분을 수행하였다(‘WRF 실험’). 또한, 화학 초기 및 경계 조건이 한반도 대기질 모의에 미치는 영향을 조사하기 위해 전지구 대기 화학 모형인 MOZART-4의 모의 결과를 모의 영역의 초기 및 경계 조건으로 사용한 실험(‘WRF_MOZART’ 실험)을 독립적으로 수행 후 그 결과를 비교 분석하였다. 보다 정확한 기상장 적분을 위해 24시간 갱신 주기를 적용한 것과는 달리 화학장은 두 실험 모두 모의 기간 동안 연속적으로 적분을 수행하였다.
2.2 MOZART-4 모형 및 화학 초기/측면 경계 조건
MOZART-4 모형은 전지구 대기 화학 모형으로(Horowitz et al., 2003), 본 연구에서 사용된 모형의 수평 해상도는 2.8o × 2.8o이며 연직 격자는 지상에서 약 2 hPa까지 28개 연직층으로 구성되어 있다. 화학 메커니즘은 85종의 기체상 물질과 12종의 에어로졸 화합물로 구성된 196개의 화학 반응식(39개의 광화학 반응식과 157개의 기체상 반응식)을 포함하고 있다(Emmons et al., 2010). 동아시아 지역에 대한 6시간 간격의 MOZART-4 모형의 예측 결과를 화학 초기 및 경계 조건으로 사용하였으며(http://www.acd.ucar.edu/wrf-chem/mozart.shtml), 이를 위해 저해상도의 MOZART-4 모형 예측 결과를 WRF-Chem 모형의 수평 및 연직 격자 해상도에 맞게 내삽하는 과정과 서로 다른 두 화학 메커니즘 사이의 화학종 변환(Table 3)을 수행하였다.
Figure 2는 MOZART-4 모형에서 얻어진 모의 영역의 네 측면 경계에서 CO, NO2, SO2, O3의 2010년 4월 평균 연직 단면도를 보여주고 있다. 일차 오염물질인 CO, NO2, SO2의 경우, 모의 영역의 남서 경계지역(100oE-110oE; 10oN-30oN)의 하부 대기층에서 상대적으로 높은 농도가 나타나며, 북쪽 경계에서도 다소 높은 농도를 보인다. 이들 고농도 지역은 주로 모의 영역 외부에 위치한 아시아 국가(베트남, 태국, 인도 등)의 인위적 배출원에 의한 영향으로(Kurokawa et al., 2013), CO의 경우 남서 경계 지역에서 약 500 ppb의 높은 농도를 보인다. 반면, O3는 해양을 가로지르는 동쪽과 남쪽 경계의 하부 대기에서 50 ppb 이상의 높은 농도를 나타내며, 서쪽과 북쪽 경계의 상층(약 10 km 내외) 대기에서도 400 ppb 이상의 높은 값을 보인다.
Figure 3는 WRF-Chem 모형과 MOZART-4에서 얻어진 측면 경계 지역의 CO, NO2, SO2, O3의 연직 농도 분포를 보여준다. WRF-Chem 모형에 기본으로 내재되어 있는 이들 오염물질의 연직 농도 분포는 북반구 중위도 청정 지역을 대표하는 값으로 수평 및 시간에 따른 변화가 없는 연직 농도 분포를 가진다(Liu et al., 1996; McKeen et al., 2002; Lee et al., 2011). CO 농도는 지표에서부터 14 km까지 80 ppb의 균일한 값으로, 그 이상의 고도에서는 지수적으로 감소하여 약 20 km의 고도에서 70 ppb의 값을 갖는다(Fig. 3a). NO2와 SO2의 농도는 0.1 ppb 이하의 낮은 값으로 연직 방향으로 거의 균일하게 분포하며(Figs. 3e와 3i), O3의 농도는 지표에서 약 500 m 고도까지 30 ppb, 이후 점차적으로 증가하여 12 km 고도에서 60 ppb, 그 이상의 고도에서 15 km 까지는 지수적으로 증가하여 약 170 ppb의 농도를 가지며 약 20 km까지는 동일한 농도로 설정되어 있다(Fig. 3m). WRF-Chem 모형은 주어진 연직 농도 분포를 모의 영역에 균질하게 적용하여 화학 초기 조건을 생성하고, 화학 측면 경계에서의 농도는 이들 내재된 화학종의 연직 농도 분포와 수치적 경계 조건인 고정 유입 조건(constant inflow condition)/무경도 유출 조건(zero-gradient outflow condition)을 적용하여 계산한다(Skamarock et al., 2008).

Conversion table of anthropogenic volatile organic compounds (VOCs) emissions between RACM and SPARC99 mechanisms. The emission species and their description of RACM and SPARC99 mechanisms can be referred in Stockwell et al. (1997) and Carter (2000), respectively.

Chemical species mapping table between RACM and MOZART-4 used for chemical initial and lateral boundary conditions. Chemical species of MOZART-4 can be referred in Emmons et al. (2010). The mapping table is obtained from the MOZBC utility package (http://www.acd.ucar.edu/wrf-chem/mozart.shtml).
Figures 2와 3은 본 연구에서 설정한 모의 영역의 측면 경계에서 MOZART-4 모형의 예측 결과로부터 얻어진 농도의 연직 분포는 WRF-Chem 모형에 내재된 분포와는 큰 차이가 있음을 보여주고 있다. 특히 CO의 시/공간 평균 농도는 80 ppb로 일정하게 설정된 모형의 내재된 연직 분포와 달리 연직 방향의 농도 변화가 70~350 ppb로 크게 나타난다. 각 측면 경계에서의 농도의 연직 분포간에도 큰 차이가 나타나며, 서쪽과 남쪽 경계의 하부 대기 경계층 지역으로 높은 농도값과 시/공간 변동성을 보인다(Figs. 3a-d). O3 농도의 경우에도 MOZART-4에 의한 화학 경계조건이 모든 측면 경계에서 WRF-Chem에 설정된 기준값보다 높게 나타나며, 하부 및 상부 대기에서 각각 수십 ppb와 수백 ppb의 차이를 보인다(Figs. 3m-p). 한편, NO2와 SO2는 두 실험의 모든 측면 경계에서 수 ppb 이내의 낮은 농도 분포를 보인다(Figs. 3e와 3i).
3. 결 과
3.1 기상장 모의 검증
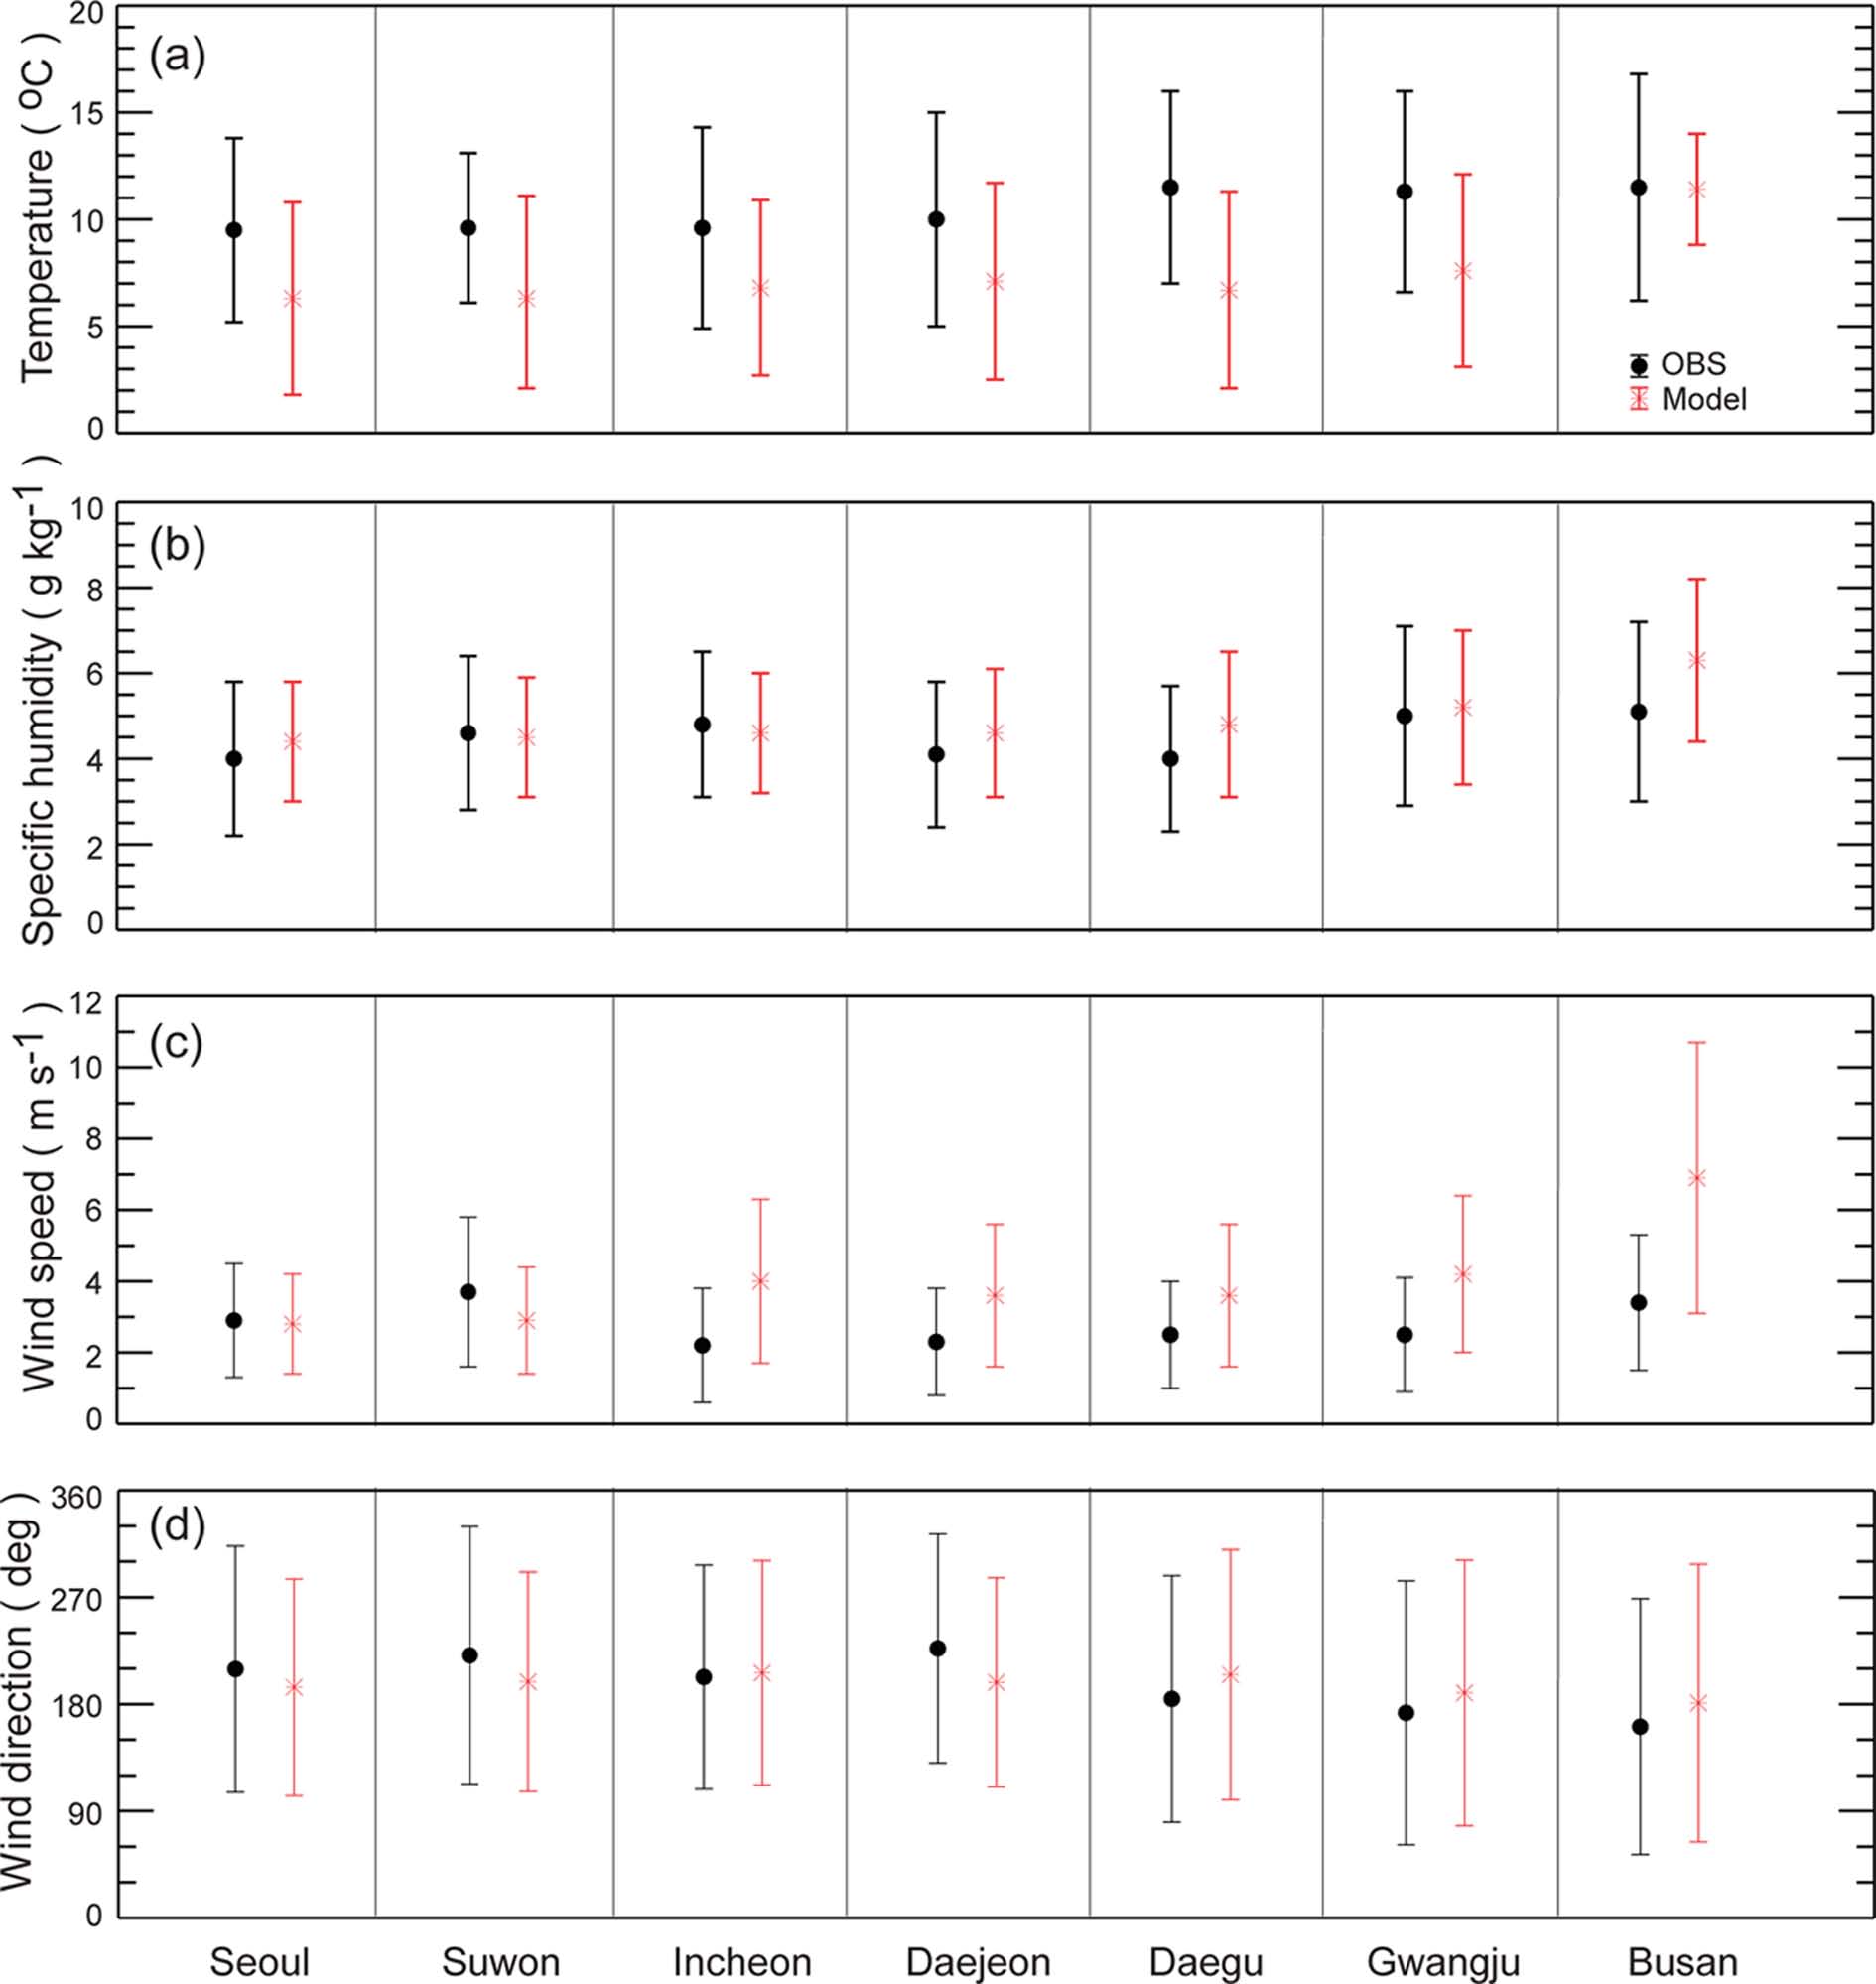
모의된 기상장 분석은 한반도 내 주요 도시 지역(서울, 수원, 인천, 대전, 대구, 광주, 부산)을 대상으로 비교 검증을 수행하였으며, 지상 기상장은 각 도시별 기상청 정규 관측소에서 매 시간 간격으로 측정된 기온, 비습, 풍향 및 풍속 자료를 이용하였다. 또한 상층 기상장의 모의 검증을 위해 12시간 간격의 기상청 고층 관측 지점인 백령도와 오산의 연직 기상 관측 자료를 이용하였다. Figure 4는 2010년 4월 서울 지역의 모의된 기상장과 지상 관측의 시계열을 보여주고 있다. WRF 모형은 관측 기상장에 나타나는 수 일의 종관 규모 변화는 대체로 잘 모의하고 있으나, 기상 요소들의 일 변화 경향의 모의 성능은 변수 별로 다소 차이를 보인다. 특히, 모형이 서울 지역의 야간 기온을 과소 모의하는 경향이 뚜렷하며, 비습과 바람의 경우 일 변동성을 다소 작게 모의하고 있다. 주요 도시 지역에 대한 모형의 기상장 예측 성능을 비교해 보면(Fig. 5), 기온은 부산을 제외한 주요 도시지역들에서 평균 약 3~5oC의 과소 모의하는 경향을 보이며, 비습은 지역에 따라 다소 차이가 있으나 대체로 관측을 잘 모의하고 있다. 풍속의 경우, 모형이 서울과 수원 지역을 제외한 다른 지역에서 다소 과대 모의하는 경향을 보이고 있다. 주요 도시 지역에서 나타나는 모형과 관측의 차이는 모형의 낮은 격자 해상도(30 km)와 도시 지역 물리과정의 명시적 모수화의 부재에 기인하는 것으로 판단된다. 전반적으로, IOA 지수로 나타낸 모형의 지상 기상장 모의 성능은 기온의 경우 0.74(대구)에서 0.88(대전), 비습의 경우 0.87(부산)에서 0.94(광주), 풍향의 경우 0.62(광주)에서 0.78(서울, 수원, 인천, 부산), 풍속은 0.52(부산)에서 0.79(서울)로, 지면 피복 등 국지 강제력의 차이에 기인한 오차에도 불구하고 비교적 잘 모의함을 보여주고 있다(Table 4).
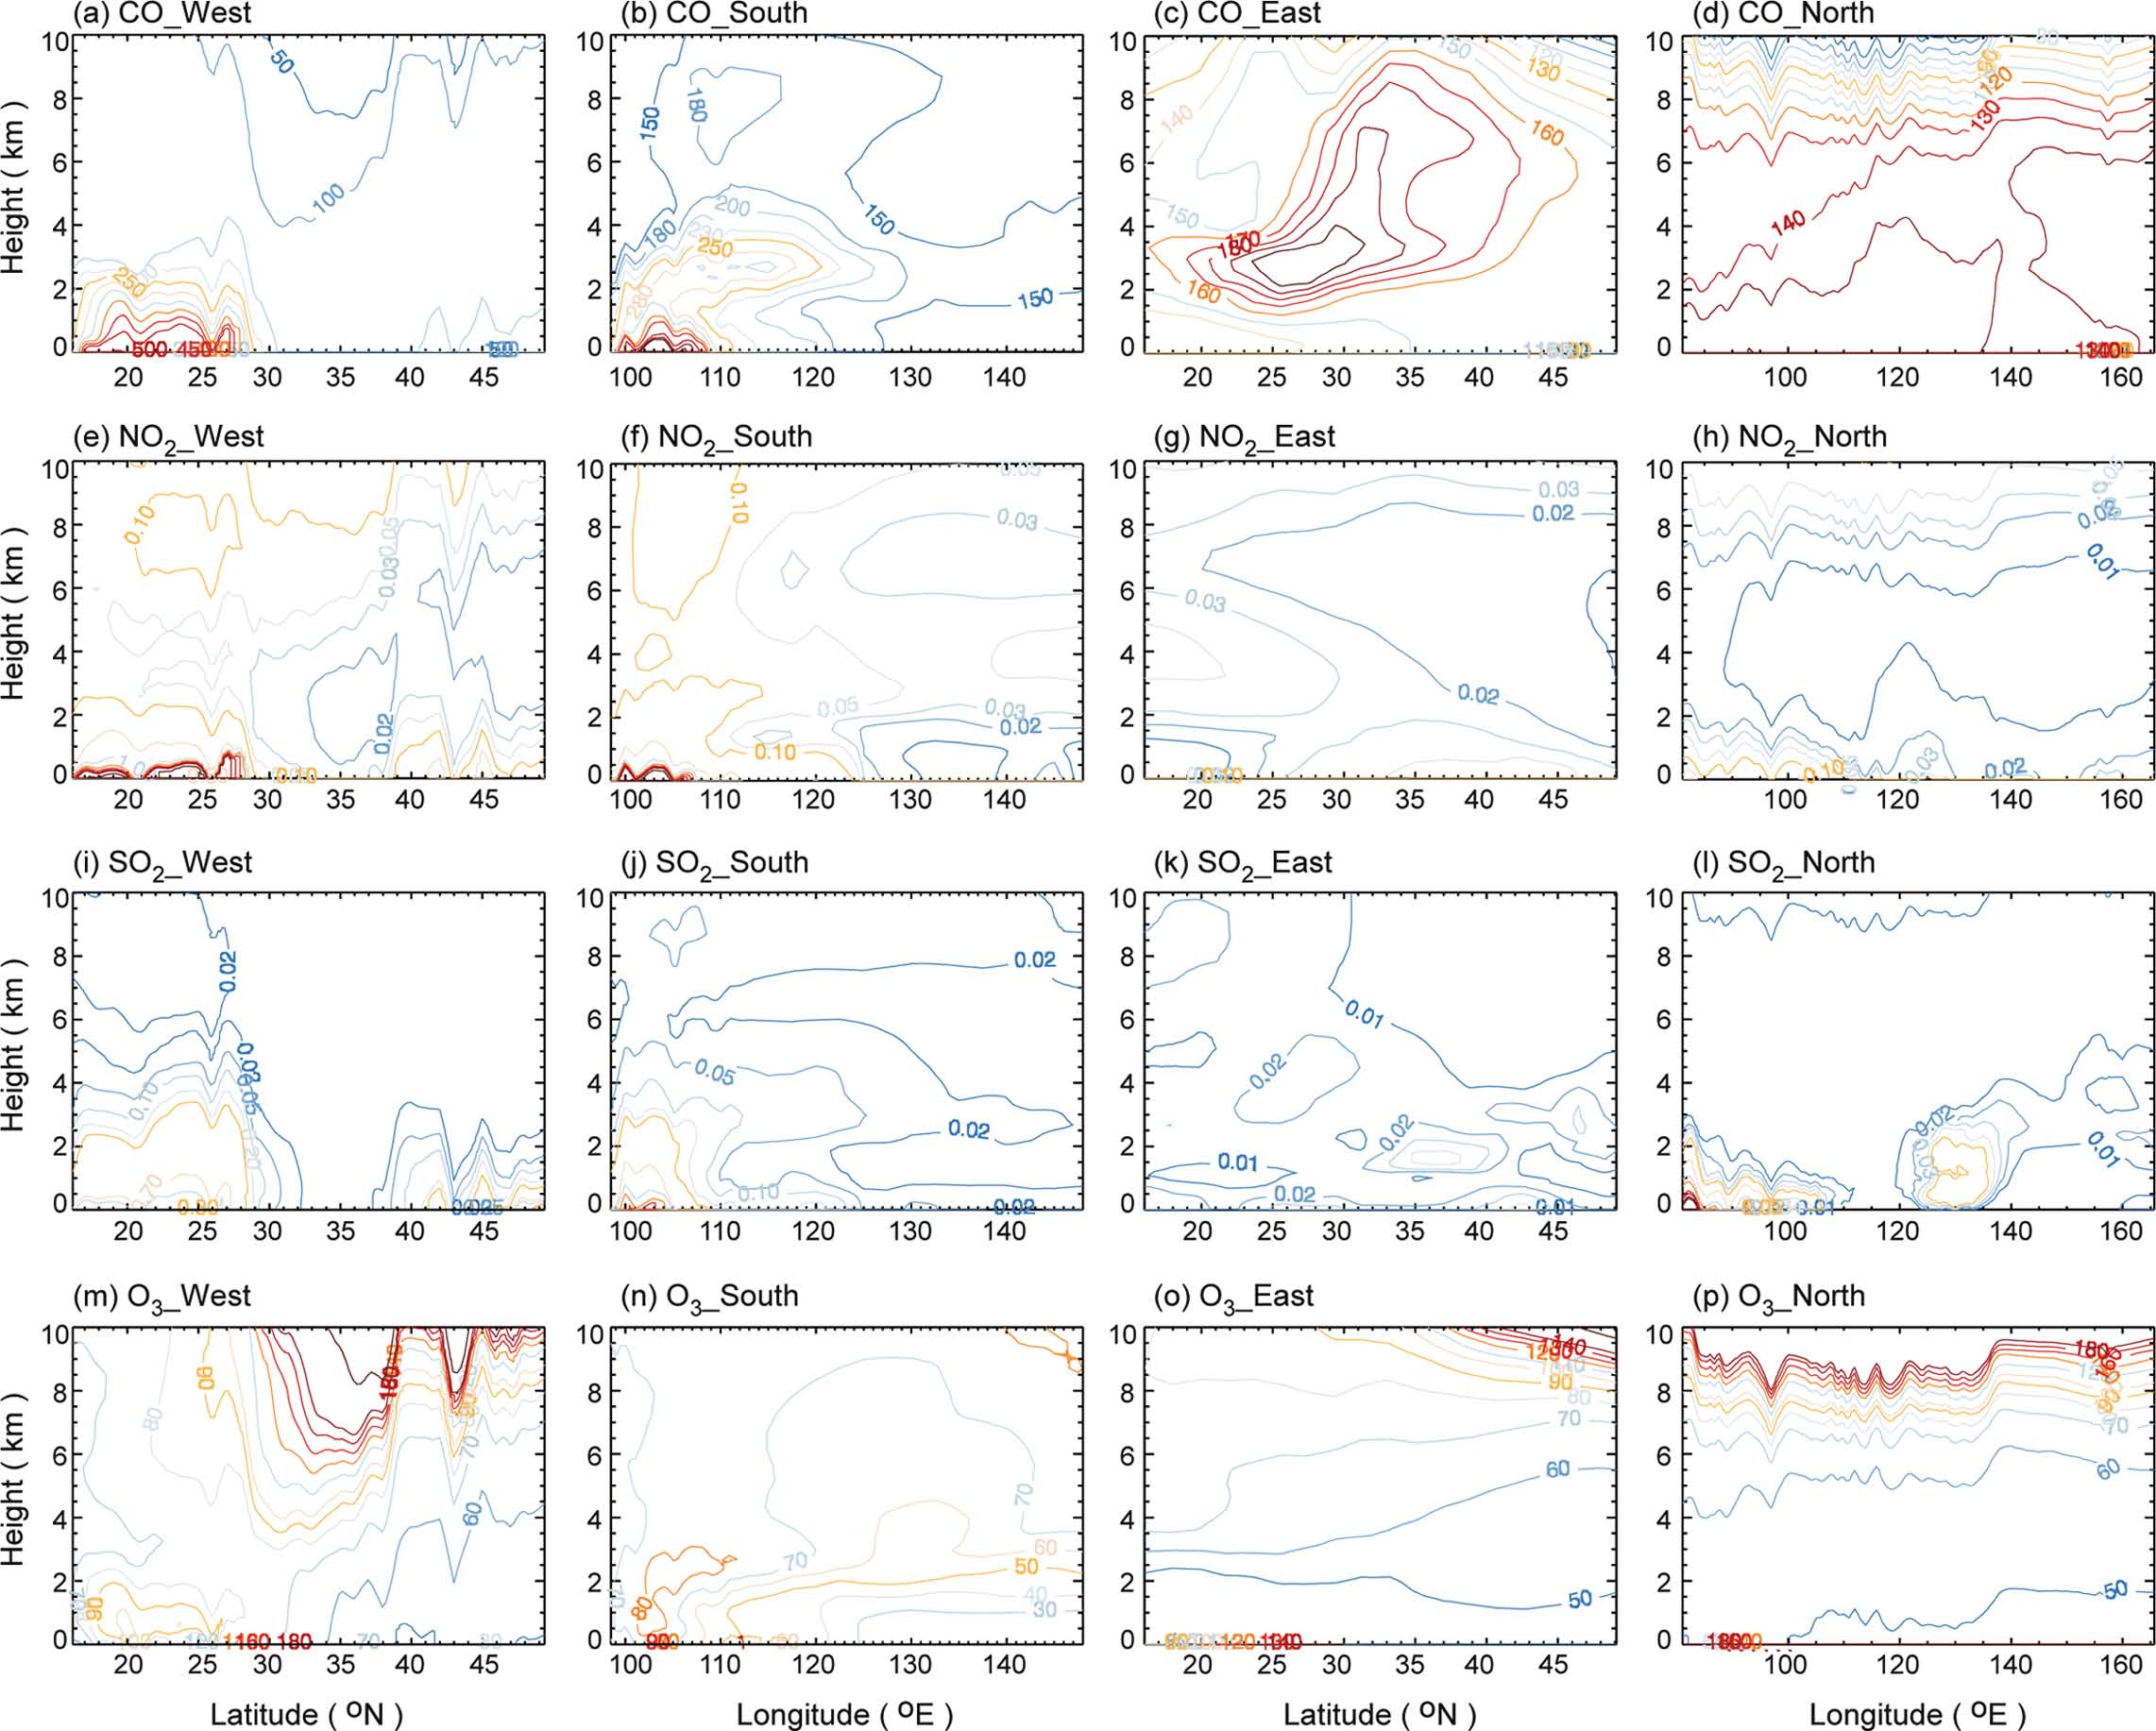
Vertical sections of CO, NO2, SO2, and O3 mixing ratios at four lateral boundaries of the WRF-Chem domain. The chemical mixing ratios obtained from the MOZART4 were averaged for 30 days in April 2010.
Figure 6은 2010년 4월의 분석 기간 동안 백령도와 오산 지역에서 측정된 상층 기상장과 모의 결과를 비교하고 있다. WRF 모형은 백령도와 오산 지역에서 관측된 온위와 비습의 대기 연직 구조를 잘 모의하고 있다. 그리고, 하층(1000 hPa) 풍속이 다소 과대 모의되고 있으나 전반적으로 모형이 관측된 풍향과 풍속의 연직 분포를 잘 따르고 있어, 장시간 대기 오염물질의 수치 적분 과정에서 수송과 화학 변환 과정이 현실적으로 모의되었음을 추정할 수 있다. 또한 대체로 높은 기상장 수치 모의 성능은 FNL 재분석 자료를 이용한 일 단위 기상장 초기 및 경계 조건의 갱신에 기인하는 것으로 판단된다.
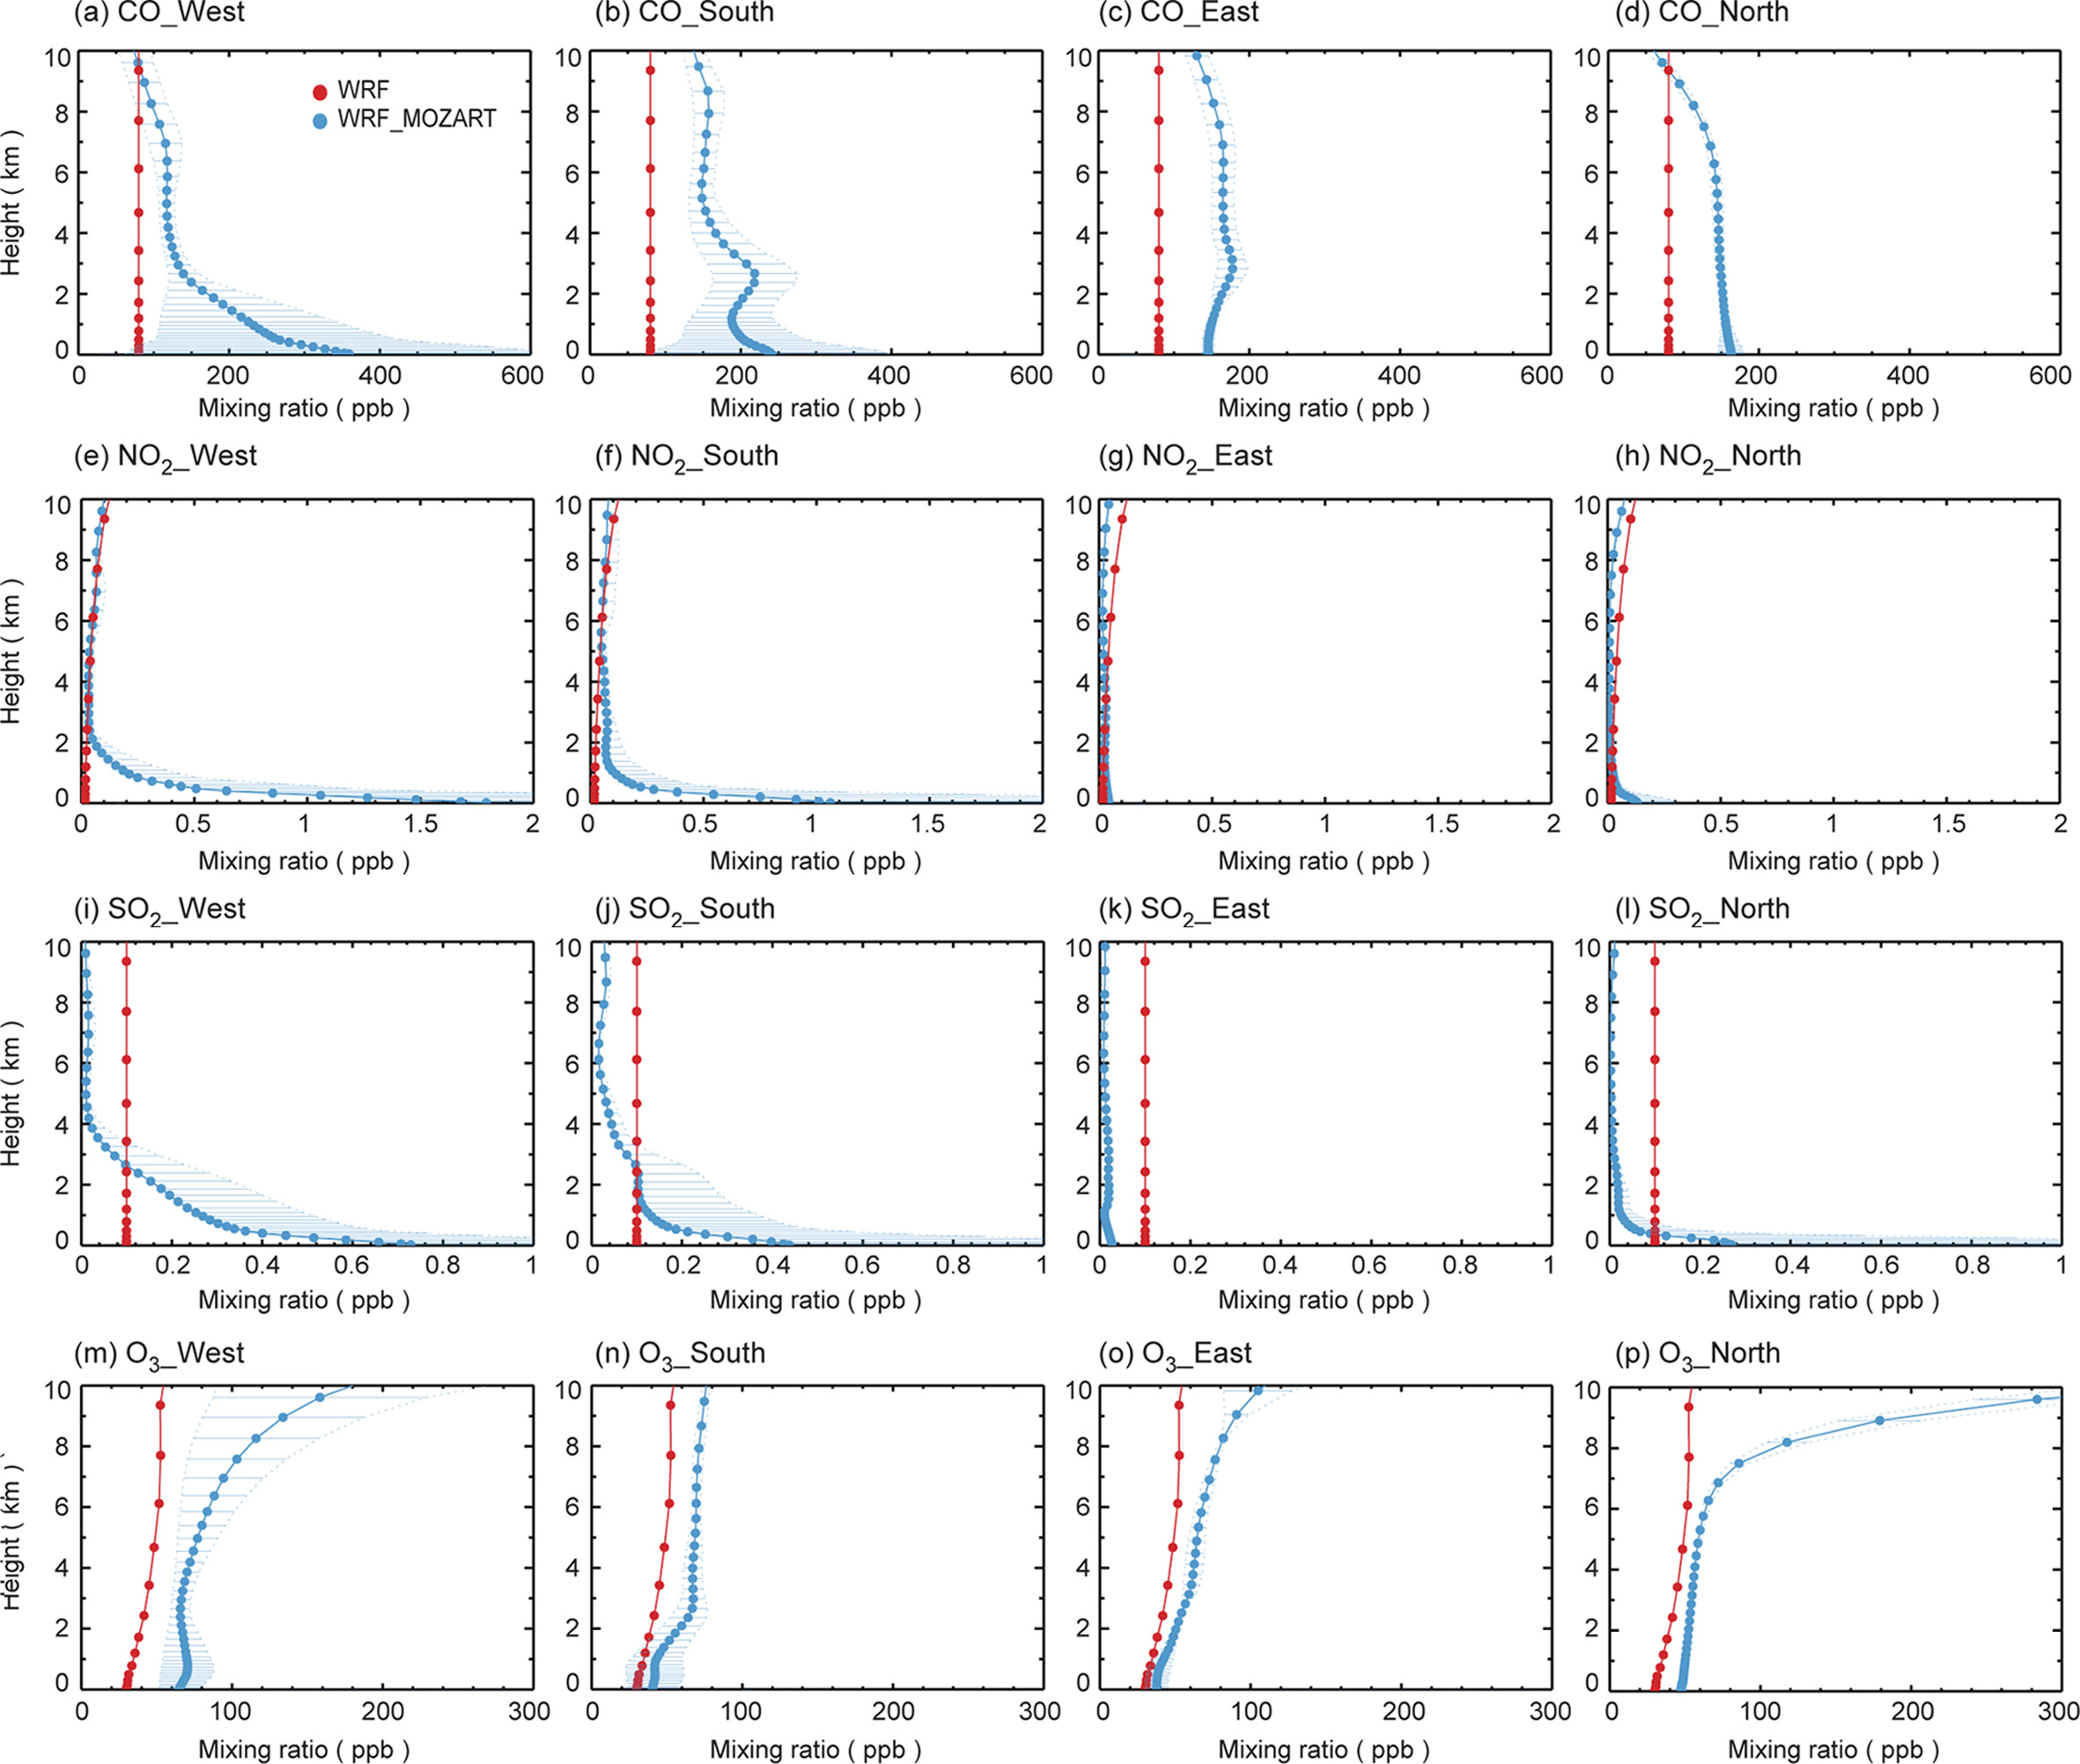
Vertical profiles of spatio-temporally averaged CO, NO2, SO2, and O3 mixing ratios of MOZART4 at four lateral boundaries of the WRF-Chem domain along with the default chemical profiles in the WRF-Chem model. The horizontal bars denote spatial standard deviation values of the MOZART4-simulated chemical mixing ratios at vertical levels.

Comparison of observed and simulated near-surface meteorology at the Seoul meteorological monitoring site during 30 days in April 2010.
3.2 대기질 모의 검증 및 화학 초기/경계 조건의 영향
한반도 내 주요 도시들을 대상으로 WRF-Chem으로 모의된 기준성 기체상 오염물질(CO, NO2, SO2, O3)의 모의 성능과 화학 초기 및 경계 조건의 영향을 분석하였다. 환경부의 도시대기 측정망에서 얻어진 이들 오염물질의 지상 농도 자료를 각 도시에 포함된 측정소의 공간 평균값을 계산한 후 이를 모형의 예측 결과와 비교하였다. 각 도시별 평균값 계산에 사용된 측정소의 수는 서울 25개소, 수원 6개소, 인천 15개소, 대전 7개소, 대구 11개소, 부산 17개소이다. Figure 7은 서울에서 측정된 주요 오염물질의 지상 농도의 시계열과 수치 실험에서 얻어진 모의 결과를 보여주고 있다. 모형의 기상장 모의 성능에 비해 오염물질의 예측 성능은 각 물질별로 큰 차이를 보인다. 먼저, 측정된 지상 CO 농도는 300~1100 ppb의 넓은 변동성과 뚜렷한 일변화 경향을 보여주고 있으며, WRF 기준 실험과 WRF_MOZART 실험 모두 뚜렷한 일변화 경향은 어느 정도 모의하나 농도 값을 대체로 과소 모의하고 있으며, 특히 약 600 ppb 이상의 고농도가 측정된 날들에서 모형과 관측의 차가 더욱 뚜렷하게 나타난다(Fig. 7a). 측정된 NO2는 분석 기간 중 10~80 ppb의 농도 범위에서 큰 일변화 경향을 보였으며, WRF-Chem 모형이 60 ppb 이상의 높은 농도가 측정된 날들(4월 8~10일)에는 다소 과소 모의하였으나 측정 일변화 경향을 대체로 잘 모의하였다(Fig. 7b). SO2측정 농도는 분석 기간 동안 약 3~12 ppb의 값을 보여주고 있으며 일변화 경향은 뚜렷하지 않은 반면, 모형은 측정 농도를 2~4배 과대 모의하고 있으며 측정값에 비해 보다 뚜렷한 일 변화 경향을 나타내고 있다(Fig. 7c). 서울지역에서 측정된 O3는 야간에 수 ppb의 낮은 농도를 나타내며, 주간에는 광화학 반응에 의한 오존 생성 조건에 따라 20~70 ppb의 농도 변화를 보였다. WRF-Chem 모형에 의해 모의된 O3의 농도는 뚜렷한 일변화 경향을 보이고 있으나, 주간의 최대 농도는 지속적으로 과소 모의하며 야간에는 측정값과 달리 오존이 완전히 소진되는 모의 특성을 보여주고 있다(Fig. 7d).

Statistical evaluation results of simulated near-surface temperature, specific humidity, and winds for 7 major Korean cities during 30 days in April 2010 (MBE: mean bias error, RMSE: root mean square error, R: Pearson correlation coefficient, IOA: index of agreement).
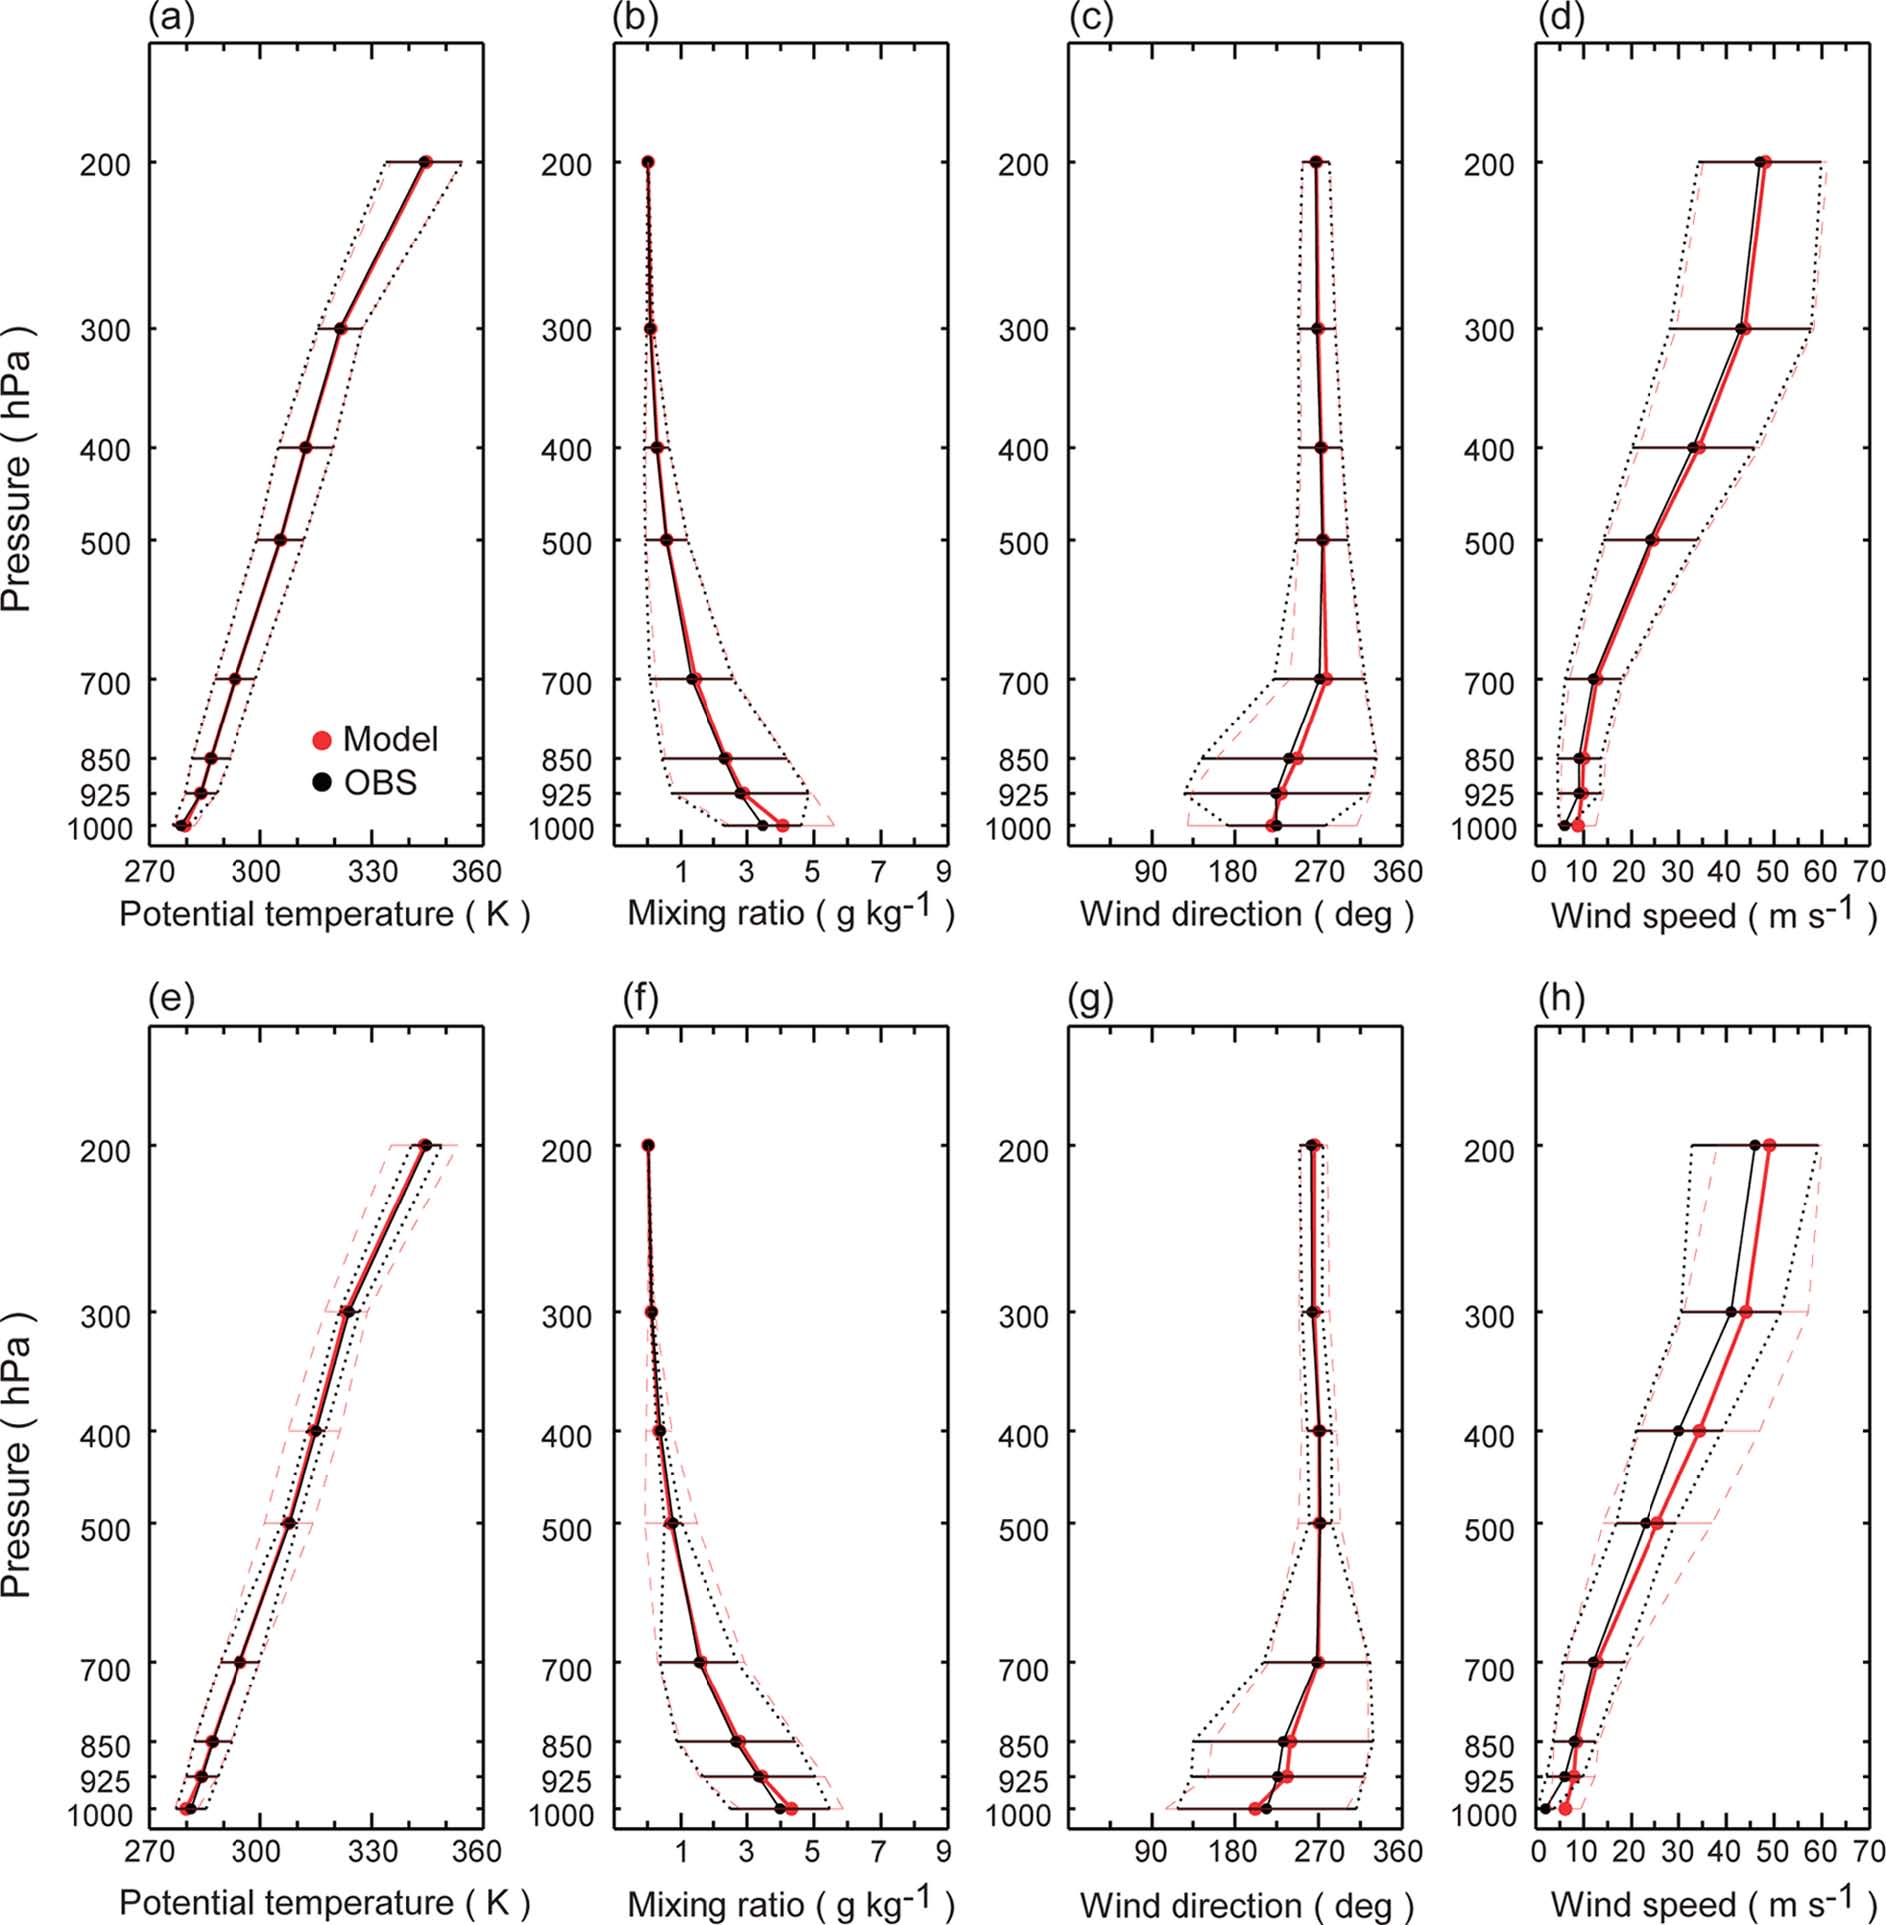
Comparison of vertical profiles of observed and simulated meteorology at Baengnyeongdo (a-d) and Osan (e-h) radiosonde sites. The mean and standard deviation values for the 30-days in April 2010 period were calculated and compared.
Figure 7에서 WRF와 WRF_MOZART 실험에 의해 모의된 주요 오염물질의 농도는 적분 시작 약 6일을 전후로 두 실험간 모의 농도의 차가 크게 달라짐을 보여준다. 이는 설정된 모의 영역에 대해 WRF 기준실험의 화학 스핀업 시간으로 약 6일이 필요함을 의미하며, 이후 시간의 두 실험간 농도 차는 MOZART-4 화학 경계 조건의 영향으로 구분하여 볼 수 있다. 따라서, 적분 시간 6일 이전의 두 모의 실험간의 차이는 화학 초기 조건에 의한 영향으로 나타나며, 화학 스핀업 시간 이후 두 모의 실험의 예측 결과에서 나타나는 차이는 화학 경계 조건과 배경 농도 변화에 의한 화학 반응에 기인한 차이로 해석할 수 있다. Figure 8은 MOZART-4 화학 초기 조건과 경계 조건의 영향을 정량적으로 분석하기 위해 초기 3일간(4월 1~3일) 기간과 4월 8~30일까지(23일간) 기간으로 구분하여, 두 실험에서 모의된 주요 오염물질의 농도를 각 도시별로 비교하였다. 적분 시작 초기 6일 이내의 기간 동안, MOZART-4 모형의 예측 결과를 이용한 보다 현실적인 화학 초기 조건을 이용할 경우에 WRF 기준 연직 농도 분포를 이용한 화학 초기화에 비해 보다 정확한 대기질 수치 모의가 가능함을 보여준다. 다만, SO2의 경우에는 MOZART-4 초기값을 이용할 경우 서울, 수원, 인천, 부산에서는 측정된 농도를 과대 모의하는 것으로 나타난다. 화학 스핀업이 충분이 이루어지고 난 이후에는 두 실험간의 모의 농도 차이는 모든 분석 오염물질에서 감소하며, MOZART-4 화학 경계 조건의 사용으로 주요 도시 지역들의 CO, NO2, SO2, O3의 농도는 평균 71 ppb (34%), 1.2 ppb (5%), 0.2 ppb (4%), 3 ppb (13%) 증가하는 것으로 나타난다. 이러한 WRF_MOZART 실험에서의 배경 농도의 증가는 WRF 실험에서 과소 모의를 보인 물질들의 평균 편차를 감소시키며, SO2를 제외한 주요 오염물질들의 전반적인 예측 정확도가 다소 향상되었다(Table 5). 특히, WRF 실험은 모든 도시에서 CO 농도를 측정값을 과소 모의(177~336 ppb)하고 있어, MOZART-4 화학 경계 조건의 사용으로 평균 편차가 크게 감소되었으나 여전히 모형이 크게 과소 모의하는 경향을 보였다. NO2는 서울, 인천, 대전, 부산 지역에서 모형에 의해 평균 농도와 시간 변동폭이 대체로 잘 모의되고 있으며, 수원, 대구, 광주 지역에서는 다소 과소 모의되었다. SO2 농도의 경우, 서울, 수원, 인천, 부산지역에서 측정값을 과대 모의하는 양상이 뚜렷하며, 화학 경계 조건의 영향은 다른 물질에 비해 낮은(0.5 ppb 이내) 특성을 보인다. MOZART-4 화학 경계 조건의 사용으로 모든 도시에서 O3 농도의 모의 편차가 감소하여 향상된 예측 성능을 보여주었으나, 수도권 지역에서의 모형의 과소 모의(5~16 ppb)가 뚜렷하고 화학 경계 조건의 영향도 낮게(0.1~1.8 ppb) 나타났으며 부산(4.7 ppb)과 광주(6.4 ppb)로 주로 남부 지역의 도시들에서 높은 평균 농도의 증가를 보였다.
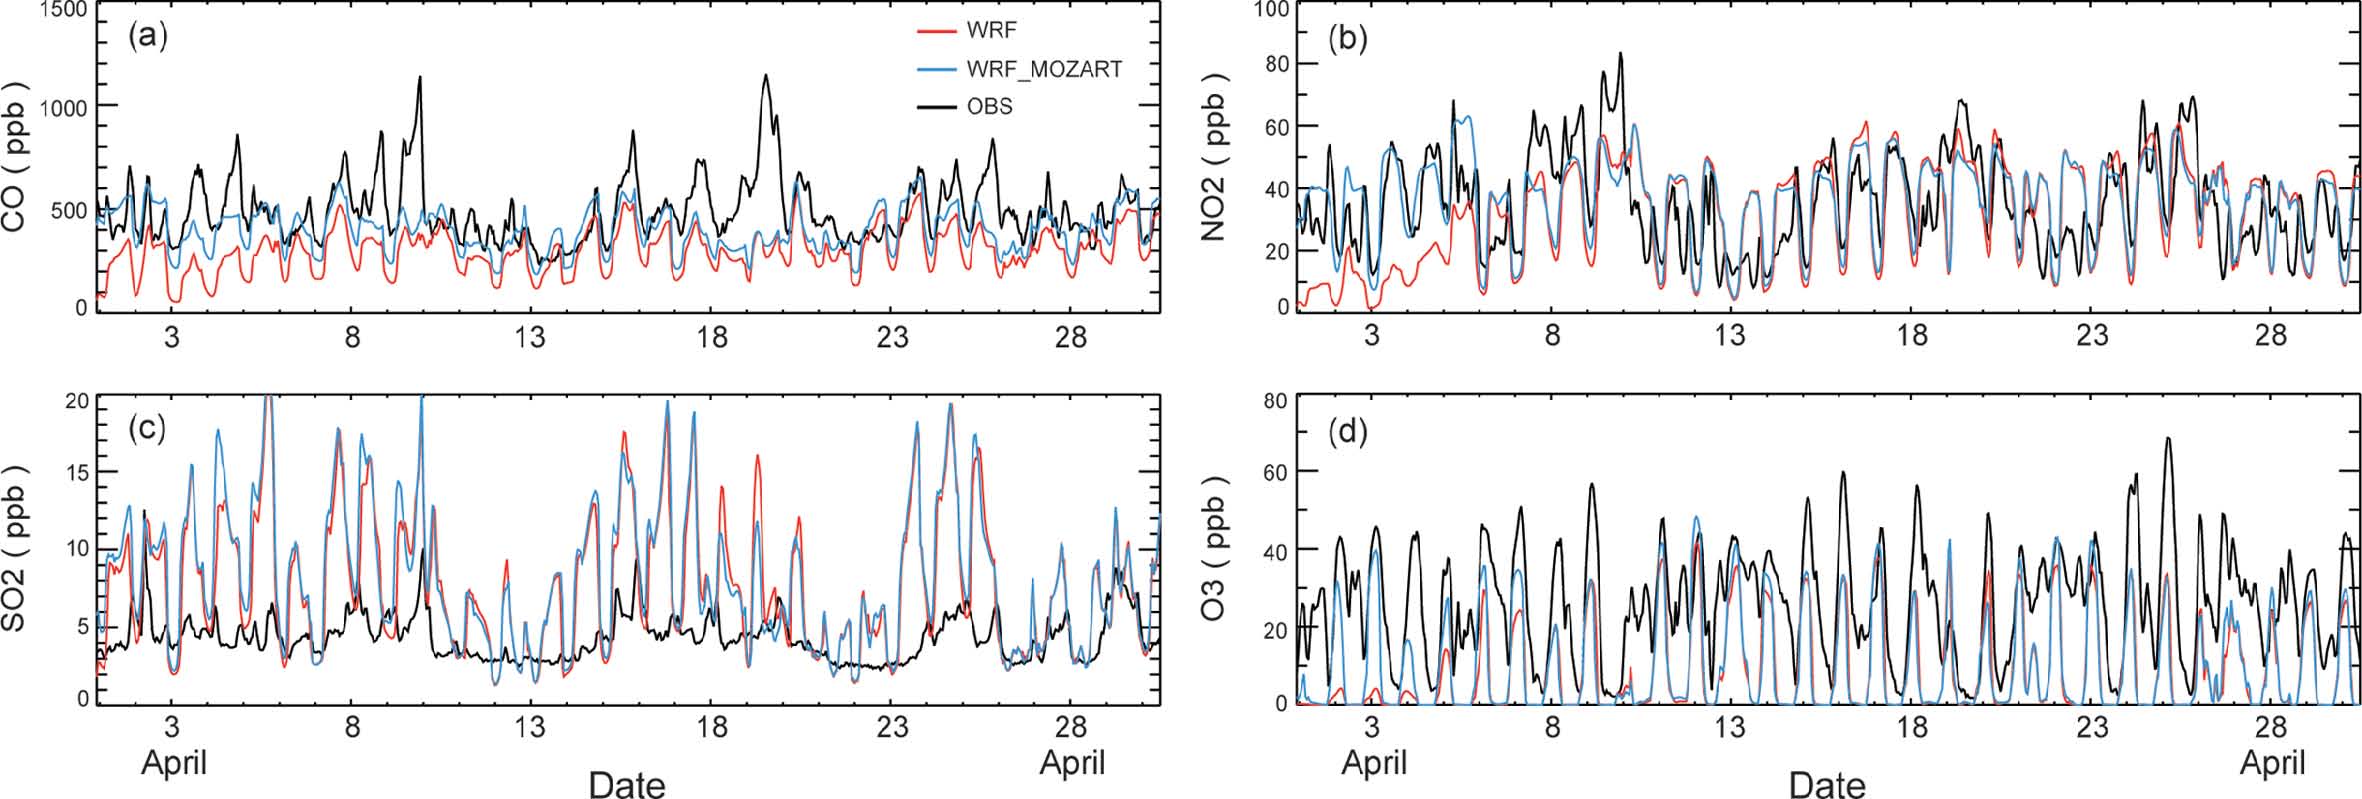
Temporal variations of observed and simulated near-surface chemical mixing ratios of (a) CO, (b) NO2, (c) SO2, and (d) O3 at Seoul during April 2010. The observed values at 25 station urban air-quality monitoring sites were averaged for comparison to model simulation. WRF and WRF_MOZART indicate the simulation results with WRF-Chem default chemical IC/BCs profiles and MOZART4 IC/BCs profiles, respectively.
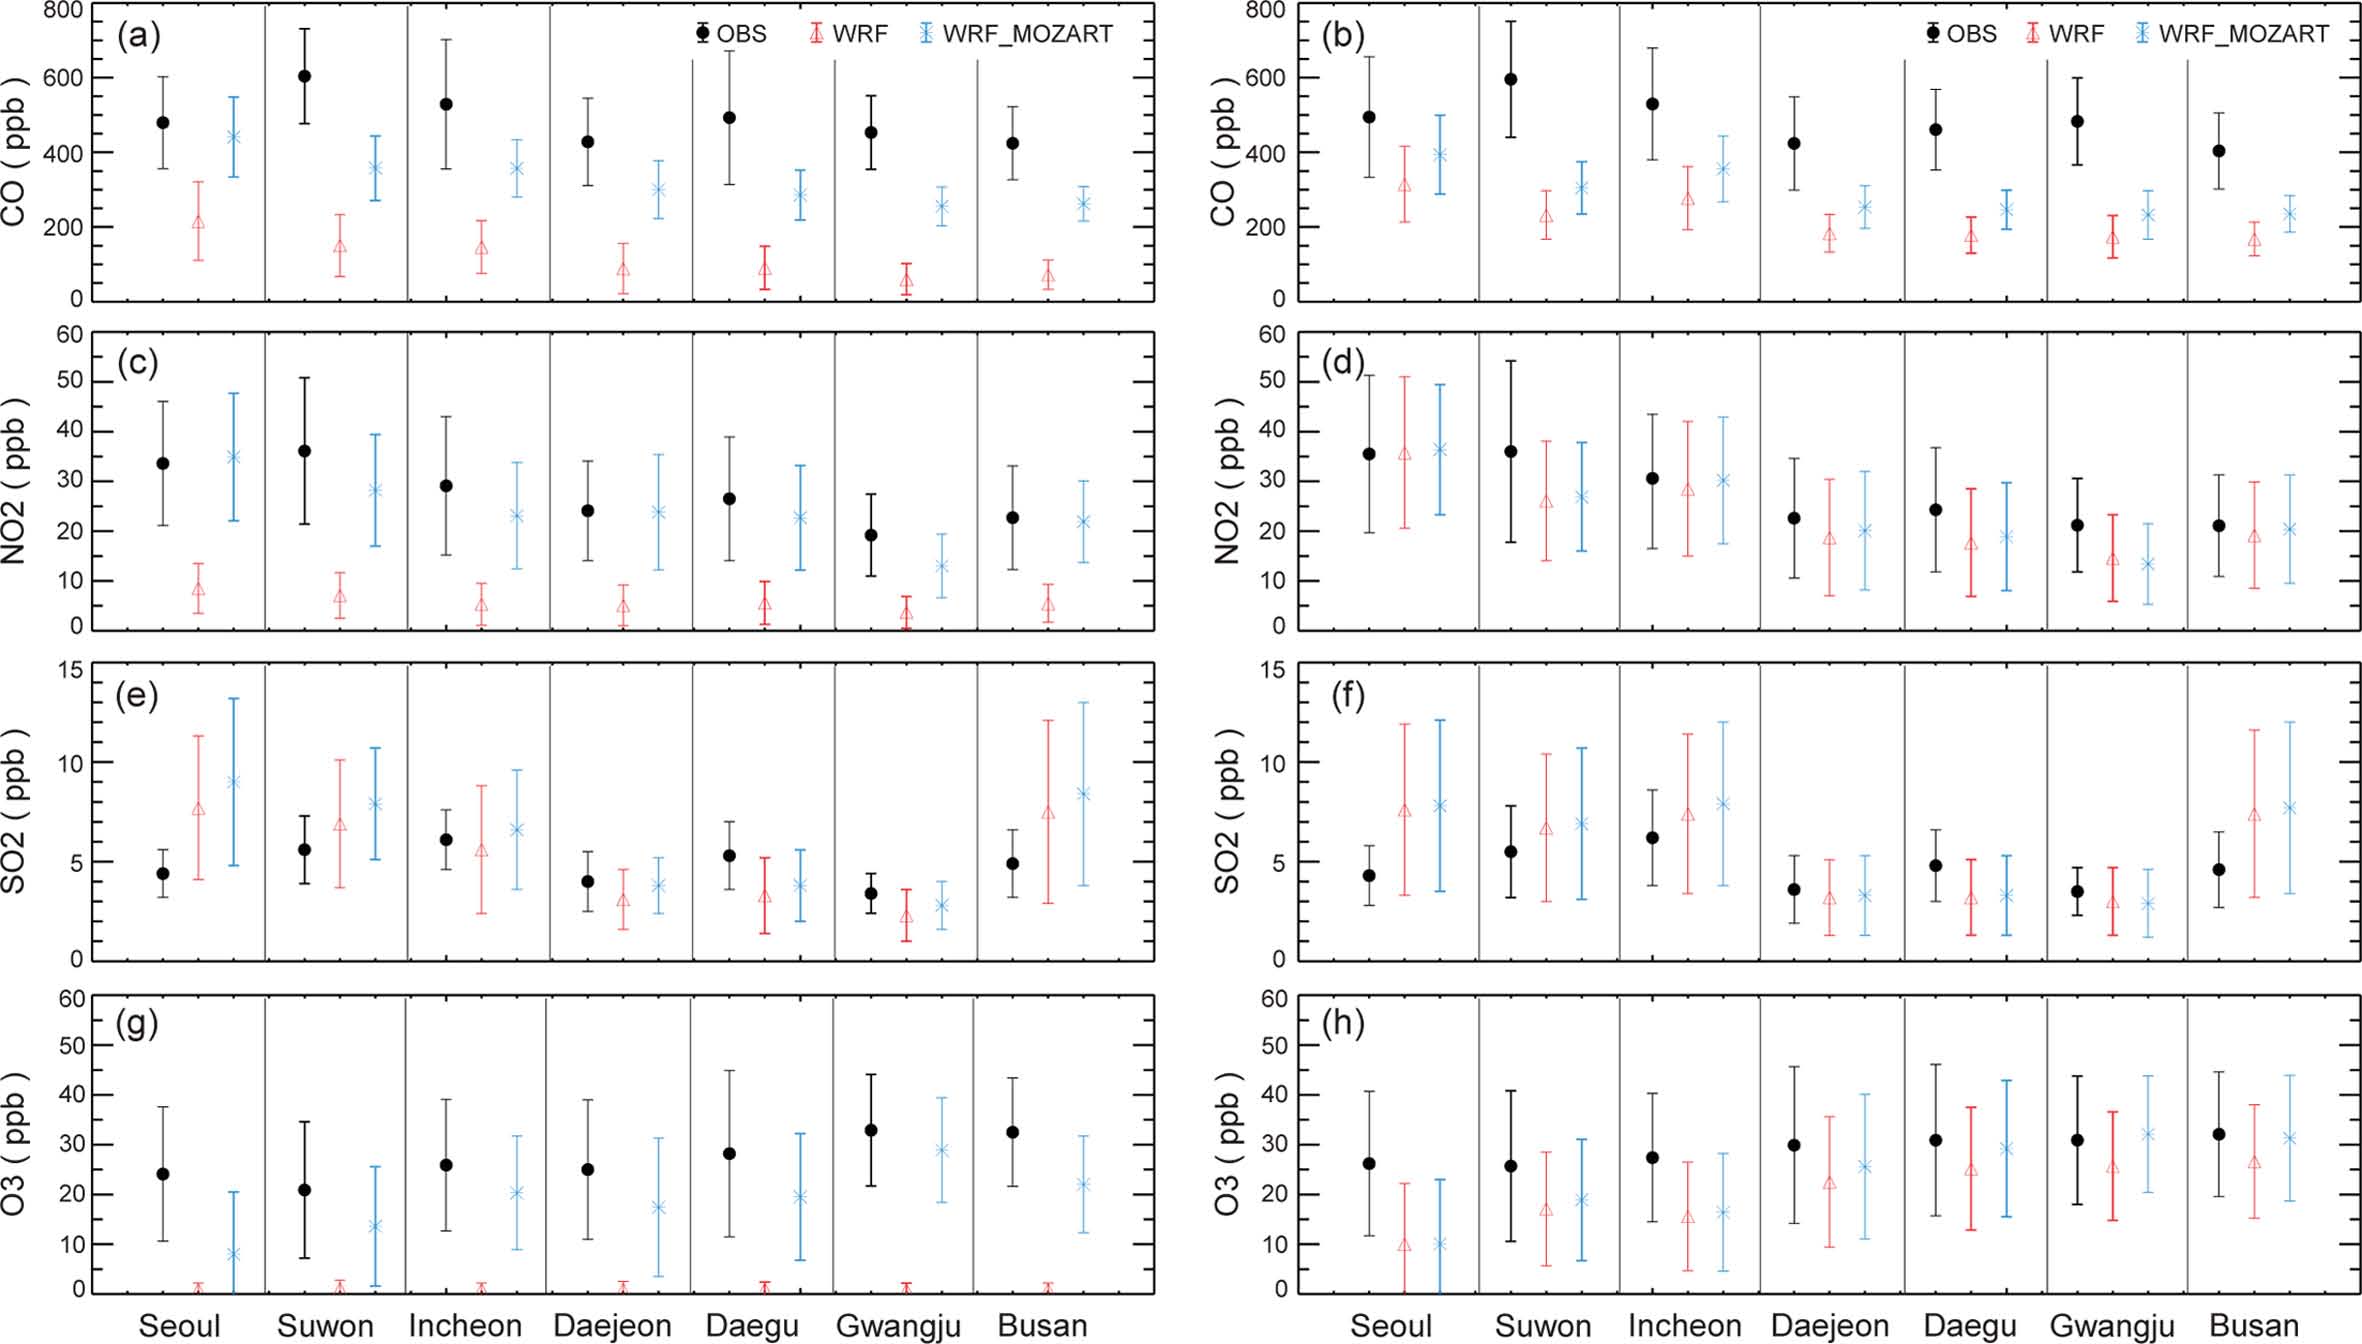
Statistical comparison of observed and simulated near-surface CO, NO2, SO2, and O3 mixing ratios at seven major Korean cities for two periods of influence by chemical initial condition (1~4 April 2010; 3 days) and chemical boundary condition (8~30 April 2010; 23 days).
3.3 오염물질의 공간 분포 특성
Figure 9는 WRF와 WRF_MOZART 실험에서 모의된 주요 오염물질의 평균 지상농도 분포를 나타내고 있다. 오염물질 농도 분포는 인위적 배출원의 공간 분포(Fig. 1b)와 잘 일치하고, 주요 배출원 지역에서 일차 오염 물질인 CO, NO2, SO2의 농도는 높게 나타난다. O3의 농도는 주요 인위적 배출원 지역에서 낮은 농도(5~20 ppb)를 보이며, 티벳 고원 지역과 북서 태평양 해양에서 50~60 ppb의 높은 농도를 가지는 특징을 보인다. Hong et al. (2012)는 CMAQ 모형으로 모의된 5월과 8월 평균 O3 농도가 주요 인위적 배출원 지역에서 10~40 ppb, 티벳 고원 지역과 해양에서 40~70 ppb로 본 연구와 유사한 공간 분포를 보였다. WRF와 WRF_MOZART 실험 사이의 모의 농도 차이는 측면경계에서 연직 농도 차이가 크고(Fig. 3) 대기 중 체류 시간이 긴 CO와 O3에서 넓은 영역에서 큰 차이를 보인다. 한편 MOZART-4 화학 경계 조건이 지상 NO2와 SO2 농도에 미치는 영향 범위는 인위적 배출원 지역 주변으로 국한되며, 수 ppb 이내의 낮은 농도 증가로 나타난다. 이는 배경 농도의 차에 기인한 화학반응에 의한 간접적인 영향으로 보여진다.
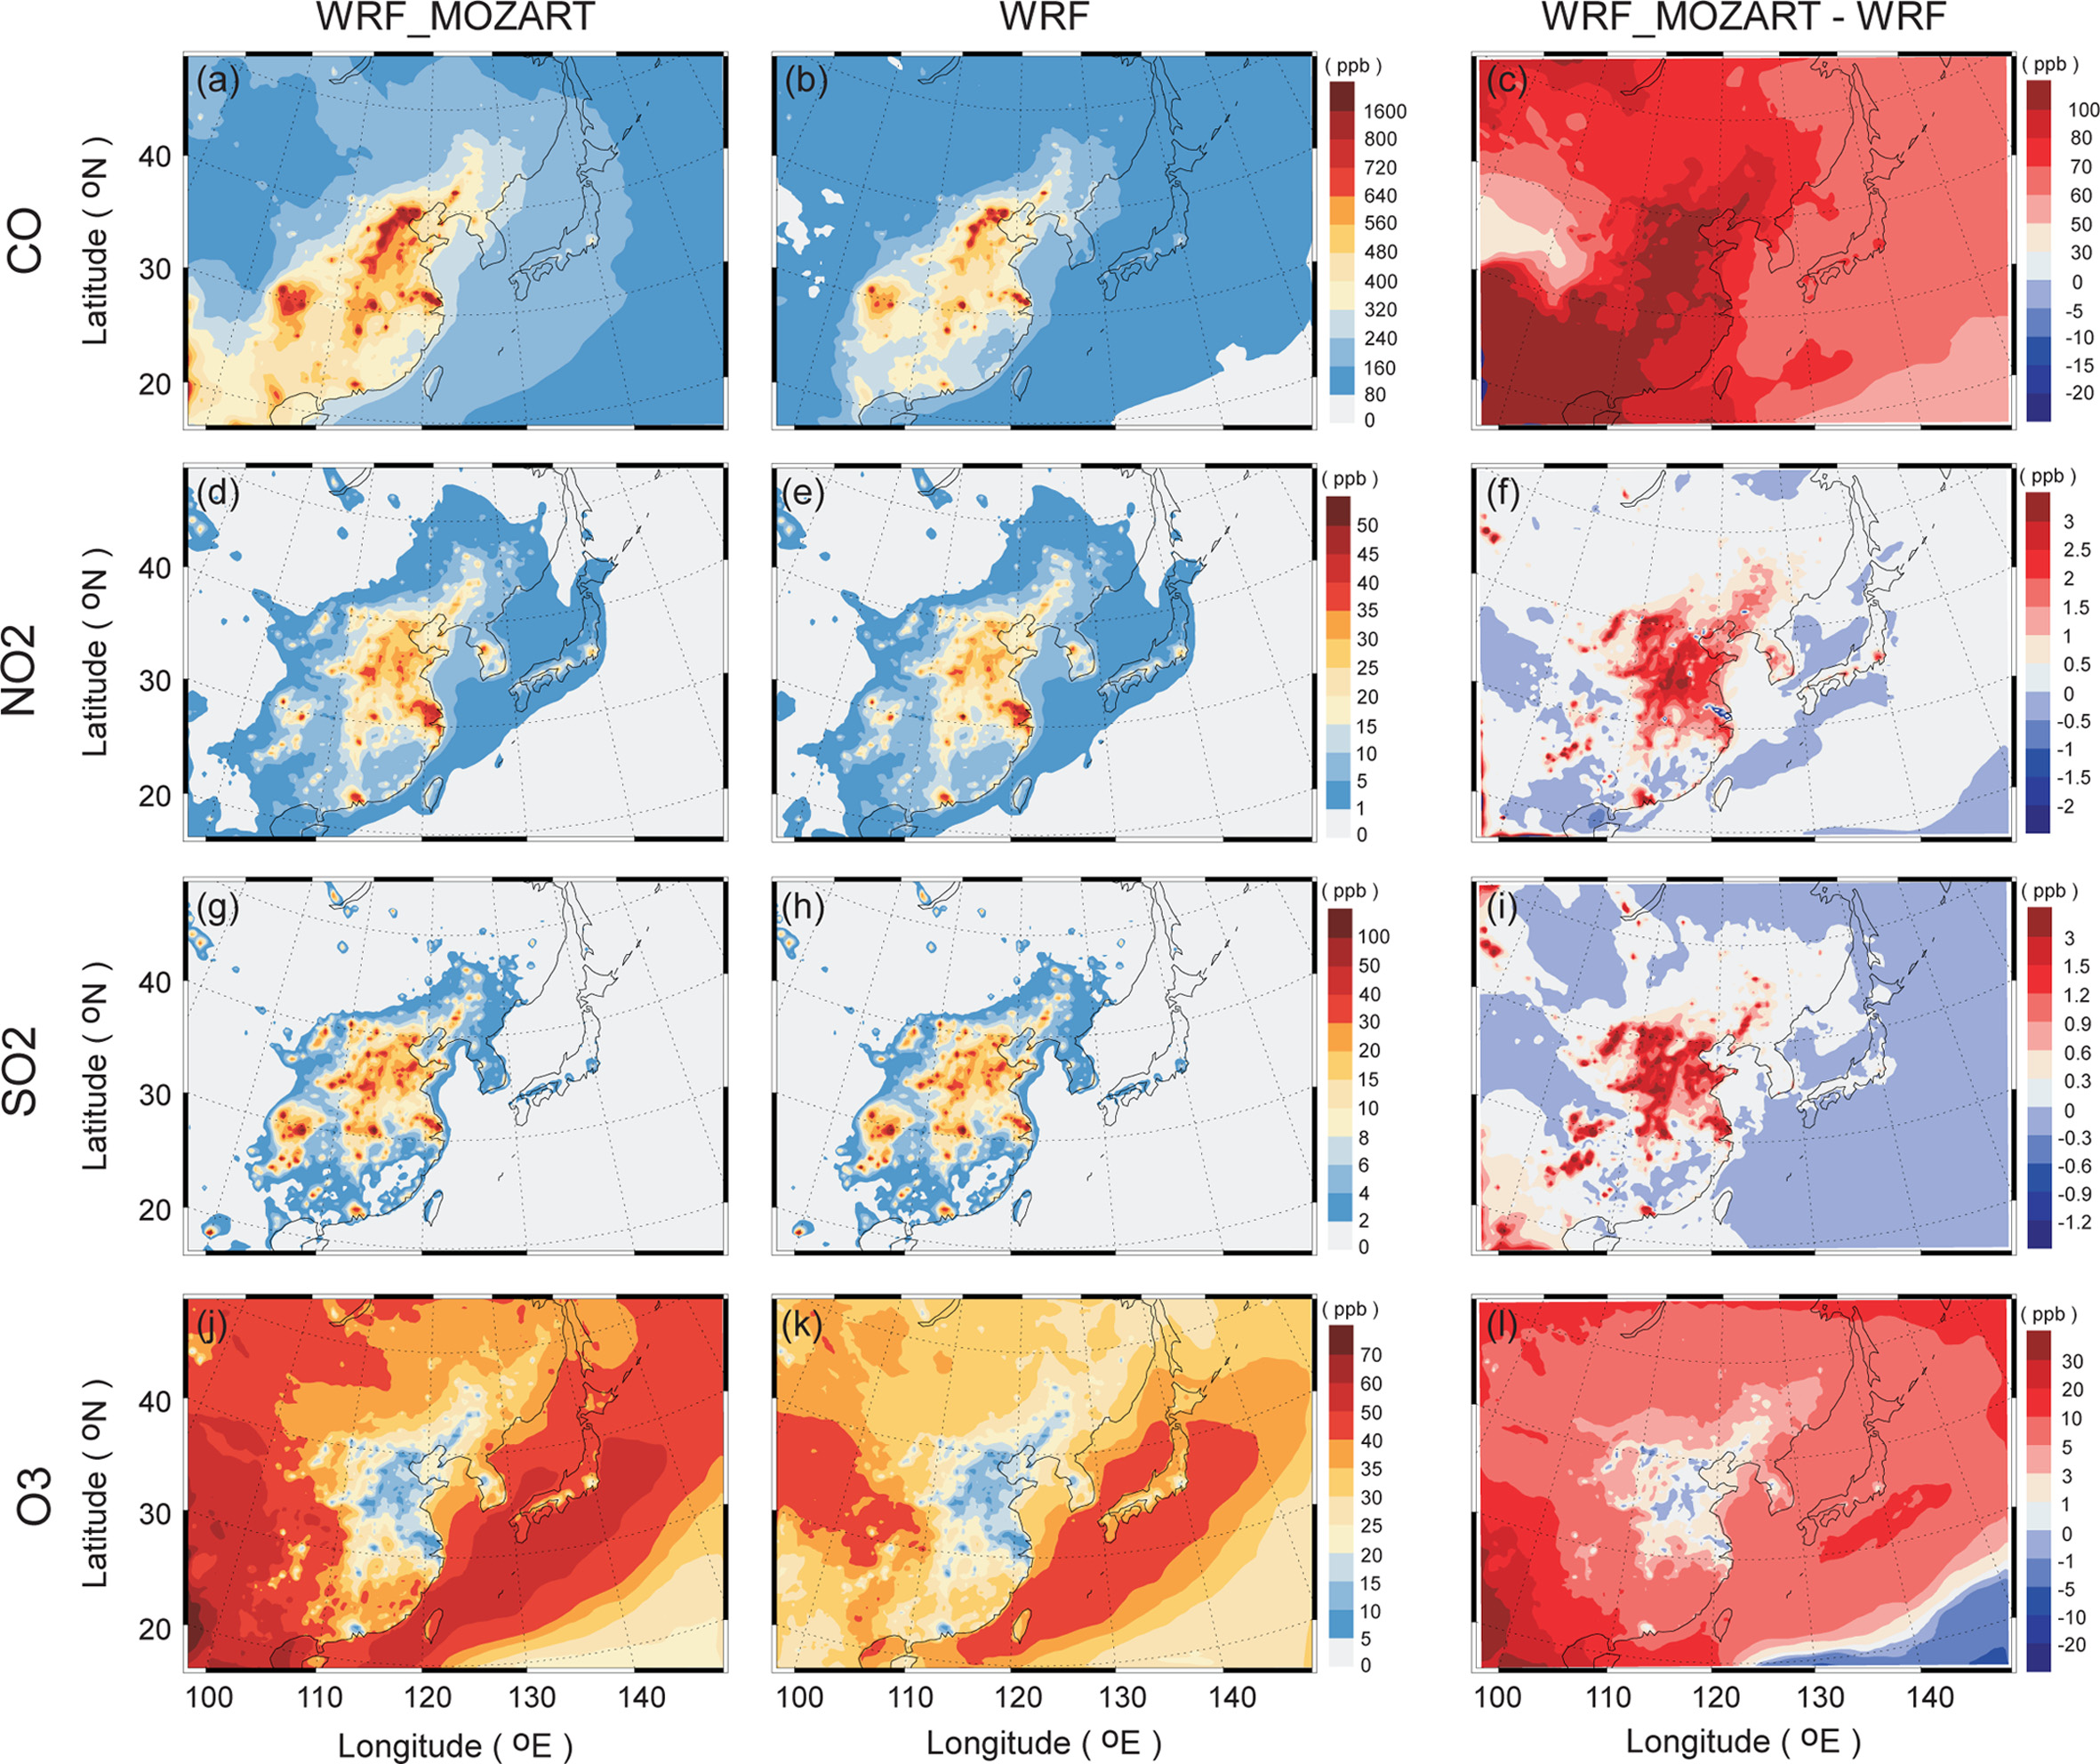
Spatial distributions of near-surface CO, NO2, SO2, and O3 mixing ratios over the East Asia domain from WRF-Chem simulation with MOZART4 chemical IC/BCs (left panels), WRF-Chem simulation with default chemical IC/BCs profiles (middle panels), and difference of the two simulations (right panels). The simulation results were averaged for 23 days from 8~30 April 2010.
Figure 10은 한반도 주변 지역에서의 두 실험에서 모의된 오염물질의 지상농도의 공간 분포를 비교하고 있다. WRF와 WRF_MOZART 실험에서 모의된 주요 오염물질의 농도 공간 분포는 주요 인위적 배출지인 도시 지역들과 교외 지역에서 서로 유사하게 나타나고 있다. 두 실험간 모의 농도의 차이는 대기 중 체류 시간이 긴 CO에서 광역으로 나타나며, 한반도 지역에서 60~80 ppb의 배경 농도 상승을 보인다. NO2와 SO2의 경우, 모의 영역 경계로부터 한반도까지의 수송 시간 규모에 비해 상대적으로 짧은 체류 시간으로 인해 MOZART-4 화학 경계 조건에 의한 한반도 주변의 해상 지역에서의 배경 농도 상승은 미미하며, 주요 도시 지역에서는 화학 물질들의 배경 농도 상승에 기인한 화학 변환의 영향으로 수 ppb 이내의 농도 증가를 보였다. O3 농도는 MOZART-4 화학 배경장의 사용으로 한반도 주변 해상 지역과 인위적 배출원이 아닌 지역을 중심으로 약 5~10 ppb의 배경 농도 상승이 나타났으며, 배출 강도가 높은 수도권 지역에서의 지상 배경 농도 증가 기여도는 매우 낮게 나타났다.
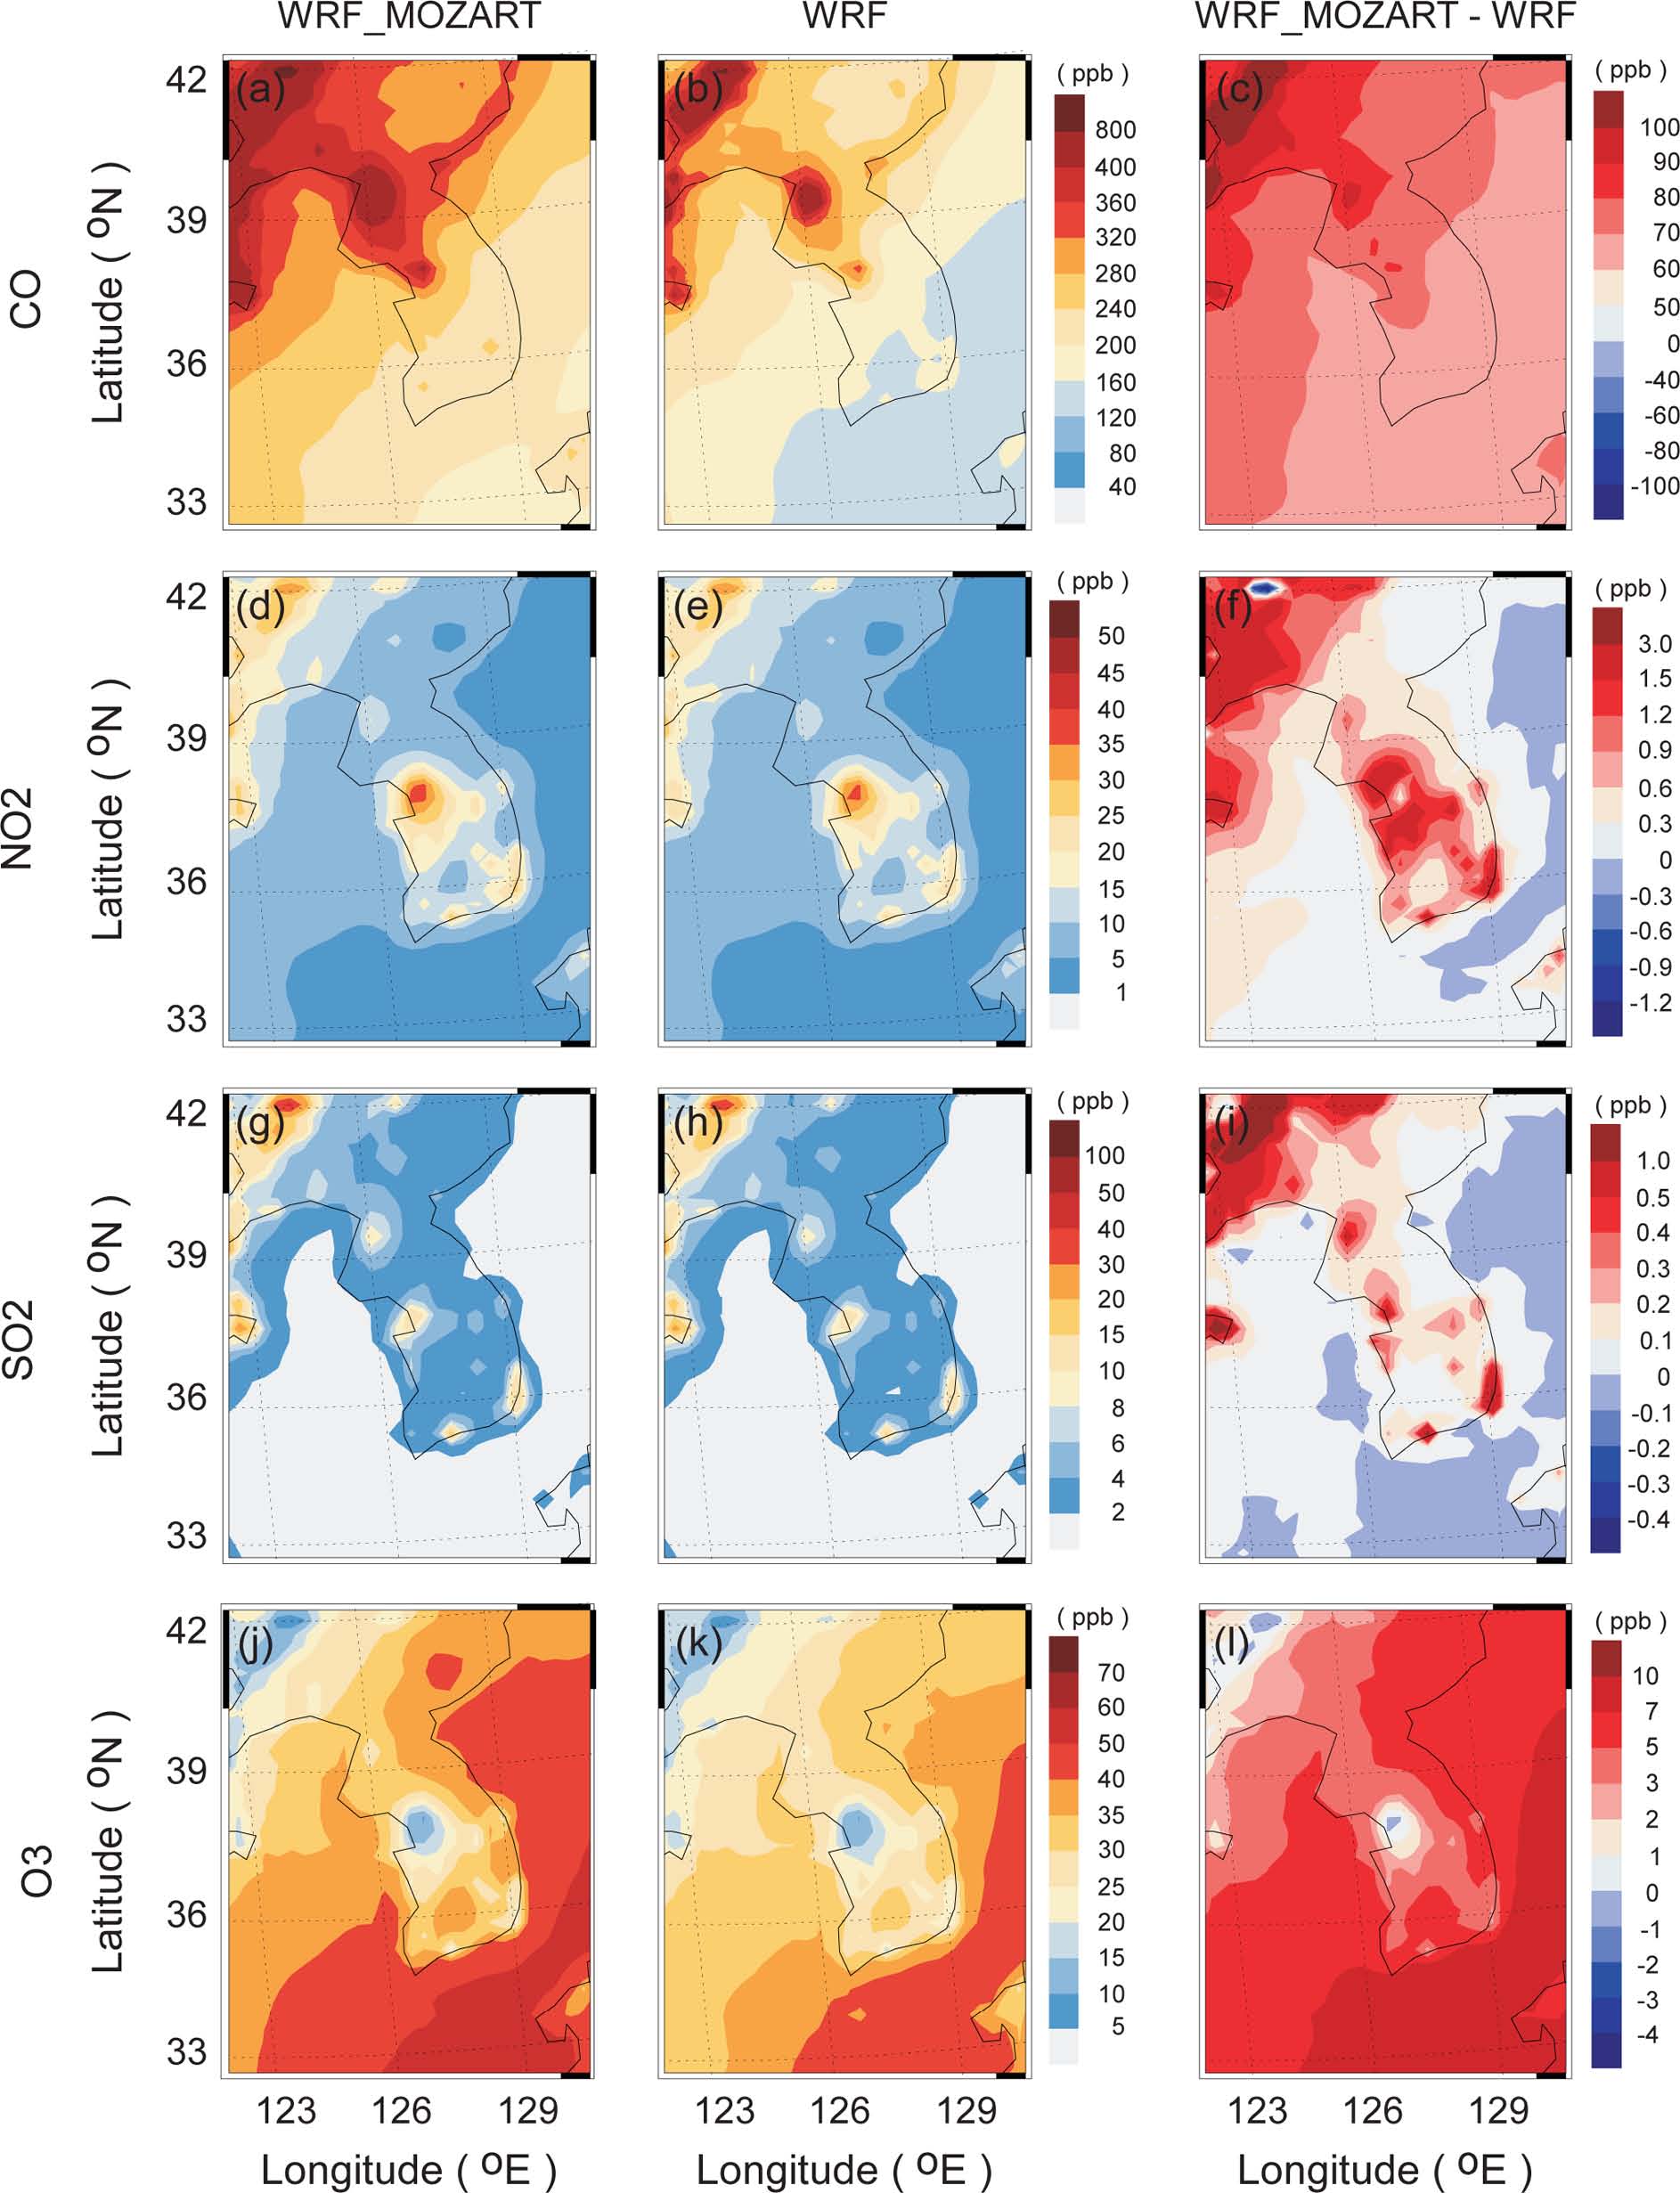
Spatial distributions of near-surface CO, NO2, SO2, and O3 mixing ratios over South Korea from WRF-Chem simulation with MOZART4 chemical IC/BCs (left panels), WRF-Chem simulation with default chemical IC/BCs profiles (middle panels), and difference of the two simulations (right panels). The simulation results were averaged for 23 days from 8~30 April 2010.
4. 요약 및 결론
본 연구에서는 중규모 대기 수송-화학 모형인 WRF-Chem(버전 3.6)을 이용하여 한반도 대기질 모의 성능을 분석하고, 전지구 화학 모형인 MOZART-4의 예측 결과를 이용하여 WRF-Chem 모형의 화학 초기 및 측면 경계 조건이 지상 대기질 모의에 미치는 영향을 정량적으로 분석하였다. 한반도를 포함한 동아시아 모의 영역에 대해 상향식(bottom-up) 배출량 산정 기법을 통해 산정된 현실적인 인위적 배출량 자료(MICSAsia 2010)를 이용하였으며, 2010년 4월(30일) 기간에 대해 화학 초기 및 측면 경계 조건을 달리하여 대기질 모의를 수행하였다(‘WRF 실험’과 ‘WRF-MOZART 실험’). 모형에 의해 모의된 기상장은 주요 도시 지역에 설치된 정규 기상관측소와 고층 관측소 측정 자료를 이용하여 검증하였으며, 환경부 지상 측정망 자료를 이용하여 주요 오염 물질인 CO, NO2, SO2, O3에 대한 WRF-Chem 모형의 모의 성능을 분석하였다.
WRF와 WRF_MOZART 실험을 통해 본 연구에서 설정한 동아시아 모의 영역에 대해 약 6일의 화학 스핀업 시간이 필요함을 확인하였으며, WRF 실험 결과는 화학 스핀업 기간 동안 매우 큰 모형-관측 편차(CO: 251~442 ppb; NO2: 16~23 ppb; O3: 19~31 ppb)가 발생하였다. MOZART-4를 이용한 화학 초기화는 초기 스핀업 기간의 CO, NO2, O3 농도의 예측 정확도를 현저히 높여 주었으나, SO2 농도의 예측 성능향상은 다른 물질들에 비해 상대적으로 낮게 나타났다. 한편, 화학 측면 경계 조건이 대기질 모의에 미치는 영향은 측면 경계 지역에서의 두 실험간의 농도 연직 분포의 차이와 주요 물질들의 대기 중 체류 시간에 따라 다르게 나타났다. 또한 물질의 화학 변환특성에 따라 그 영향이 다르게 나타났다. 먼저, WRF와 WRF_MOZART에서 사용된 CO와 O3의 측면 경계에서의 농도는 시/공간적으로 큰 차이를 보였으며, NO2와 SO2는 상대적으로 미미한 차이를 나타내었다. 대기 중 체류 시간이 측면 경계에서 한반도까지의 이류 시간에 비해 상대적으로 긴 일차 오염물질인 CO는 WRF_MOZART 실험에서 WRF 실험에 비해 한반도 주변의 넓은 지역으로 60~80 ppb의 배경 농도 증가가 나타났으며, 주요 도시 지역의 측정값과의 평균편차를 최대 약 80 ppb (44%) 감소시켰다. NO2와 SO2는 짧은 체류 시간과 두 실험과 측면 경계 농도의 미미한 차이로 한반도 주변의 배경 농도 상승에는 큰 영향을 주지 못하였으며, 인위적 배출 강도가 높은 주요 도시 지역에서 화학 반응과정을 통한 약간의 지상농도 증가(< 1~2 ppb)가 나타났다. 상대적으로 긴 체류 시간을 가진 O3의 경우, 두 실험의 측면 경계 조건에서 나타난 농도 차(수 십~수 백 ppb)는 장거리 수송을 통해 한반도 주변 지역의 지상 배경 농도를 5~10 ppb 증가시켰다. 하지만 인위적 배출 강도가 높은 수도권 지역에서는 화학 반응을 통한 O3의 파괴로수 ppb 이내의 농도 증가로 나타났다. 따라서 MOZART-4 화학 경계 조건이 대도시 지역의 지상 오존 농도 예측에 미치는 영향은 교외 및 한반도 주변 지역에 비해 낮게 나타남을 알 수 있다.
WRF_MOZART 실험의 한반도 주요 도시의 지상대기질 예측 성능(IOA = 0.35~0.81)이 WRF 실험(IOA = 0.34~0.78)에 비해 향상되었으나, 주요 오염물질들의 모의 예측의 한계도 파악되었다. 먼저 모형에 의한 CO 농도는 주요 도시에서 전반적으로 크게 과소 모의되고 있으며, 이는 산정된 인위적 배출량이 어느 정도 과소 평가된 것으로 추측된다. 또한 SO2의 농도는 주요 도시 지역에서 과대 혹은 과소 모의 특성을 보이며, 측정값에 비해 큰 일변화 경향이 나타나고 있는데, 이는 배출량의 불확실성과 화학 과정(액상 화학 반응, SO2-SO4 변환 반응)의 불확실성에 기인하는 것으로 판단된다(McKeen et al., 2007; Tuccella et al., 2012).
Acknowledgments
본 논문의 개선을 위해 좋은 의견을 제시해 주신 두 분의 심사위원께 감사드립니다. 이 연구는 기상청 기상산업 지원 및 활용기술개발사업(KMIPA2015-5043)의 지원으로 수행되었습니다.
References
-
Ackermann, I. J., H. Hass, M. Memmesheimer, A. Ebel, F. S. Binkowski, and U. Shankar, (1998), Modal aerosol dynamics model for Europe: Development and first applications, Atmos. Environ, 32, p2981-2999.
[https://doi.org/10.1016/s1352-2310(98)00006-5]

- Benjey, W., M. Houyoux, and J. Susick, (2001), Implementation of the SMOKE emission data processor and SMOKE tool input data processor in models-3, U.S. EPA.
-
Borge, R., J. Lopez, J. Lumbreras, A. Narros, and E. Rodriguez, (2010), Influence of boundary conditions on CMAQ simulations over the Iberian Peninsula, Atmos. Environ, 44, p2681-2695.
[https://doi.org/10.1016/j.atmosenv.2010.04.044]

-
Carmichael, G. R., G. Calori, H. Hayami, I. Uno, S.-Y. Cho, M. Engardt, S.-B. Kim, Y. Ichikawa, Y. Ikeda, J.-H. Woo, H. Ueda, and M. Amann, (2002), The MICSAsia study: Model intercomparison of long-range transport and sulfur deposition in East Asia, Atmos. Environ, 36, p175-199.
[https://doi.org/10.1016/S1352-2310(01)00448-4]

- Cater, W. P. L., (2000), Documentation of the SAPRC-99 chemical mechanism for VOC reactivity assessment, Final Report to the California Air Resources Board, Contracts No. 92-329 and No. 95-308.
-
Chen, F., and J. Dudhia, (2001), Coupling an advanced land surface-hydrology model with the Penn State-NCAR MM5 modeling system. Part I: Model implementation and sensitivity, Monthly Wea. Rev.,, 129, p569-585.
[https://doi.org/10.1175/1520-0493(2001)129<0569:caalsh>2.0.co;2]

- Cho, K.-T., J.-C. Kim, and J.-H. Hong, (2006), A study on the comparison of biogenic VOC (BVOC) emissions estimates by BEIS and CORINAIR methodologies, J. Korean Soc. Atmos. Environ, 22, p167-177.
- Coats, C. J. Jr., (1996), High performance algorithms in the sparse matrix operator kernel emissions (SMOKE) modeling system, Ninth Joint Conf. on Applications of Air Pollution Meteorology with the A & WMA, Atlanta, GA, Amer. Meteor. Soc, p584-588.
-
Damian, V., A. Sandu, M. Damian, F. Potra, and G. R. Carmichael, (2002), The kinetic preprocessor KPP-a software environment for solving chemical kinetics, Comput. Chem. Eng, 26, p1567-1579.
[https://doi.org/10.1016/S0098-1354(02)00128-X]

-
Dudhia, J., (1989), Numerical study of convection observed during the winter monsoon experiment using a mesoscale two-dimensional model, J. Atmos. Sci, 46, p3077-3107.
[https://doi.org/10.1175/1520-0469(1989)046<3077:NSOCOD>2.0.CO;2]

-
Elbern, H., H. Schmidt, and A. Ebel, (1997), Variational data assimilation for tropospheric chemistry modeling, J. Geophys. Res, 102, p15967-15985.
[https://doi.org/10.1029/97JD01213]

-
Elbern, H., and H. Schmidt, (1999), A four-dimensional variational chemistry data assimilation scheme for Eulerian chemistry transport modeling, J. Geophys. Res, 104, p18583-18598.
[https://doi.org/10.1029/1999JD900280]

-
Elbern, H., and H. Schmidt, (2001), Ozone episode analysis by four-dimensional variational chemistry data assimilation, J. Geophys. Res, 106, p3569-3590.
[https://doi.org/10.1029/2000JD900448]

-
Elbern, H., A. Strunk, H. Schmidt, and O. Talagrand, (2007), Emission rate and chemical state estimation by 4- dimensional variational inversion, Atmos. Chem. Phys, 7, p3749-3769.
[https://doi.org/10.5194/acp-7-3749-2007]

-
Emmons, L. K., and Coauthors , (2010), Description and evaluation of the model for ozone and related chemical tracers, version 4 (MOZART-4), Geosci. Model Develop, 3, p43-67.
[https://doi.org/10.5194/gmd-3-43-2010]

-
Fast, J., and Coauthors , (2009), Evaluating simulated primary anthropogenic and biomass burning organic aerosols during MILAGRO: Implications for assessing treatments of secondary organic aerosols, Atmos. Chem. Phys, 9, p6191-6215.
[https://doi.org/10.5194/acp-9-6191-2009]

-
Guenther, A., T. Karl, P. Harley, C. Wiedinmyer, P. I. Palmer, and C. Geron, (2006), Estimates of global terrestrial isoprene emissions using MEGAN (Model of Emissions of Gases and Aerosols from Nature), Atmos. Chem. Phys, 6, p107-173.
[https://doi.org/10.5194/acpd-6-107-2006]

-
Ginoux, P., M. Chin, I. Tegen, J. M. Prospero, B. Holben, O. Dubovik, and S. J. Lin, (2001), Sources and distributions distributions of dust aerosols simulated with the GOCART model, J. Geophys. Res, 106, p20225-20273.
[https://doi.org/10.1029/2000JD000053]

-
Gong, S. L., X. Y. Zhang, T. L. Zhao, I. G. Mckendry, D. A. Jaffe, and N. M. Lu, (2003), Characterization of soil dust aerosol in China and its transport and distribution during 2001 ACE-Asia: 2. model simulation and validation, J. Geophys. Res, 108, p4262.
[https://doi.org/10.1029/2002JD002633]

-
Grell, G. A., S. E. Peckham, R. Schmitz, S. A. McKeen, G. Frost, W. C. Skamarock, and B. Eder, (2005), Fully coupled “online” chemistry within the WRF model, Atmos. Environ, 39, p6957-6975.
[https://doi.org/10.1016/j.atmosenv.2005.04.027]

-
Grell, G. A., and S. R. Freitas, (2013), A scale and aerosol aware stochastic convective parameterization for weather and air quality modeling, Atmos. Chem. Phys, 13, p23845-23893.
[https://doi.org/10.5194/acpd-13-23845-2013]

-
Hogrefe, C., P. S. Porter, E. Gego, A. Gilliland, R. Gilliam, J. Swall, J. Irwin, and S. T. Rao, (2006), Temporal features in observed and simulated meteorology and air quality over the Eastern United States, Atmos. Environ, 40, p5041-5055.
[https://doi.org/10.1016/j.atmosenv.2005.12.056]

-
Hong, S.-C., J.-B. Lee, J.-Y. Choi, K.-J. Moon, H.-J. Lee, Y.-D. Hong, S.-J. , Lee, and C.-K. Song, (2012), The effect of the chemical lateral boundary conditions on CMAQ simulations of tropospheric ozone for East Asia, J. Korean Soc. Atmos. Environ, 28, p581-594.
[https://doi.org/10.5572/KOSAE.2012.28.5.581]

-
Hong, S.-Y., J. Dudhia, and S. H. Chen, (2004), A revised approach to ice microphysical processes for the bulk parameterization of clouds and precipitation, Monthly Wea. Rev, 132, p103-120.
[https://doi.org/10.1175/1520-0493(2004)132<0103:ARATIM>2.0.CO;2]

-
Hong, S.-Y., Y. Noh, and J. Dudhia, (2006), A new vertical diffusion package with an explicit treatment of entrainment processes, Monthly Wea. Rev, 134, p2318-2341.
[https://doi.org/10.1175/MWR3199.1]

-
Horowitz, L. W., S. Walters, D. L. Mauzerall, L. K. Emmons, P. J. Rasch, C. Granier, X. Tie, J. F. Lamarque, M. G. Schultz, G. S. Tyndall, J. J. Orlando, and G. P. Brasseur, (2003), A global simulation of tropospheric ozone and related tracers: Description and evaluation of MOZART, version 2, J. Geophys. Res, 108(D24), p4784.
[https://doi.org/10.1029/2002JD002853]

-
Horowitz, L. W., and S.-U. Park, (2002), A simulation of long-range transport of Yellow Sand observed in April 1998 in Korea, Atmos. Environ, 36, p4173-4187.
[https://doi.org/10.1016/S1352-2310(02)00361-8]

-
Horowitz, L. W., D. W. Byun, R. J. Park, N.-K. Moon, S. T. Kim, and S. Zhong, (2007), Impact of transboundary transport of carbonaceous aerosols on the regional air quality in the United States: A case study of the South American wildland fire of May 1998, J. Geophys. Res, 112, pD07201.
[https://doi.org/10.1029/2006JD007544]

-
Iacono, M. J., J. S. Delamere, E. J. Mlawer, M. W. Shephard, S. A. Clough, and W. D. Collins, (2008), Radiative forcing by long-lived greenhouse gases: Calculations with the AER radiative transfer models, J. Geophys. Res, 113, pD13103.
[https://doi.org/10.1029/2008JD009944]

-
Jeon, W.-B., H.-W. Lee, S.-H. Lee, J.-H. Park, and H.-G. Kim, (2014), Numerical study on the characteristics of high PM2.5 episodes in Anmyeondo area in 2009, J. Environ. Sci. International, 23, p249-259.
[https://doi.org/10.5322/JESI.2014.23.2.249]

-
Jonson, J. E., J. K. Sundet, and L. Tarrason, (2001), Model calculations of present and future levels of ozone and ozone precursors with a global and a regional model, Atmos. Environ, 35, p525-537.
[https://doi.org/10.1016/S1352-2310(00)00314-9]

-
Kang, J.-Y., S.-W. Kim, and S.-C. Yoon, (2012), Estimation of dust emission schemes and input parameters in wintertime Asian dust simulation: A case study of winter dust event on December 29, 2007, J. Korean Soc. Atmos. Environ, 1, p1-11.
[https://doi.org/10.5572/KOSAE.2012.28.1.001]

-
Kim, J.-Y., J.-S. Kim, J.-H. Hong, D.-I. Jung, S.-J. Ban, and Y.-M. Lee, (2008a), Assessment of changed input modules with SMOKE model, J. Korean Soc. Atmos. Environ, 24, p284-299.
[https://doi.org/10.5572/KOSAE.2008.24.3.284]

-
Kim, S.-T., N.-K. Moon, and D.-W. Byun, (2008b), Korea emissions inventory processing using the US EPA’s SMOKE system, Asian J. Atmos. Environ, 2, p34-46.
[https://doi.org/10.5572/ajae.2008.2.1.034]

-
Kim, S.-T., N.-K. Moon, K.-T. Cho, D.-W. Byun, and E.-Y. Song, (2008c), Estimation of biogenic emissions over South Korea and its evaluation using air quality simulations, J. Korean Soc. Atmos. Environ, 24, p423-438.
[https://doi.org/10.5572/KOSAE.2008.24.4.423]

-
Kim, S.-T., and C.-B. Lee, (2011), Estimating influence of local and neighborhood emissions on ozone concentrations over the Kwang-Yang Bay based on air quality simulations for a 2010 June episode, J. Korean Soc. Atmos. Environ, 27, p504-522.
[https://doi.org/10.5572/KOSAE.2011.27.5.504]

-
Kim, S.-T., (2011), Ozone simulations over the Seoul metropolitan area for a 2007 June episode, part V: Application of CMAQ-HDDM to predict ozone response to emission change, J. Korean Soc. Atmos. Environ, 27, p772-790.
[https://doi.org/10.5572/KOSAE.2011.27.6.772]

- Klimont, Z., J. Cofala, W. Schopp, M. Amann, D. G. Streets, Y. Ichikawa, and S. Fujita, (2001), Projections of SO2, NOx, NH3 and VOC emissions in East Asia up to 2030, Water, Air Soil Pollut., 130, p193-198.
-
Kurokawa, J., T. Ohara, T. Morikawa, S. Hanayama, G. Janssens-Maenhout, T. Fukui, K. Kawashima, and H. Akimoto, (2013,), Emissions of air pollutants and greenhouse gases over Asian regions during 2000- 2008: Regional emission inventory in Asia (REAS) version 2, Atmos. Chem. Phys, 13, p11019-11058.
[https://doi.org/10.5194/acp-13-11019-2013]

-
Lee, H.-J., S.-W. Kim, J. Brioude, O. R. Cooper, G. J. Frost, C.-H. Kim, R.-J. Park, M. Trainer, and J.-H. Woo, (2014), Transport of NOx in East Asia identified by satellite and in situ measurements and lagrangian particle dispersion model simulations, J. Geophys. Res, 119.
[https://doi.org/10.1002/2013JD021185]

-
Lee, S.-H., S.-W. Kim, M. Trainer, G. J. Frost, S. A. McKeen, O. R. Cooper, F. Flocke, J. S. Holloway, J. A. Neuman, T. Ryerson, C. J. Senff, A. L. Swanson, and A. M. Thompson, (2011), Modeling ozone plumes observed downwind of New York City over the North Atlantic Ocean during the ICARTT field campaign, Atmos. Chem. Phys, 11, p7375-7397.
[https://doi.org/10.5194/acp-11-7375-2011]

-
Liu, S. C., and Coauthors , (1996), Model study of tropospheric trace species distributions during PEM-West A, J. Geophys. Res, 101, p2073-2085.
[https://doi.org/10.1029/95JD02277]

-
Liu, X., L. Duan, J. Mo, E. Du, J. Shen, X. Lu, Y. Zhang, X. Zhou, C. He, and F. Zhang, (2011), Nitrogen deposition and its ecological impact in China: An overview, Environ. Pollut, 159, p2251-2264.
[https://doi.org/10.1016/j.envpol.2010.08.002]

-
Madronich, S., (1987), Photodissociation in the atmosphere 1. Actinic flux and the effects of ground reflections and clouds, J. Geophys. Res, 92, p9740-9752.
[https://doi.org/10.1029/JD092iD08p09740]

-
McKeen, S. A., G. Wotawa, D. D. Parrish, J. S. Holloway, M. P. Buhr, G. Hubler, F. C. Fehsenfeld, and J. F. Meagher, (2002), Ozone production from Canadian wildfires during June and July of 1995, J. Geophys. Res, 107, p4192.
[https://doi.org/10.1029/2001JD000697]

-
McKeen, S. A., S. H. Chung, J. Wilczak, G. Grell, I. Djalalova, S. Peckham, W. Gong, V. Bouchet, R. Moffet, Y. Tang, G. R. Carmichael, R. Mathur, and S. Yu, (2007), Evaluation of several PM2.5 forecast models using data collected during the ICARTT/NEAQS 2004 field study, J. Geophys. Res, 112.
[https://doi.org/10.1029/2006JD007608]

-
Meij, A. D., E. Bossioli, C. Penard, J. F. Vinuesa, and I. Price, (2015), The effect of SRTM and Corine Land Cover data on calculated gas and PM10 concentrations in WRF-Chem, Atmos. Environ, 101, p177-193.
[https://doi.org/10.1016/j.atmosenv.2014.11.033]

- Moon, Y.-S., and Y.-S. Koo, (2006), A study on examples applicable to numerical land cover map data for atmospheric environment fields in the metropolitan area of Seoul - Real time calculation of biogenic CO2 flux and VOC emission due to a geographical distribution of vegetable and analysis on sensitivity of air temperature and wind field within MM5, MM5. J. Korean Soc. Atmos. Environ, 22, p661-678.
-
Moon, Y.-S., Y.-S. Koo, and O.-J. Jung, (2014), Analysis of sensitivity to prediction of particulate matters and related meteorological fields using the WRF-Chem model during Asian dust episode days, J. Korean Earth Sci. Soc, 35, p1-18.
[https://doi.org/10.5467/JKESS.2014.35.1.1]

-
Samaali, M., M. D. Moran, V. S. Bouchet, R. Pavlovic, S. Cousineau, and M. Sassi, (2009), On the influence of chemical initial and boundary conditions on annual regional air quality model simulations for North America, Atmos. Environ, 43, p4873-4885.
[https://doi.org/10.1016/j.atmosenv.2009.07.019]

-
Sandu, A., D. N. Daescu, and G. R. Carmichael, (2003), Direct and adjoint sensitivity analysis of chemical kinetic systems with KPP: Part I-theory and software tools, Atmos. Environ, 37, p5083-5096.
[https://doi.org/10.1016/j.atmosenv.2003.08.019]

-
Schell, B., I. J. Ackermann, H. Hass, F. S. Binkowski, and A. Ebel, (2001), Modeling the formation of secondary organic aerosol within a comprehensive air quality model system, J. Geophys. Res, 106, p28275-28293.
[https://doi.org/10.1029/2001JD000384]

- Seinfeld, J. H., and S. N. Pandis, (1997), Atmospheric chemistry and physics: From air pollution to climate change, Wiley Intersci, p1326.
-
Song, C.-K., D.-W. Byun, R. B. Pierce, J. A. Alsaadi, T. K. Schaack, and F. Vukovich, (2008), Downscale linkage of global model output for regional chemical transport modeling: Method and general performance, J. Geophys. Res, 113, pD08308.
[https://doi.org/10.1029/2007JD008951]

-
Stockwell, W. R., F. Kirchner, M. Kuhn, and S. Seefeld, (1997), A new mechanism for regional atmospheric chemistry modeling, J. Geophys. Res, 102, p25847-25879.
[https://doi.org/10.1029/97JD00849]

-
Skamarock, W. C., and J. B. Klemp, (2008), A time-split nonhydrostatic atmospheric model for weather research and forecasting applications, J. Comput. Phys, 227, p3465-3485.
[https://doi.org/10.1016/j.jcp.2007.01.037]

-
Tang, Y., and Coauthors , (2007), Influence of lateral and top boundary conditions on regional air quality prediction: A multiscale study coupling regional and global chemical transport models, J. Geophys. Res, 112, pD10S18.
[https://doi.org/10.1029/2006JD007515]

-
Tang, Y., and Coauthors , (2009), The impact of chemical lateral boundary conditions on CMAQ predictions of tropospheric ozone over the continental United States, Environ. Fluid Mech, 9, p43-58.
[https://doi.org/10.1007/s10652-008-9092-5]

-
Tuccella, P., G. Curci, G. Visconti, B. Bessagnet, L. Menut, and R. J. Park, (2012), Modeling of gas and aerosol with WRF/Chem over Europe: Evaluation and sensitivity study, J. Geophys. Res, 117, pD03303.
[https://doi.org/10.1029/2011JD016302]

-
Wu, J.-B., J. Xu, M. Pagowski, F. Geng, S. Gu, G. Zhou, Y. Xie, and Z. Yu, (2015), Modeling study of a severe aerosol pollution event in December 2013 over Shanghai China: An application of chemical data assimilation, Particuology, 20, p41-51.
[https://doi.org/10.1016/j.partic.2014.10.008]

- Zannetti, P., (2003), Air quality modeling: Theories, methodologies, computational techniques, and available databases and software, EnviroComp Institute Air Waste Manage. Assoc, p42-43.
-
Zhang, Q., D. G. Streets, K. He, Y. Wang, A. Richter, J. P. Burrows, I. Uno, C. J. Jang, D. Chen, Z. Yao, and Y. Lei, (2007), NOx emission trends for China, 1995- 2004: The view from the ground and the view from space, J. Geophys. Res, 112, pD22306.
[https://doi.org/10.1029/2007JD008684]

-
Zhang, Q., D. G. Streets, G. R. Carmichael, K. B. He, H. Huo, A. Kannari, Z. Klimont, I. S. Park, S. Reddy, J. S. Fu, D. Chen, L. Duan, Y. Lei, L. T. Wang, and Z. L. Yao, (2009), Asian emissions in 2006 for the NASA INTEXB mission, Atmos. Chem. Phys, 9, p5131-5153.
[https://doi.org/10.5194/acp-9-5131-2009]


