
섬광계를 이용한 비균질 도시 지표에서의 현열속 산정
Abstract
A large aperture scintillometer (LAS) was deployed with an optical path length of 2.1 km to estimate turbulent sensible heat flux (QH) over a highly heterogeneous urban area. Scintillation measurements were conducted during cold season in November and December 2013, and the daytime data of 14 days were used in the analysis after quality control processes. The LAS-derived QH show reasonable temporal variation ranging 20~160W m-2 in unstable atmospheric conditions, and well compare with the measured net radiation. The LAS footprint analysis suggests that QH can be relatively high when the newly built-up urban area has high source contribution of the turbulent flux in the study area (‘northwesterly winds’). Sensitivity tests show that the LAS-derived QH are highly sensitive to non-dimensional similarity function for temperature structure function parameter, but relatively less sensitive to surface aerodynamic parameters and meteorological variables (temperature and wind speed). A lower Bowen ratio also has a significant influence on the flux estimation. Overall uncertainty of the estimated daytime QH is expected within about 20% at an upper limit for the analysis data. It is also found that stable atmospheric conditions can be poorly determined when the scintillometry technique is applied over the highly heterogeneous urban area.
Keywords:
Heterogeneous surface, Monin-Obukov similarity theory, scintillometer, sensible heat flux1. 서 론
지구 지표면에는 도시, 산림, 수역 등 다양한 지면 피복과 복잡한 지형 고도의 변화가 나타난다. 이들 지표면과 대기 사이에서는 난류에 의한 열, 수분, 운동량의 교환이 지속적으로 일어나며, 이런 난류 교환 과정을 통해 특징적인 대기 경계층의 열적/역학적 구조가 형성된다(Garratt, 1992). 대기 경계층은 지구 지표와 맞닿아 있는 하부 대기층으로, 중규모 및 대규모 기상학, 농업 및 산림 기상학, 해양 기상학, 대기 오염 분야 등 폭넓은 분야에서 중요한 의미를 가진다. 따라서 다양한 특징을 가지는 지표면의 대기 지표층에서 이들 난류속(turbulent flux)을 정확하게 산정하는 일은 대기 경계층의 발달과 구조의 이해를 위해 중요할 뿐만 아니라 이를 기반으로 개발/활용되고 있는 다양한 공간 규모의 기상 및 대기질 모델링의 검증을 위해서도 매우 중요하다.
일반적으로 지표층 난류속은 에디 공분산(EC; eddy covariance) 방법이나 원격 탐사 방법을 이용하여 결정할 수 있다. EC 방법은 대기 운동과 온습도의 난류섭동을 고주파수로 직접 측정함으로써 난류속을 정확하게 결정할 수 있는 장점이 있어, 균질한 지표면(homogeneous surface)에서 지표층 난류속을 측정하는데 성공적으로 적용되어 왔다(e.g., Offerle et al., 2006; Liu et al., 2013). 원격 탐사 방법은 간접적으로 난류속을 산정하는 방법으로, 위성이나 섬광계(scintillometer) 측정 자료를 주로 이용한다. 위성을 이용한 산정 방법은 넓은 지역에 대해 난류속을 추정할 수 있는 장점이 있으나, 산정되는 난류속의 시/공간적 해상도가 낮은 단점을 가지며 비균질 지표면에 대한 정확도의 검증이 충분하지 못하다(e.g., Bastiaanssen et al., 1998; Marx et al., 2008). 미규모 난류속의 산정을 위해서는 섬광계를 이용하는 원격 탐사 방법(‘섬광 방법’)(scintillometry method; SM)이 보다 널리 사용되고 있다(e.g., De Bruin et al., 1995; Chehbouni et al., 2000; Beyrich et al., 2002; Zeweldi et al., 2010). 섬광 기법은 EC 방법과 달리 모닌-오브코프 상사 이론(MOST; Monin-Obukhov similarity theory)을 이용하여 영역 평균된 지표층 난류속을 계산하며, 산정하는 난류속의 공간 규모는 사용하는 섬광계의 종류와 광학 경로 거리(optical path distance)에 따라 수백 m~수 km에 이른다. 섬광계를 이용한 난류속 산정 기법은 다양한 균질 지표면에 대해 EC 기법을 이용한 측정 난류속과 상호 비교를 통해 검증되어 왔다(Hartogensis et al., 2003; Lagouarde et al., 2006; Zeweldi et al., 2010; Liu et al., 2011, 2013; Ward et al., 2014).
도시 지역에서의 지표층 난류속의 측정 연구들은 자연 지표면에서와 비슷하게 대체로 균질한 도시 지표면에서 EC나 SM 방법을 적용하여 수행되어 왔다 (e.g., Kanda et al., 2002; Lagouarde et al., 2006; Kim et al., 2008; Ward et al., 2014). 하지만 대부분의 도시 지표는 다양한 인공 구조물과 식생 등으로 구성되어 있어, 미규모에서 볼 때 형태적으로나 유체 역학적으로 비균질 지표면의 특징을 가지며, 이러한 특징을 지니는 도시 지표면에서의 난류속 산정에 관한 연구는 제한적으로 이루어졌다. Lee et al. (2015)는 지면 피복의 비균질성이 매우 높은 도시 지역에서 지표층 현열속과 운동량속을 산정하기 위해 섬광방법을 적용하였으며, 고해상도 수치 모델링 결과와 비교를 통해 비균질 도시 지표면에서 현실적인 난류속 추정이 가능함을 시사하였다. 본 연구에서는 대구경 섬광계(LAS; large aperture scintillometer)를 이용하여 비균질 도시 지표면에서의 난류 현열속을 산정하고 발자국 분석(footprint analysis)을 통해 산정된 난류속의 특성을 분석하고자 한다. 또한 섬광 기법의 비균질 도시 지표면에 적용시 유의점에 관해 고찰하고자 한다.
2. 이론적 배경
2.1 섬광 방법
섬광계는 송신부에서 내보내는 특정 전자기파를 일정한 광학 경로 거리만큼 떨어진 수신부에서 전자기파 세기의 섭동(fluctuation)을 측정한다. 이러한 전자기파 세기의 섭동을 섬광(scintillation)이라 하며, 대기난류에 의한 기온과 습도의 섭동이 대기 굴절률(refractive index)의 섭동을 야기시킴으로써 발생한다(Tatarskii, 1961; Wyngaard et al., 1971). LAS는 송신부와 수신부 사이의 전자기파 세기(I)를 대기 굴절률의 구조 매개변수(structure parameter) (〈Cn2〉)로 측정하고, 이는 다음의 관계를 가진다(Wang et al., 1978):
| (1) |
여기서 σlnI2는 자연로그를 취한 복사 강도의 분산(variance), D는 LAS 구경(aperture diameter), LLAS는 송신부와 수신부 사이의 광학 경로 거리, 〈 〉는 LAS가중 함수(weighting function)로 공간 가중 평균된 값을 의미한다. LAS 가중 함수는 광학 경로의 중심에서 최대값을 가지는 종형(bell-shaped) 함수 형태를 가진다(Frehlich and Ochs, 1990; Geli et al., 2012) (이후부터 〈Cn2〉은 간단히 Cn2으로 쓰기로 한다.).
대기 굴절률의 섭동은 난류에 의한 기온과 습도의 섭동에 기인하므로, 측정되는 Cn2은 온도 구조 매개변수(CT2), 습도 구조 매개변수(CQ2), 그리고 이들의 비선형 상호작용에 의한 구조 매개변수(CTQ2)로 표현할 수 있으며, 기압 섭동에 의한 효과는 무시할 수 있다(Hill et al., 1980). 적외선 영역의 전자기파를 사용하는 LAS에서 측정되는 ‘섬광’은 주로 기온의 섭동에 의해 영향을 받는다. 따라서 CT2는 측정된 Cn2값으로부터 다음의 관계식으로 계산할 수 있으며, 습도에 의한 영향은 보웬비(Bowen ratio)를 통해 간단히 매개화된다(Wesely, 1976):
| (2) |
여기서 T는 기온(K), P는 기압(Pa), β는 보웬비, γ = 7.8 × 10⁻⁷ (K Pa-1)이다.
LAS 측정 자료로부터 CT2이 계산되며, 대기 지표층의 난류 현열속은 MOST를 따라 계산할 수 있다(Wyngaard et al., 1971). 먼저, 온도 구조 매개변수(CT2)와 지표층 특성 온도 규모(T*)는 다음의 상사 관계식을 만족한다:
| (3) |
여기서 zeff는 LAS 광학 경로의 유효 고도, d는 영면변위 고도(zero-plane displacement height), fT는 온도 구조 함수 매개변수에 대한 보편 안정도 보정 상사함수(universal stability correction similarity function)를 나타낸다. L은 오브코프 길이(Obukhov length)로 다음과 같이 정의된다:
| (4) |
여기서 k (= 0.4)는 von Karman 상수, g는 중력 가속도이다. 지표층 마찰 속도(u*)는 다음의 상사 관계식에 의해 계산된다(Panofsky and Dutton, 1984):
| (5) |
여기서 u는 zeff 고도에서의 평균 풍속, ψm는 적분 형태의 운동량속 무차원 안정도 보정 함수를 나타낸다. 본 연구에서는 Högström (1988)에 의해 제시된 무차원 함수 관계식을 이용하였다.
위에 주어진 식(3)-(5)로부터 특성 온도 규모(T*), 마찰 속도(u*), 그리고 오브코프 길이(L)를 반복 계산법을 통해 구하면, 난류 현열속 QH는
| (6) |
로 구할 수 있다. 여기서 ρ는 공기 밀도, cp는 공기의 정압 비열을 나타낸다.
본 연구에서 식(3)의 fT는 Andreas (1988)에 제시된 함수를 따라 계산하였으며, 대기 안정도에 따라 다음과 같이 주어진다:
| (7a) |
| (7b) |
함수 fT의 선택에 따른 QH 값의 차이를 정량적으로 분석하기 위해 De Bruin et al. (1993)과 Thiermann and Grassl (1992)이 제시한 다음의 함수 관계식을 이용한 현열속 추정을 함께 수행하였다:
| (8) |
| (9) |
2.2 LAS 발자국 분석
발자국 분석은 공간상의 특정 지점에서 관측된 난류속의 영향 지역(source area)의 기여도를 정량화하기 위해 수행하며, 관측 자료의 해석에 유용하게 사용된다. 주로 EC 방법에 의해 얻어진 관측 난류속의 해석을 위해 많이 사용되었으며, 많은 연구자들에 의해 다양한 발자국 분석 모델이 제시되었다(e.g., Schmid, 1994; Hsieh et al., 2000; Kljun et al., 2004).
LAS로부터 산정되는 현열속의 발자국 분석은 광학 경로상의 다수의 지점에서 플럭스 발자국 분석을 수행한 후, 이 결과에 LAS 가중 함수를 적용하여 계산 할 수 있다(Meijninger et al., 2002; Hartogensis et al., 2003). 즉, LAS 3차원 발자국 F(x, y, zeff)는 LAS 가중 함수 W(x)와 광학 경로상의 한 점(x', y, zeff)에서의 플럭스 발자국 함수 f(x', y, zeff)의 가중 적분으로 다음과 같이 계산된다:
| (10) |
여기서 xT와 xR는 LAS의 송신부와 수신부 위치를 의미하며, y는 x - y 수평면 상에서 광학 경로(xT - xR)의 수직 방향 거리를 나타낸다. 연직 고도 zeff인 한 지점에서의 플럭스 발자국 함수 f(x, y, zeff)는 다음과 같이 주어진다(van Ulden, 1978; Horst and Weil, 1992):
| (11) |
여기서 Dy(x, y)는 측면(crosswind) 방향의 분산을 나타내는 함수로 가우시안 분포를 따르는 것으로 가정하며(Pasquill, 1974), fy(x, zeff)는 측면 방향으로 적분된 발자국 함수로 Hsieh et al. (2000)에 의해 제시된 함수를 이용한다.
3. 측정 및 분석 방법
3.1 측정 장소 및 장비 구성
측정을 수행한 지역은 충청남도 공주로, 인구 약 11.7만 명의 소규모 도시이며, 금강을 기준으로 남쪽으로 구 시가지가 자리하고 있고 북쪽 지역으로 새롭게 지어지는 건물들이 주로 위치한다(Fig. 1a). 도시지역은 대부분 2~3층 내외의 저층 주거 건물들로 구성되어 있으며, 시가화 지역 내의 식생은 5~10% 정도 차지한다. LAS의 설치 장소는 공주대학교 주변 지역으로, 송신부와 수신부는 공주대학교 옥룡캠퍼스 건물 옥상(해발 49 m)과 신관동 중앙도서관 옥상(해발 48 m)에 각각 설치하였다(Fig. 1a). 측정 광학 경로 거리는 2.1 km이며, LAS 유효 고도(zeff)는 26.1 m이다(Fig. 1c). LAS 광학 경로 내에 주거지역, 나대지, 식생 지역, 수역이 함께 포함되어 있어 지표면의 비균질성이 높은 특징을 가진다.
측정을 위해 설치한 LAS 장비는 Kipp & Zonen 사에서 제작된 LAS MkII 모델로, 송신부/수신부의 구경은 0.149 m이며 850 nm의 적외선 파장을 이용한다. 설치한 LAS를 이용하여 1 Hz 간격으로 Cn2을 측정하고, 매 15초 간격의 평균값을 저장하였다. 현열속(QH) 계산을 위해 필요한 기온, 풍속, 기압은 LAS 수신부가 설치된 건물 옥상에서 추가적으로 설치한 기상 센서를 이용하여 동일한 자료 저장 간격으로 수집하였다. 또한 LAS 수신부로부터 약 320 m 북쪽에 설치된 기상 타워에서 순복사계(Kipp & Zonen CNR4)를 이용하여 상/하향 장파 및 단파 복사를 동시에 측정하였다. 측정 기간은 2013년 11월에서 12월 사이의 29일간으로, 강수나 안개의 영향으로 측정 자료의 신뢰성이 낮은 날들을 제거한 후 14일간의 자료를 분석 대상으로 하였다.
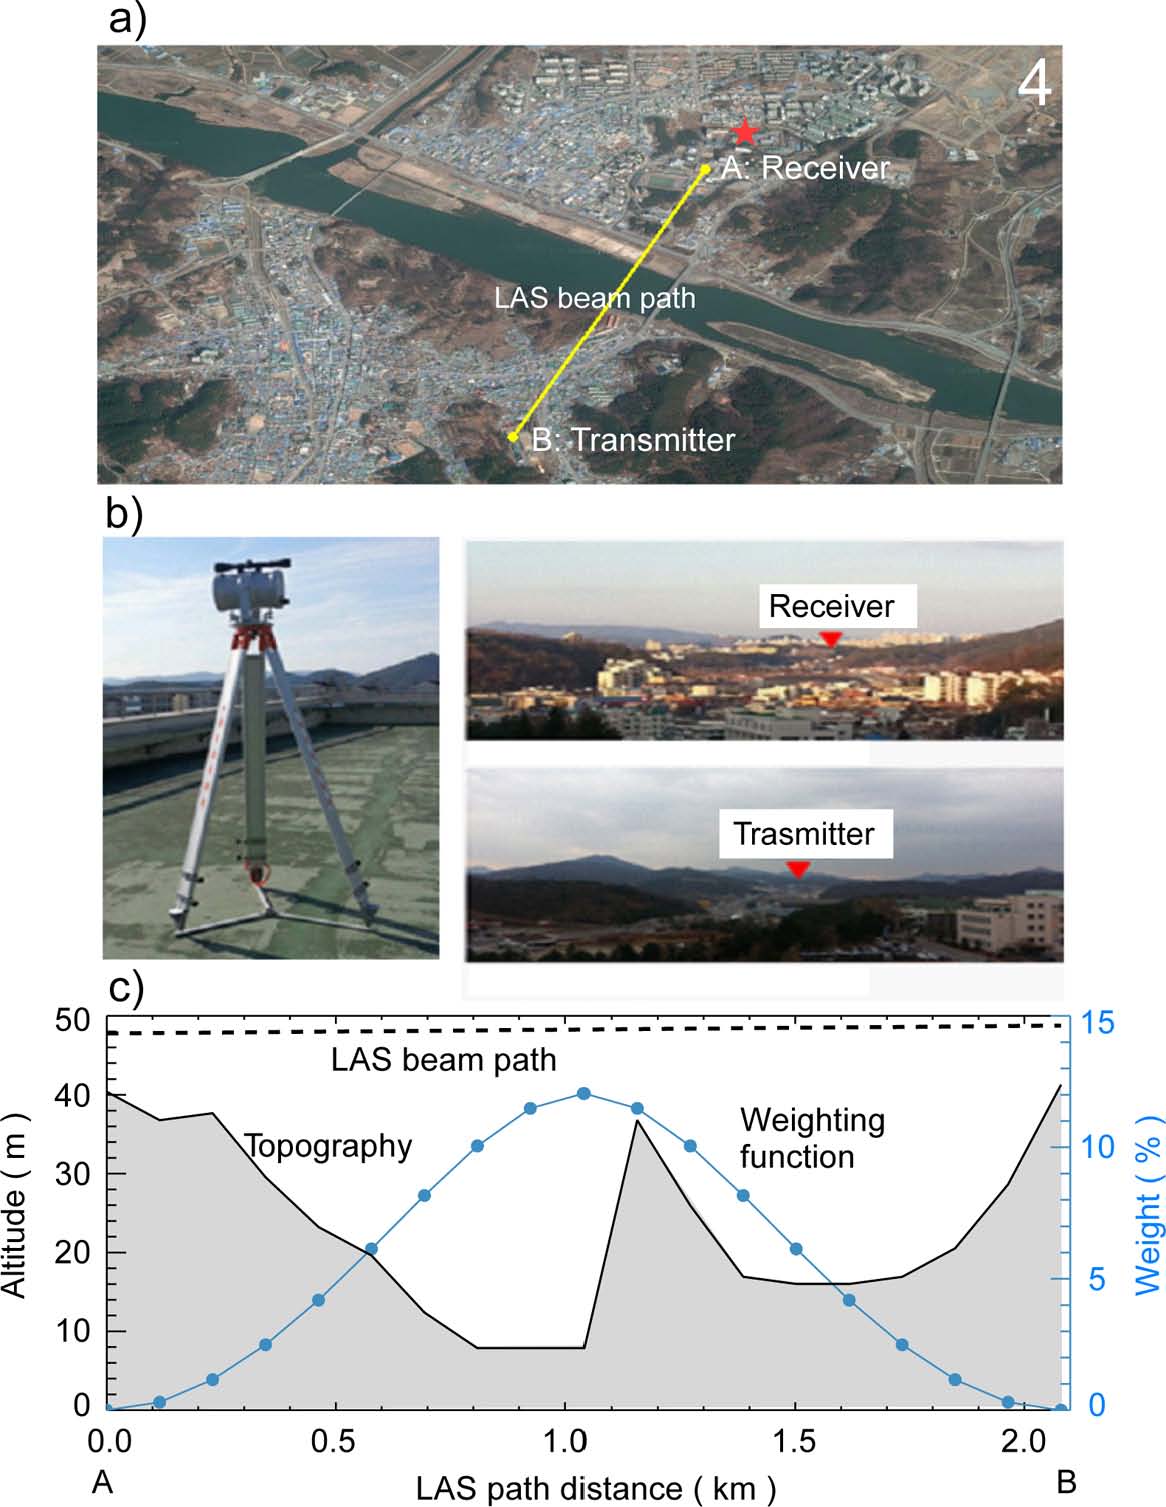
(a) Aerial map of a large aperture scintillometer optical beam path and a meteorological mast (star) (Source: Google Maps). The LAS beam path is 2.1 km long. (b) LAS MkII scintillometer deployed in this study (left) and scenes from transmitter (upper right) and receiver (lower right). (c) Topography (shaded) and weighting function (solid line with circles) along the LAS beam path (Modified from Lee et al. (2015)).
3.2 자료 품질 검사 및 입력 변수 결정
LAS로 측정된 ‘섬광’ 자료는 강수와 안개로 인해 측정 신뢰도가 낮은 날들을 제거하는 과정을 거쳤으며, 이 외에 2단계의 추가적인 품질 검사 과정을 거쳤다. 먼저, 측정된 Cn2값의 포화 기준(saturation criterion) 만족 여부를 조사하였다. Kleissl et al. (2010)에 제시된 기준을 따라 계산된 포화 임계값은 Cn2=4.06 × 10⁻¹⁴ m-2이며, 임계값보다 큰 값들은 분석에서 제거하였다. 두 번째로, 국지적으로 큰 편차를 보이는 값(‘스파이크’)들은 10분 간격의 평균값과 표준편차(σ)를 계산한 다음, 평균값에서 ± 2.5σ 범위를 벗어나는 값으로 정의하여 분석에서 제외하였다.
LAS 방법의 적용에 필요한 입력 변수인 보웬비는 초기 β =1로 설정하였으며, 지표면 거칠기 길이(z0)와 영면 변위 높이(d)는 z0 ≈ 0.1h와 d ≈ 0.7h의 관계식 (Garratt, 1992; Grimmond and Oke, 1999)을 적용하여 각각 z0 = 0.3m와 d =2m로 설정하였다. 일반적으로 지표면의 공기 역학적 매개변수들은 지표면 장애물들의 수평/수직적 배치 상태로 매개화하는 형태적 방법(morphological method) (Raupach, 1994; McDonald et al., 1998)이나 지표층 상사 이론에 근거하여 EC 관측으로 계산하는 방법(Grimmond and Oke, 1999; Roth, 2000)을 이용하여 계산될 수도 있다. 이들 방법은 균질 지표면에 대해서는 잘 적용될 수 있지만, 비균질 지표면에 대해서는 이들 변수의 산정에 내재적 한계가 있으며, 이는 필연적으로 현열속 산정의 오차 원인이 된다. 본 연구에서는 이들 입력변수의 불확실성에 기인한 LAS 현열속 산정 오차를 정량적으로 분석하기 위해 추가적으로 민감도 분석을 수행하였다.
3.3 대기 안정도 결정
섬광계는 대기 난류에 기인한 대기 굴절률의 섭동을 측정함으로써 지표층 난류속을 산정할 수 있는 측정값을 제공하지만, 대기 안정도를 판별하지 못하는 단점을 지닌다. 따라서 섬광 기법을 통해 지표층 난류속의 일변화를 계산하기 위해서는 독립된 방법을 통해 대기 안정도를 구분하여 함께 활용하여야 한다. Samain et al. (2012)은 섬광 기법에 적용할 수 있는 5가지 대기 안정도 판별 방안을 제시하였다: 1) 순복사속(Rnet)의 임계값을 이용하는 방법, 2) 지방시(local time)를 기준으로 구분하는 방법, 3) EC 측정 자료를 이용하는 방법, 4) 연직 온도 경도로 판별하는 방법, 5) Cn2의 일변화 패턴을 활용하는 방법. 이 중 5번째 방법은 측정 Cn2의 일변화 그래프에서 국지 극소값을 나타내는 시각을 기준으로 안정/불안정 시간대를 판별하는 방법으로, 섬광계의 측정 자료를 이용하는 장점이 있고 대체로 좋은 결과를 보여줄 수 있다고 보고하였다. 본 연구에서는 Rnet의 임계값을 이용하는 방법(방법 1)과 Cn2의 극소값으로 판별하는 방법(방법 5)을 동시에 적용하여 불안정 대기 조건을 만족하는 하루 중 시간대를 구분하였다. 이를 위해 본 연구에서는 Rnet의 임계값으로 25W m-2를 적용하였으며, 50W m-2를 사용하였을 때에도 결과에 큰 차이를 보이지 않았다.
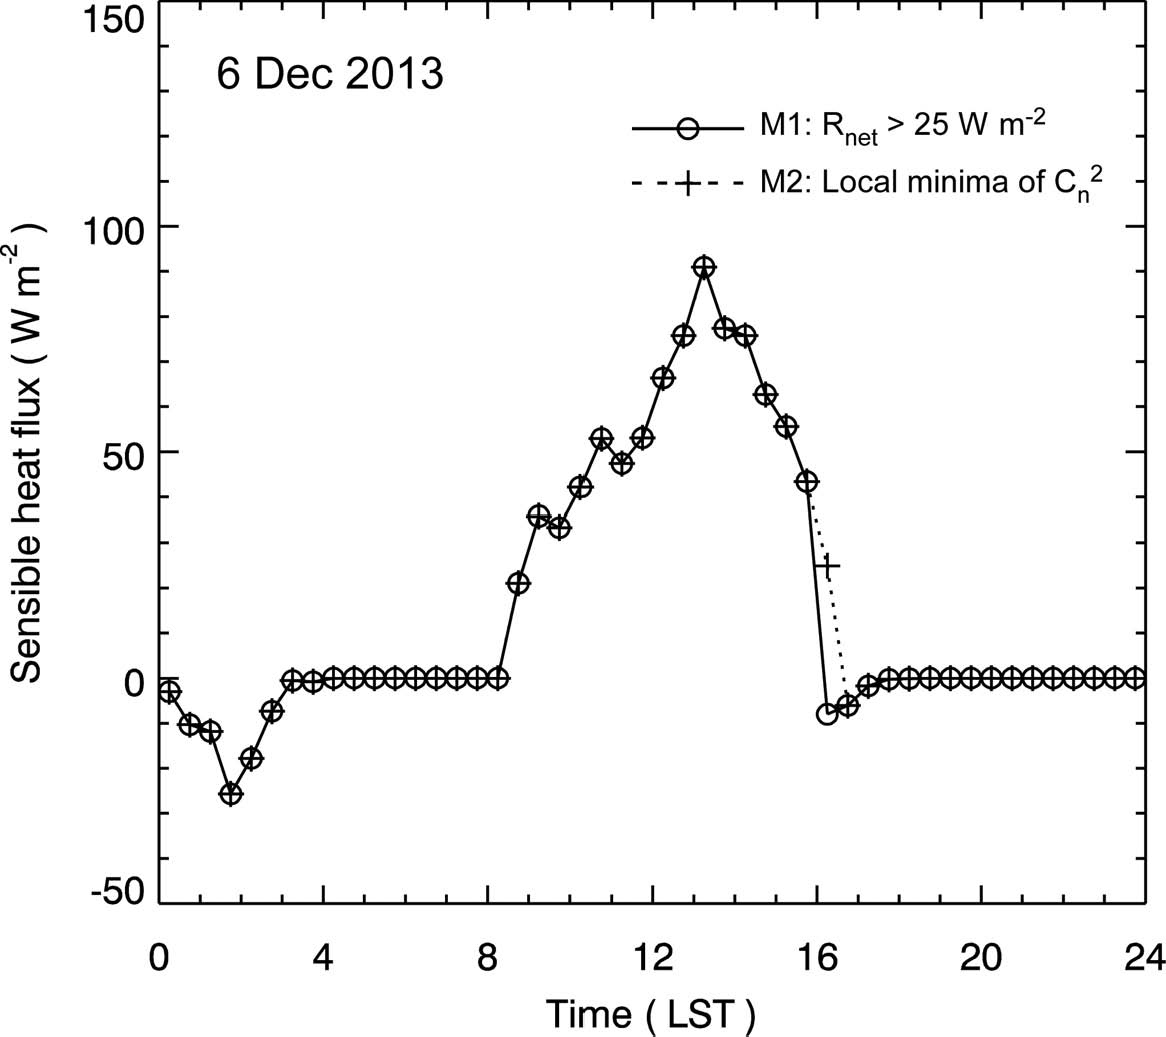
Comparison of diurnal variations of the LAS-derived sensible heat fluxes for 6th December 2013 using different atmospheric stability criterion methods. M1 and M2 indicate the methods using net radiation (Rn; solid line) and scintillation profile (Cn2; dotted line), in which an unstable atmospheric period of a day is defined by Rn > 25W m-2 and daytime period between two local minima in Cn2, respectively.
Figure 2는 위에 제시한 두 가지 대기 안정도 판별방법을 각각 적용하여 산정한 LAS 현열속의 일변화를 예시로 보여준다. 2013년 12월 6일의 경우, 오전(안정→불안정) 전이 시간대는 두 방법에서 동일하게 0900 LST로 나타나며, 오후(불안정→안정) 전이 시간대는 1600 LST 부근에서 두 방법 사이에 30분의 차이를 보이고 있다. 다른 분석일들에서도 1시간 이내의 차이를 보여, 대기 안정도 판별 방안의 선택이 결과에 미치는 영향은 크지 않은 것으로 분석할 수 있다. 본 연구에서는 두 방법이 모두 불안정 대기 조건으로 판정한 주간 시간대를 불안정 구간으로 정의하고, LAS로부터 측정된 자료로부터 불안정 대류 경계층에서의 지표층 현열속을 산정/분석하였다.
제시한 안정도 판별 조건은 하루 중 주간 불안정 구간 이외의 시간은 안정 대기 상태로 가정하게 되지만, 실제 측정 지역의 미기상학적 특성을 고려하여 판단하여야 한다. 일반적으로 도시 지역의 경우 주/야간에 상관없이 하층 대기는 중립 내지 불안정 대기 상태를 유지하는 경우가 종종 있으며, 또한 겨울철 차가운 대기가 상대적으로 따뜻한 지표면 위로 이류할 경우에도 역시 불안정 성층화가 유지될 수 있다. 따라서 도시 지표면이나 비균질 지표면에서 섬광 기법을 적용할 경우 안정 대기 조건에 대한 판별은 신중하게 검토/적용되어야 할 것으로 판단된다. 본 연구에서 측정을 수행한 지역은 비균질 도시 지표면으로, 위에서 제시한 안정도 판별 조건을 통해 안정 대기 상태의 판단이 어려워 분석에서 배제하였다.
4. 결 과
4.1 LAS 현열속 발자국 분석
Figure 3은 불안정 대기 경계층에서의 LAS 누적 영향 영역의 풍향별 계산 결과를 보여준다. 식(10)에 따라 LAS 광학 경로를 210등분(10 m 간격)한 후, 각 지점에서 계산된 플럭스 발자국과 LAS 가중 함수의 가중 적분으로 계산하였다. 풍속은 5 m s-1, 마찰 속도는 0.5 m s-1, 그리고 오브코프 길이 규모는 -50 m인 불안정 대류 경계층을 가정하였다. 계산된 LAS 현열 속의 영향 영역의 공간 분포는 가중 함수의 형태와 밀접하게 연관되어 있으며, 측정 광학 경로의 중앙 부분에 위치한 지표면에 의한 영향이 크게 나타나며 가장자리로 갈수록 낮아지는 것을 알 수 있다. 또한 주어진 기상 조건에서 현열속의 영향 영역이 가지는 공간적 범위(95%)는 풍향에 따라 크게 달라진다. 측정지역에서 동풍과 서풍 계열의 바람이 불 경우(Figs. 3b, d), 즉 측정 광학 경로와 풍향이 수직에 가까운 경우, 약 1.2 km 풍하측까지 영향 영역이 넓게 나타나며, 반면 북풍과 남풍 계열의 바람이 불 경우(Figs. 3a, c), 즉 측정 광학 경로와 풍향이 대체로 나란한 경우, 영향 영역은 측정 광학 경로로부터 수백 m이내로 나타난다. 이는 LAS를 통해 산정된 현열속이 미규모-α에 해당하는 공간 규모를 대표함을 의미한다.
측정 광학 경로는 금강을 가로지르고 있으며, 광학경로의 동쪽으로 산림 및 녹지 지역이, 남서쪽에는 구시가지, 그리고 북서쪽으로 신 시가지가 위치하고 있다. 결과적으로 LAS 산정 현열속은 모든 풍향 조건에서 도심 지역, 수역, 그리고 자연 녹지 지역의 영향이 혼재되어 측정됨을 알 수 있으며, 이들 영향 영역의 상대적 기여도는 기상 조건, 특히 풍향에 따라 크게 달라짐을 알 수 있다.
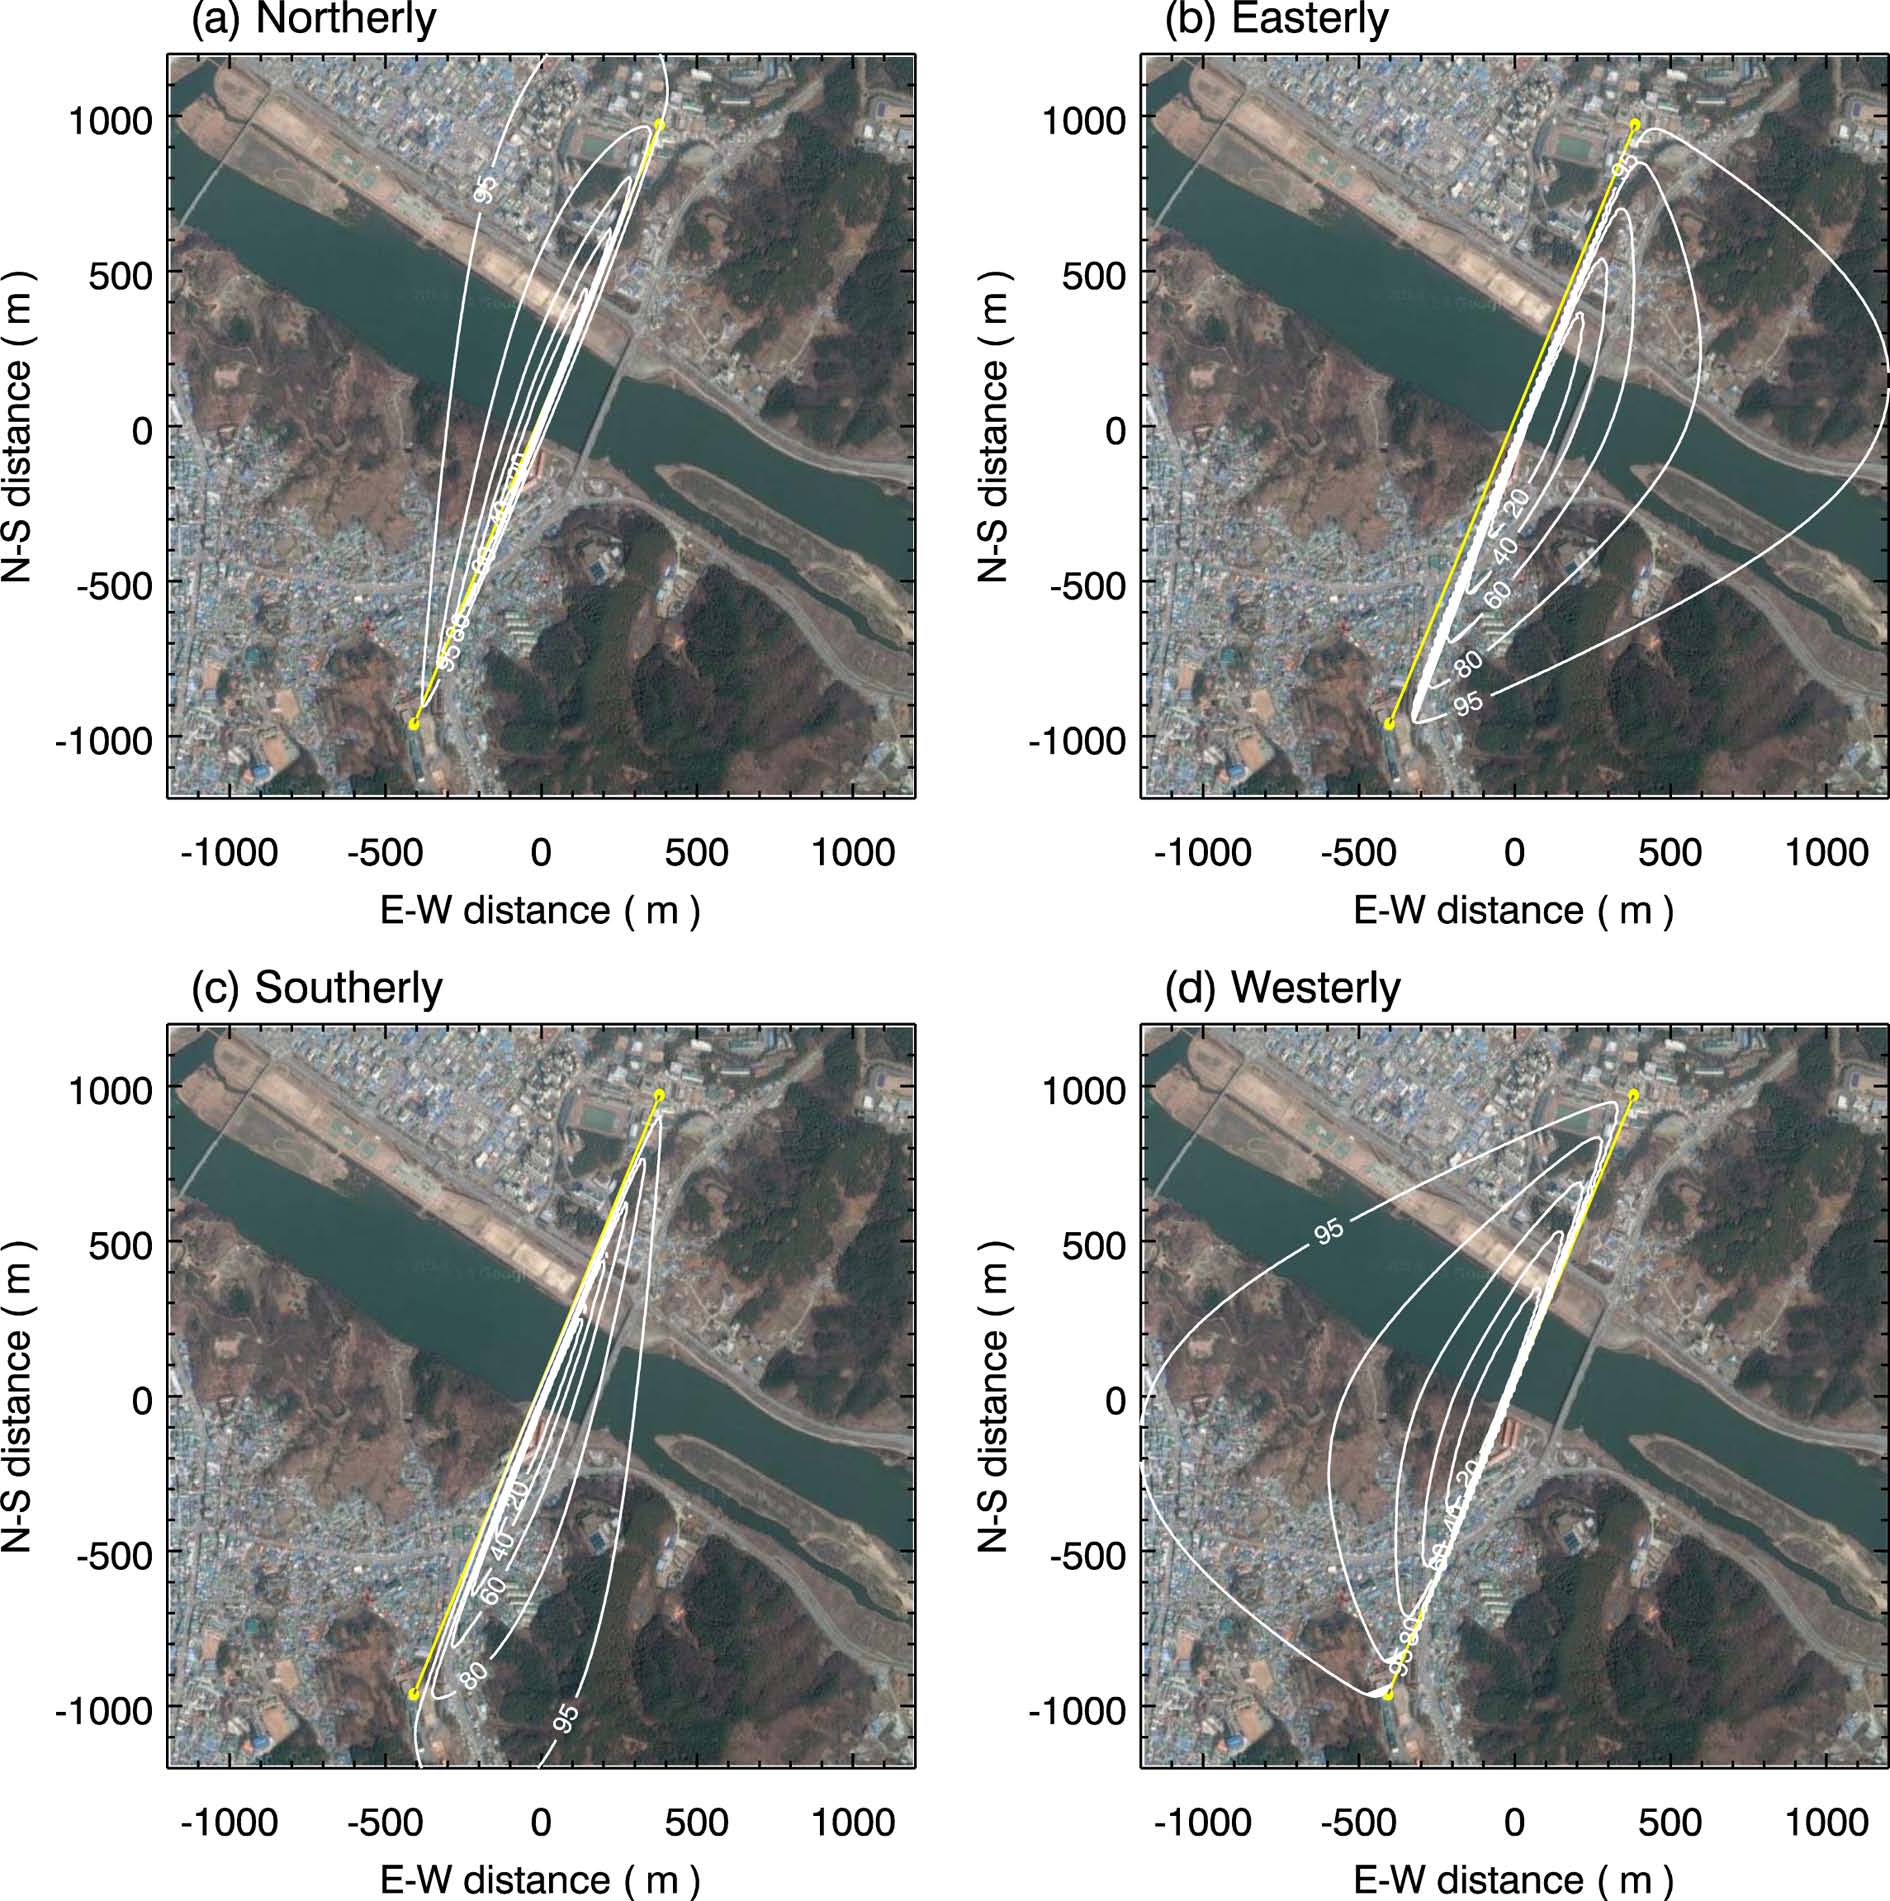
The 3-dimensional LAS cumulative source area (U = 5 m s-1, u* = 0.5m s-1, L = -50 m) for specific wind direction overlaid on an aerial photograph of the site (Source: Google Maps). Contour lines (20, 40, 60, 80, and 95%) represent cumulative source attribution of the LAS-derived sensible heat fluxes in percentage.
4.2 LAS 산정 지표층 현열속 분석
섬광계에서 측정된 Cn2과 기온과 기압을 이용하여 Cn2를 계산한 후 식(3)~(6)을 이용하면 지표층 현열속을 산정할 수 있다. Figure 4는 2013년 11월 7일과 13일 양일간 이들 측정 자료로부터 계산된 30분 평균 지표층 난류 현열속의 시계열을 나타내며, 세 가지의 다른 온도 구조 함수의 상사 관계식에 따라 계산된 LAS 현열속과 기상 타워에서 측정된 순복사속을 함께 나타내고 있다. 11월 7일과 13일의 주간 시간에는 대체로 맑은 날씨로, 측정된 Rnet의 일 최대값은 약 400W m-2을 보였다. 본 연구에서 적용한 대기 안정도 판별 조건에 따라 추정된 불안정 대기 구간은 0900~1630 LST로 나타나며, 분석 대상 14일 모두 이 시간 범위 내에서 불안정 영역이 결정되었다. Andreas(1988)에 의해 제안된 상사 관계식을 사용하여 산정한 QH 결과를 보면, 11월 7일에 30~160W m-2, 11월 13일에 30~100W m-2의 값을 보이며 낮시간 동안 뚜렷한 일변화 경향을 보여준다. 다소 유사한 크기의 Rnet에도 11월 13일의 QH가 상대적으로 낮은 이유는 13일의 풍속이 1 m s-1 내외로 7일의 풍속 3~5 m s-1이 비해 약했던 것에 크게 기인한 것으로 보인다. De Bruin et al. (1993)에 의해 제안된 상사 관계식을 사용하여 산정한 QH는 Andreas (1988)의 결과보다 약 12~21% 높게 나타나며, 반면 Thiermann and Grassl (1992)에 의해 제안된 식으로 산정한 QH는 2~13% 낮게 나타난다. 이러한 온도 구조 함수의 상사 관계식에 대한 민감도 결과는 기존 연구들에서도 유사하게 얻어졌다(e.g., Lagouarde et al., 2006; Liu et al., 2011; Lee et al., 2015). 특히, Lagouarde et al. (2006)는 프랑스 마르세유 지역의 비교적 균질한 도시 지표에서 EC 방법과 LAS 방법을 통해 얻어진 QH을 비교한 결과, 낮시간 EC 측정값은 Andreas (1988)에 의한 LAS QH보다 크고 De Bruin et al. (1993)를 이용한 QH보다 작은 값을 보였다.
Figure 5는 전체 분석 기간 동안의 섬광 기법으로 산정한 지표층 현열속과 순복사속과의 관계를 보여주고 있다. 대체로 맑은 날씨를 보였던 11월 7일, 10일, 11일에는 QH/Rnet이 높게 나타나며, 반면 날씨가 흐렸던 11월 6일과 12월 8일은 상대적으로 낮은 값을 보여준다. 기상 조건에 따라 대류 경계층 내에서의 QH/Rnet는 차이를 보이고 있으며, 두 지표 에너지 수지 플럭스 사이에는 0.7 이상의 높은 선형 상관 관계를 보인다. 이는 측정 기간 중 강수일이 포함되어 있어 기상 조건에 따라 비균질 지표층에서 보웬비의 변화가 있었음을 의미하며, LAS를 통해 이러한 현열속의 변화를 추정할 수 있음을 의미한다.
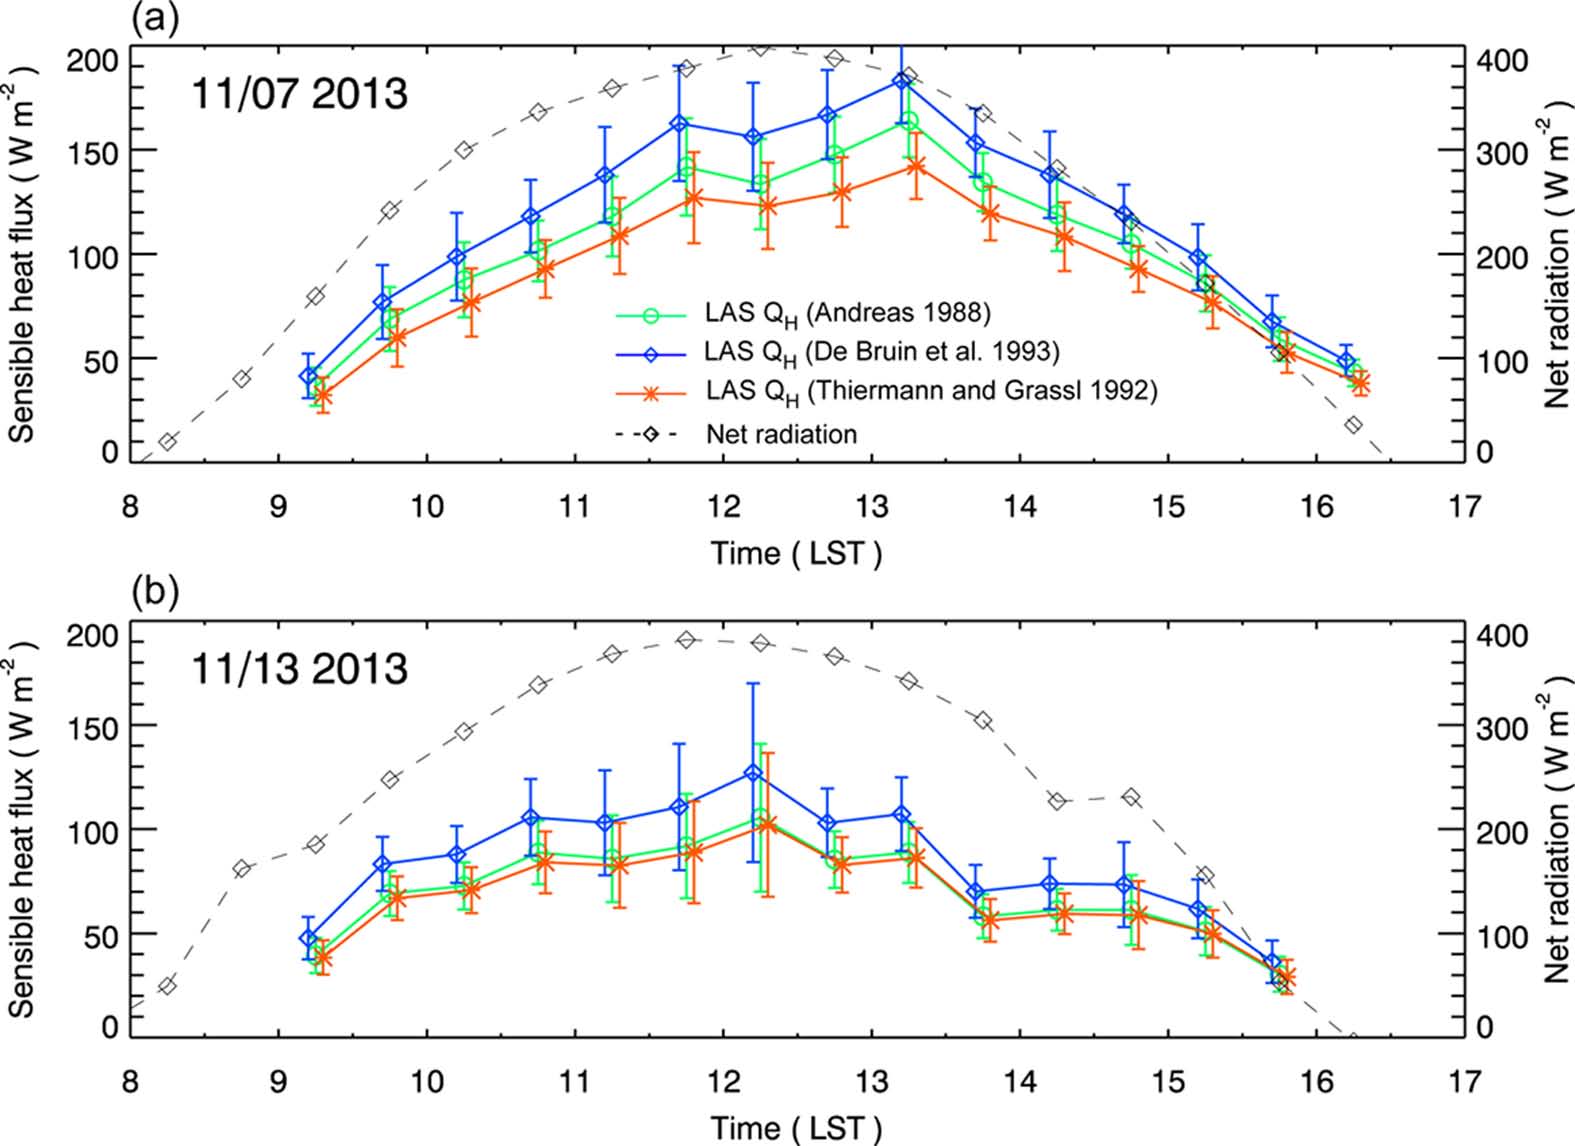
Daytime LAS-derived sensible heat fluxes over the heterogeneous urban region on (a) 7 November and (b) 13 November 2013. The LAS-derived sensible heat fluxes using different surface-layer similarity functions for temperature structure function by Andreas (1988), De Bruin et al. (1993), and Thiermann and Grassl (1992) are compared, and net radiation measured from a meteorological mast is overlaid on each day. Vertical bars denote standard deviation values at every 30-min intervals, which can be interpreted by short-time fluctuation of the turbulent flux in a physical sense.
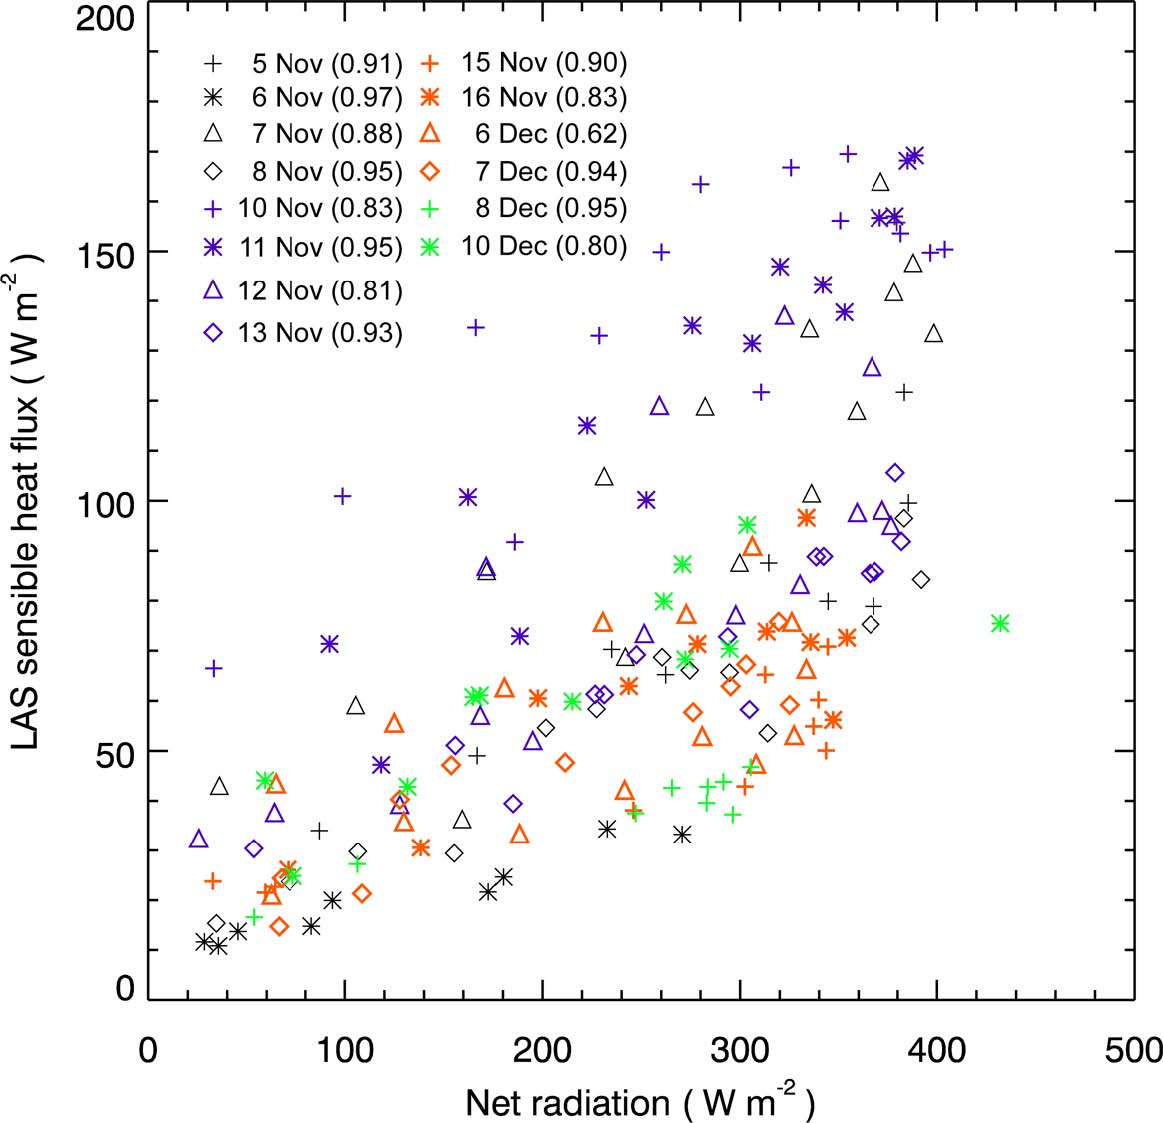
Comparison of LAS-derived sensible heat fluxes (QH) to measured net radiation (Rnet) for 14 days. The number in parenthesis indicates a linear Pearson correlation coefficient between QH and Rnet on each day.
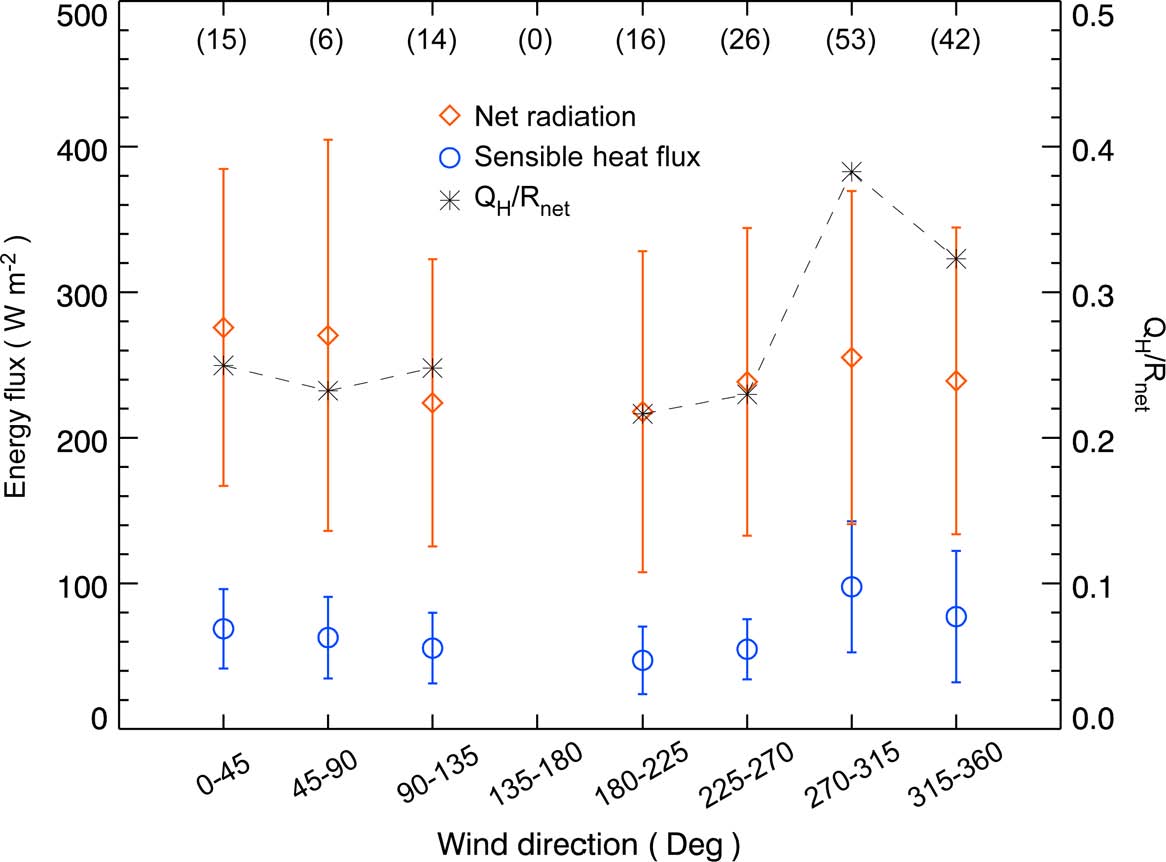
Comparison of daytime sensible heat fluxes (QH), net radiation (Rnet) and their ratio (QH/Rnet) as a function of wind direction for 14 days. The QH/Rnet ratio is calculated by a ratio of their mean values. Vertical bars denote standard deviation values of data in each wind direction class. The figure in parenthesis indicates the data number for each wind direction class.

Sensitivity test results by different non-dimensional similarity function for temperature structure function parameter, Bowen ratio, surface roughness length, LAS effective height, air temperature, and wind speed. The quantity indicates a daytime sensible heat flux averaged for 14 days. Mean, maximum, and minimum values are found on daytime mean sensible heat fluxes of the 14 days. The base estimation was conducted using the Andreas function with Bowen ratio of 1, roughness length of 0.3 m, and LAS effective height of 26.1 m.
측정 지역은 지면 피복의 비균질성이 매우 높은 지역으로, LAS 산정 현열속은 측정 광학 경로를 중심으로 풍향에 따라 영향 영역의 기여도가 다르므로 (Fig. 3) 이에 의해서도 영역 평균된 현열속의 규모가 달라질 수 있다. Figure 6은 분석 기간 동안 풍향에 따른 지표층 현열속, 순복사속, 그리고 현열속과 순복사속의 비를 나타낸다. LAS를 통해 산정한 측정 지역의 QH는 북서풍 계열(270o~360o)의 바람이 부는 경우(평균 77~98W m-2)에 그 외 풍향일 경우(평균 47~69W m-2)에 비해 높게 나타난다. QH/Rnet도 북서풍 영향을 받는 조건에서 0.38과 0.32로 상대적으로 높고, 그 외 풍향의 경우 0.22~0.25로 낮은 값을 나타낸다. 이는 측정 지역에서 북서풍의 영향을 받는 경우, 신 시가지와 금강의 높은 현열속이 LAS가 산정하는 영역 평균 현열속에 높은 기여도를 보인 결과로 판단된다(Fig. 3). Kahng et al. (2013)는 낙동강 유역의 농경지와 공단 지역에서 EC 방법으로 측정한 지표 에너지 수지 분석을 통해 두 지점에서 연평균 QH/Rnet는 각각 0.224와 0.386의 값을 가짐을 보고하였는데, 이는 공주 지역의 결과와도 정량적으로 유사하다. 또한 세계 주요 도시 지역들에서 측정된 겨울철 QH/Rnet는 다양한 도시 지표 특성 및 기후 조건에 따라 0.25~0.56의 값의 범위를 보여주고 있으며, 본 연구에서 제시한 값과 정성적 비교가 가능하다(e.g., Moriwaki et al., 2004; Bergeron and Strachan, 2012; Ward et al., 2013).
4.3 민감도 분석
LAS 방법을 통해 산정한 대류 경계층 내의 지표층 현열속은 다양한 요소에 의해 오차를 가질 수 있으므로, 본 연구에서는 산정한 현열속의 불확실도를 정량적으로 분석하기 위해 민감도 분석을 수행하였다. 민감도 분석은 온도 구조 함수의 상사 관계식, 보웬비, 지표 입력 변수인 거칠기 길이와 LAS 유효 높이, 그리고 기상 요소인 기온과 풍속에 대해 각각 수행하였다. 먼저, 온도 구조 함수에 대한 상사 관계식은 앞서 제시하였듯이 주로 많이 사용되는 Andreas (1988), De Bruin et al. (1993), 그리고 Thiermann and Grassl (1992)를 채택하였다. 보웬비는 측정 지역이 수역, 녹지, 도시 지역이 혼재되어 있는 특징을 반영하여, 습윤 지표에 상응하는 값으로 β = 0.2에서부터 도시 등 건조 지역에 대응되는 β = 2.0까지 넓은 영역으로 설정하였다. 지표 입력 변수들도 정확한 추정이 어려운 변수들로 가능한 넓은 범위의 불확실성을 반영하였으며(z0 = 0.1~0.6 m; zeff = 24.1~28.1 m), 기상 변수인 기온과 풍속은 관측 오차를 ± 10%로 가정하여 분석하였다.
Table 1은 14일 평균된 LAS 산정 현열속과 기준 산정값에 대한 상대적 차이를 보여준다. 온도 구조 함수에 대한 상사 관계식의 영향은 Fig. 4에서 보여준 것처럼 De Bruin et al. (1993)의 식을 이용할 경우 기준 산정값에 비해 평균 +17.5% 크게 산정되며, Thiermann and Grassl (1992)를 이용할 경우 -6.8% 감소하는 것으로 나타난다. β = 0.2에서 현열속은 14.4% 감소하고, β = 2.0에서 2.1% 증가하여, 낮은 보웬비를 가지는 경우에 산정된 현열속의 차이는 크게 나타난다. z0= 0.1m로 감소시키는 경우 현열속은 평균 3.7% 감소하며, 반대로 z0= 0.6m로 증가되면 현열속은 평균 4.0%로 약간 증가한다. zeff를 기준값(26.1 m)보다 2 m 감소시킬 경우 현열속은 약 7% 감소하고, 2 m 증가시킬 경우 약 7% 증가한다. 기상 입력 변수인 기온의 ± 10% 변화는 ± 0.8%의 현열속 변화로, 풍속의 ± 10% 변화는 평균 2% 이내의 변화로 나타나, 낮은 민감도를 보인다.
요약하면, LAS를 이용한 현열속 산정에 있어 온도 구조 함수의 상사 관계식의 선정이 다소 큰 오차를 발생시킬 수 있으며, 기상 요소인 기온과 풍속이 중요한 요소이지만 이 변수들의 예상 가능한 범위의 관측 오차는 현열속 산정에 큰 영향을 주지 않음을 알 수 있다. 또한 잠열속이 현열속에 비해 현저히 우세한 경우(β << 1) 다소 큰 오차를 발생시킬 수 있는 요인이 될 수 있음을 보여주고 있으며, 기상 조건과 지표면 특성에 따라 보웬비의 변화가 큰 지역에서 측정이 이루어질 경우에는 현열속 계산 과정에서 정량적 보정이 필요함을 시사한다.
5. 요약 및 결론
수 km의 공간 규모에서 볼 때 지구 지표면은 다양한 지면 피복이 혼재하는 비균질 지표면이 많은 부분을 차지하며, 특히 도시 지역의 경우 지면 피복 및 건물 형태학적 비균질성이 매우 높다. 본 연구에서는 LAS를 이용하여 비균질 도시 지표면에서의 대류 경계층 내의 지표층 난류 현열속을 산정하기 위해, 2.1 km의 광학 경로 거리를 두고 도시 지역, 산림 지역, 수역 등이 존재하는 비균질 지표면을 선정하고, 2010년 11월과 12월 동안 ‘섬광’ 측정을 수행하였다. LAS 측정 자료를 이용한 난류속 산정 이론에 따라 불안정 대기 경계층에서의 지표층 현열속을 산정하였으며, 3차원 LAS 발자국 분석을 통해 LAS 현열속의 영향 영역의 기여도 분석을 수행하였다.
LAS 발자국 분석 결과, 영향 영역은 LAS의 측정 광학 경로와 풍향이 이루는 각에 따라 크게 다르게 나타날 수 있음을 보였으며, 2.1 km의 광학 경로 거리를 두고 측정한 자료로 산정한 현열속의 공간 규모는 약 1 km2 내외의 미규모-α에 해당하였다. 분석 기간 동안 측정 지역의 현열속은 기상 조건에 따라 약 50~150W m-2로 나타났으며, QH/Rnet는 0.22~0.38로 계산되었다. 측정 지역에서 상대적으로 높은 QH와 QH/Rnet는 북서풍 계열의 바람이 불 때 나타났으며, 영향 영역의 기여도를 볼 때 신 시가지와 금강의 현열속 기여율이 다른 지표에 비해 높게 나타나는 것으로 분석할 수 있다.
LAS 방법으로 산정한 현열속의 오차를 정량적으로 분석하기 위해 온도 구조 함수의 상사 관계식, 보웬비, 지표 거칠기 길이와 LAS 유효 높이, 기온과 풍속에 대해 민감도 분석을 수행하였다. 온도 구조 함수에 대한 지표층 상사 관계식의 선택에 따라 최대 20%의 차이를 보였으며, 지표면 특성 변수와 기상 변수의 불확실성에 의한 오차는 10% 이내로 낮게 나타났다. 보웬비에 대한 민감도는 잠열속이 우세한 조건을 가정할 경우 최대 15%의 차이가 났으며, 건조한 지표 조건에서는 큰 오차가 발생하지 않았다.
비균질 도시 지표면의 정확한 현열속 산정은 대기 경계층의 구조에 대한 이해와 중규모 대기 모형의 검증을 위해 중요한 요소이다. EC 방법은 비균질 지표면에서의 대기 흐름의 복잡성에서 기인하는 내재적 한계로 적용이 쉽지 않다(Meijninger et al., 2002). 본 연구에서는 지표면의 비균질성이 매우 높은 도시 지역에서 LAS 방법을 통해 불안정 대기 경계층 내의 지표층 현열속을 정량적으로 산정할 수 있음을 보였다. 또한, 비균질 도시 지표면에 LAS 방법을 적용할 경우 기존의 연구 방법에서 제시된 대기 안정도 판별방법을 통해서 안정(stable) 대기 조건을 판별하는 데는 한계가 있을 수 있음을 지적하였다. 마지막으로, 산출된 현열속은 중규모 기상 모형이나 위성 자료로 추정한 난류속의 검증에도 유용하게 활용할 수 있을 것으로 판단된다.
Acknowledgments
논문에 대해 세심한 제언을 주신 두 분의 심사위원님과 섬광계 측정 자료의 활용을 허락해주신 공주대학교 이준호 교수님께 깊이 감사드립니다. 이 연구는 공주대학교 신임교수 정착연구비 지원으로 수행되었습니다.
REFERENCES
-
Andreas, E. L., (1988), Atmospheric stability from scintillation measurements, Appl. Opt., 27, p2241-2246.
[https://doi.org/10.1364/AO.27.002241]

-
Bastiaanssen, W. G. M., M. Menenti, R. A. Feddes, and A. A. M. Holtslag, (1998), A remote sensing energy balance algorithm for land, SEBAL: 1. Formulation., J. Hydrol., 212-213, 198-212.
[https://doi.org/10.1016/S0022-1694(98)00253-4]

-
Bergeron, O., and I. B. Strachan, (2012), Wintertime radiation and energy budget along an urbanization gradient in Montreal, Canada, Int. J. Climatol., 32, p137-152.
[https://doi.org/10.1002/joc.2246]

-
Beyrich, F., H. A. R. De Bruin, W. M. L. Meijninger, and Schipper F., (2002), Experiences from one-year continuous operation of a large aperture scintillometrer over a heterogeneous land surface, Bound.-Layer Meteor., 105, p85-97.
[https://doi.org/10.1023/A:1019640014027]

-
Chehbouni, A., and Coauthors, (2000), Estimation of heat and momentum fluxes over complex terrain using a large aperture scintillometer, Agric. Forest Meteor, 105, p215-226.
[https://doi.org/10.1016/S0168-1923(00)00187-8]

-
De Bruin, H. A. R., W. Kohsiek, and B. J. J. M. van den Hurk, (1993), A verification of some methods to determine the fluxes of momentum, sensible heat and water vapour using standard deviation and structure parameter of scalar meteorological quantities, Bound.- Layer Meteor., 63, p231-257.
[https://doi.org/10.1007/BF00710461]

-
De Bruin, H. A. R., W. Kohsiek, B. J. J. M. van den Hurk, and W. Kohsiek, (1995), The scintillation method tested over a dry vineyard area, Bound.-Layer Meteor., 76, p25-40.
[https://doi.org/10.1007/BF00710889]

-
Frehlich, R. G., and G. R. Ochs, (1990), Effects of saturation on the optical scintillometer, Appl. Opt., 29, p548-553.
[https://doi.org/10.1364/AO.29.000548]

- Garratt, J. R., (1992), The atmospheric boundary layer, Cambridge University Press, UK, p316.
-
Geli, H. M. E., M. U. N. Christopher, D. Watts, J. Osterberg, H. A. R. De Bruin, W. Kohsiek, R. T. Pack, and L. E. Hipps, (2012), Scintillometer-based estimates of sensible heat flux using lidar-derived surface roughness, J. Hydrometeor., 13, p1317-1331.
[https://doi.org/10.1175/JHM-D-11-085.1]

-
Grimmond, C. S. B., and T. R. Oke, (1999), Aerodynamic properties of urban areas derived from analysis of surface form, J. Appl. Meteorol., 38, p1262-1292.
[https://doi.org/10.1175/1520-0450(1999)038<1262:APOUAD>2.0.CO;2]

-
Hartogensis, C. J. W., J. C. Rodriguez, and H. A. R. De Bruin, (2003), Derivation of an effective height for scintillometers: La Poza experiment in northwest Mexico, J. Hydrometeor., 4, p915-928.
[https://doi.org/10.1175/1525-7541(2003)004<0915:doaehf>2.0.co;2]

-
Hill, R. J., S. F. Clifford, and R. S. Lawrence, (1980), Refractive-index and absorption fluctuations in the infrared caused by temperature, humidity and pressure fluctuations, J. Opt. Soc. Amer., 70, p1192-1205.
[https://doi.org/10.1364/JOSA.70.001192]

-
Högström, U., (1988), Non-dimensional wind and temperature profiles in the atmospheric surface layer: A re-evaluation, Bound.-Layer Meteor., 42, p55-78.
[https://doi.org/10.1007/BF00119875]

-
Horst, T. W., and J. C. Weil, (1992), Footprint estimation for scalar flux measurements in the atmospheric surface layer, Bound.-Layer Meteor., 59, p279-296.
[https://doi.org/10.1007/BF00119817]

-
Hsieh, C. I., G. Katul, and T. W. Chi, (2000), An approximate analytical model for footprint estimation of scalar fluxes in thermally stratified atmospheric flows, Adv. Water Resour., 23, p765-772.
[https://doi.org/10.1016/S0309-1708(99)00042-1]

-
Kahng, K., H.-J. Koo, J.-Y. Byon, Y.-S. Park, and H.-S. Jung, (2013), Comparison of surface fluxes based on landuse characteristics near Gangjeong-Goryeong weir of the Nakdong river, J. Korean Earth Sci. Soc., 34, p561-574, (in Korean with English abstract).
[https://doi.org/10.5467/JKESS.2013.34.6.561]

-
Kanda, M., R. Moriwaki, M. Roth, and T. Oke, (2002), Area-averaged sensible heat flux and a new method to determine zero-plane displacement length over an urban surface using scintillometry, Bound.-Layer Meteor., 105, p177-193.
[https://doi.org/10.1023/A:1019668424982]

-
Kim, Y.-H., S.-B. Ryoo, J.-J. Baik, I.-S. Park, H.-J. Koo, and J.-C. Nam, (2008), Does the restoration of an inner-city stream in Seoul affect local thermal environment?, Theor. Appl. Climatol., 92, p239-248.
[https://doi.org/10.1007/s00704-007-0319-z]

-
Kleissl, J., O. K. Hartogensis, and J. D. Gomez, (2010), Test of scintillometer saturation correction methods using field experimental data, Bound.-Layer Meteor., 137, p493-507.
[https://doi.org/10.1007/s10546-010-9540-x]

-
Kljun, N., P. Calanca, M. W. Rotach, and H. P. Schmid, (2004), A simple parameterisation for flux footprint predictions, Bound.-Layer Meteor., 112, p503-523.
[https://doi.org/10.1023/B:BOUN.0000030653.71031.96]

-
Lagouarde, J. P., M. Irvine, J. M. Bonnefond, C. S. B. Grimmond, N. Long, T. R. Oke, J. A. Salmond, and B. Offerle, (2006), Monitoring the sensible heat flux over urban areas using large aperture scintillometry: case study of Marseille city during the ESCOMPTE experiment, Bound.-Layer Meteor., 118, p449-476.
[https://doi.org/10.1007/s10546-005-9001-0]

-
Lee, S.-H., J.-H. Lee, and B.-Y. Kim, (2015), Estimation of turbulent sensible heat and momentum fluxes over a heterogeneous urban area using a large aperture scintillometer, Adv. Atmos. Sci., 32, p1092-1105.
[https://doi.org/10.1007/s00376-015-4236-2]

-
Liu, S. M., Z. W. Xu, Z. L. Zhu, Z. Z. Jia, and M. J. Zhu, (2013), Measurements of evapotranspiration from eddy-covariance systems and large aperture scintillometers in the Hai River Basin, China, J. Hydrol., 487, p24-38.
[https://doi.org/10.1016/j.jhydrol.2013.02.025]

-
Liu, S. M., Z. W. Xu, W. Z. Wang, Z. Z. Jia, M. J. Zhu, and J. M. Wang, (2011), A comparison of eddy-covariance and large aperture scintillometer measurements with respect to the energy balance closure problem, Hydrol. Earth Syst. Sci., 15, p1291-1306.
[https://doi.org/10.5194/hess-15-1291-2011]

-
Marx, A., H. Kunstmann, D. Schuttemeyer, and A. F. Moene, (2008), Uncertainty analysis for satellite derived sensible heat fluxes and scintillometer measurements over Savannah environment and comparison to mesoscale meteorological simulation results, Agric. Forest Meteor., 148, p656-667.
[https://doi.org/10.1016/j.agrformet.2007.11.009]

-
McDonald, R. W., R. F. Griffiths, and D. J. Hall, (1998), An improved method for estimation of surface roughness of obstacle arrays, Atmos. Environ., 32, p1857-1864.
[https://doi.org/10.1016/S1352-2310(97)00403-2]

-
Meijninger, W. M. L., O. K. Hartogensis, W. Kohsiek, J. Hoedjes, R. Zuurbier, and H. A. R. De Bruin, (2002), Determination of area averaged sensible heat fluxes with a large aperture scintillometer over a heterogeneous surface-Flevoland field experiment, Bound.- Layer Meteor., 105, p63-83.
[https://doi.org/10.1023/A:1019683616097]

-
Moriwaki, R., and M. Kanda, (2004), Seasonal and diurnal fluxes of radiation, heat, water vapor, and carbon dioxide over a suburban area, J. Appl. Meteorol, 43, p1700-1710.
[https://doi.org/10.1175/JAM2153.1]

-
Offerle, B., C. S. B. Grimmond, K. Fortuniak, and W. Pawlak, (2006), Intraurban differences of surface energy fluxes in a central European city, J. Appl. Meteor. Climatol., 45, p125-136.
[https://doi.org/10.1175/JAM2319.1]

- Panofsky, H. A., and J. A. Dutton, (1984), Atmospheric turbulence: Models and methods for engineering applications, John Wiley and Sons, New York, p397.
- Pasquill, F., (1974), Atmospheric diffusion, 2nd edition, John Wiley & Sons, New York, p437.
-
Raupach, M. R., (1994), Simplified expressions for vegetation roughness length and zero-plane displacement as functions of canopy height and area index, Bound.- Layer Meteor., 71, p211-216.
[https://doi.org/10.1007/BF00709229]

-
Roth, M. W., (2000), Review of atmospheric turbulence over cities, Quart. J. Roy. Meteor. Soc., 126, p941-990.
[https://doi.org/10.1002/qj.49712656409]

-
Samain, B., W. Defloor, and V. Pauwels, (2012), Continuous time series of catchment-averaged sensible heat flux from a large aperture scintillometer: Efficient estimation of stability conditions and importance of fluxes under stable conditions, J. Hydrometeor., 13, p423-442.
[https://doi.org/10.1175/jhm-d-11-030.1]

-
Schmid, H. P., (1994), Source areas for scalars and scalar fluxes, Bound.-Layer Meteor., 67, p293-318.
[https://doi.org/10.1007/BF00713146]

- Tatarskii, V. I., (1961), Wave propagation in a turbulent medium, McGraw-Hill, p285.
-
Thiermann, V., and H. Grassl, (1992), The measurement of turbulent surface layer fluxes by use of bichromatic scintillation, Bound.-Layer Meteor., 58, p367-389.
[https://doi.org/10.1007/BF00120238]

-
van Ulden, A. P., (1978), Simple estimates for vertical diffusion from sources near the ground, Atmos. Environ., 12, p2125-2129.
[https://doi.org/10.1016/0004-6981(78)90167-1]

-
Wang, T. I., G. R. Ochs, and S. F. Clifford, (1978), A saturation- resistant optical scintillometer to measure, J. Opt. Soc. Amer., 69, p334-338.
[https://doi.org/10.1364/JOSA.68.000334]

-
Ward, H. C., J. G. Evans, and C. S. B. Grimmond, (2013), Multi-season eddy covariance observations of energy, water and carbon fluxes over a suburban area in Swindon, UK, Atmos. Chem. Phys., 13, p4645-4666.
[https://doi.org/10.5194/acp-13-4645-2013]

-
Ward, H. C., J. G. Evans, and C. S. B. Grimmond, (2014), Multi-scale sensible heat fluxes in the suburban environment from largeaperture scintillometry and eddy covariance, Bound.- Layer Meteor., 152, p65-89.
[https://doi.org/10.1007/s10546-014-9916-4]

-
Wesely, M. L., (1976), The combined effect of temperature and humidity fluctuations on refractive index, J. Appl. Meteorol., 15, p43-49.
[https://doi.org/10.1175/1520-0450(1976)015<0043:TCEOTA>2.0.CO;2]

-
Wyngaard, J., Y. Izumi, and S. A. Collings, (1971), Behavior of the refractive-index-structure parameter near the ground, J. Opt. Soc. Amer., 61, p1646-1650.
[https://doi.org/10.1364/JOSA.61.001646]

-
Zeweldi, D. A., M. Gebremichael, J. Wang, T. Sammis, J. Kleissl, and D. Miller, (2010), Intercomparison of sensible heat flux from large aperture scintillometer and eddy covariance methods: field experiment over a homogeneous semi-arid region, Bound.-Layer Meteor., 135, p151-159.
[https://doi.org/10.1007/s10546-009-9460-9]
