기상 레이더를 활용한 대류에 의한 난류 강도 및 발생 특성에 대한 연구
Ⓒ 2025 Korean Meteorological Society
Abstract
Convectively Induced Turbulence (CIT) near deep convection often causes in-flight injuries and fatalities for cruising aircraft. To avoid CIT events, we developed and tested the radar-based CIT detection algorithm using the Spectral Width (SW) information in Korea. For providing an objective intensity of CIT, we converted the radar SW data to an Eddy Dissipation Rate (SW-EDR) using the lognormal mapping technique. When compared with in situ EDR measurements observed from the Aircraft Meteorological Data Relay (AMDAR) data, SW-EDR showed a good agreement in identifying locations and intensities of CIT. To further analyze the characteristics of the CIT, two different types of convective systems are selected: a cloud cluster (CC) case on May 30, 2021 and an isolated thunderstorm (IS) case on July 15, 2021. In these cases, intensities and frequencies in CIT are examined separately by lifecycles: initial, mature, and dissipating stages. As a result, each case shows different trends and peak times of the CIT intensity. In CC case, light and moderate intensity of CIT are prevalent in initial stage, while severe intensity is dominant in mature one. In IS case, the light, moderate, and severe intensities of CIT are frequent not only in initial stage but also in dissipating one. This study suggests that the SW-EDR is more useful for detecting objective intensity and location of CIT than sorely using radar reflectivity. In general, it shows a higher risk of strong CIT in upper part of convective systems, which helps providing a better guidance for avoiding CIT.
Keywords:
Convectively induced turbulence, Weather radar spectrum width, Lognormal mapping technique, Eddy dissipation rate1. 서 론
대기에서 발생하는 난류는 항공기 운항에 큰 위험을 주는 위험기상 중 하나로 탑승객의 부상뿐만 아니라 비행 지연, 기체의 손상 및 수명 단축 등 경제적 손실을 유발할 수 있다(Kim and Chun, 2011b; Kim et al., 2018). 날씨에 의한 항공사고 중 난류와 관련 있는 사고의 비율은 65%에 달하고, 매년 천만 달러 이상의 경제적인 손실이 발생한다(Sharman et al., 2006). 특히 동아시아 영역은 난류 발생 빈도 및 강도가 증가하는 추세이므로 항공사고 피해도 잇따라 증가할 것으로 예상된다(Lee et al., 2023).
운항 중인 항공기에 영향을 주는 난류는 크게 제트기류 근처 청천난류(clear Air turbulence; CAT), 산악에 의한 산악파 난류(mountain wave turbulence; MWT) 그리고 대류에 의한 난류(convectively induced turbulence, CIT)로 구분할 수 있다(Sharman et al., 2006, 2012; Kim and Chun, 2010, 2011b; Sharman and Lane, 2016). 특히 CIT는 발달하는 대류운 내부에서 연직속도의 큰 변화로 발생하기도 하고, 구름 밖 비교적 맑은 대기에서 대류운 주변 기류 변형 및 대류운이 유도하는 중력파 파동파괴에 의해 발생하기도 한다(Lane et al., 2003; Kim and Chun, 2012a; Kim et al., 2014; Kim et al., 2021, 2023; Yang et al., 2024).
CAT와 MWT를 유발할 수 있는 요인을 포착하기 위한 여러 수치예보모델 기반 최적의 난류진단지수들이 연구되어 한국형 항공난류 예측시스템(Korea Turbulence Guidance; KTG), Graphical Turbulence Guidance (GTG) 등 현업 예측시스템들은 난류진단지수를 기반으로 CAT와 MWT 예측을 수행하고 있다(Sharman et al., 2006; Kim et al., 2011; Kim and Chun, 2011a, 2012b; Pearson and Sharman, 2017; Kim et al., 2018; Lee and Chun, 2018). 하지만 단시간에 급격히 발달하고 소멸할 수 있는 대류운의 발생은 현업 수치모델로 예측하기 어렵다. 지난 2024년 5월, 런던에서 싱가폴로 가던 항공기가 예기치 못한 CIT를 조우하여 승객 중 1명이 사망하는 사건이 발생하여 전 세계적으로 많은 관심을 받았으며(Gisinger et al., 2024), 기후변화로 인해 CAT, MWT 뿐만 아니라 CIT 발생 강도 및 빈도도 증가할 것으로 예상된다(Kim et al., 2023). 시공간적 고해상도의 관측전략을 갖춘 기상레이더 관측망은 단기간에 발달하는 대류운의 발생 및 발달 파악에 용이하다. 즉, 기상 레이더 관측자료를 활용할 경우 CIT의 객관적이 강도 산출 및 조기 탐지 가능성이 높아지고, 이를 통하여 안전한 항공기 운항에 도움을 줄 수 있을 것으로 기대된다.
현재까지 기상 레이더를 활용하여 난류의 객관적 강도인 에디소산율(eddy dissipation rate; EDR)을 파악하기 위한 여러 연구들이 이루어졌다. Cohn (1995)는 기상레이더로 수신되는 굴절률 정보와 라디오존데로 측정한 온도, 습도 정보를 통해 EDR를 산출하는 방법, 스펙트럼 폭(spectrum width, SW)을 통해 EDR을 산출하는 방법을 제안하였다. Williams et al. (2006)은 기상레이더를 통해 관측되는 반사도, 시선속도, SW를 통해 EDR을 산출하는 알고리즘(NCAR Turbulence Detection Algorithm; NTDA)을 개발하고, 실시간으로 CIT의 분포와 강도를 파악할 수 있는 체계를 연구한 내용을 소개하였다. Sharman and Pearson (2017)은 GTG에 NTDA, 조종사 기상보고(pilot reports; PIREPs), 공항에서 관측한 급변풍 자료 등을 종합하여 CIT 실황예보 체계를 연구하였다. Kim et al. (2021b)는 로그정규맵핑기술(lognormal mapping technique; LMT)을 통해 최초로 SW를 EDR로 변환하고 수치모델과 관측을 통한 CIT 예보가능성에 대해 연구한 바 있다.
본 연구에서는 LMT를 통해 SW로부터 EDR을 산출하고, 여름철 한반도에서 빈번히 발생하는 대류 유형에 속하는 대류계의 CIT 강도 및 발생 특성을 분석하고자 한다. 이를 통해 궁극적으로 안전한 항공기 운항에 기여할 수 있는 정보를 제공하는 것이 본 연구의 목표이다. 2장에서는 연구자료, 3장에서는 연구방법을 설명할 것이다. 4장에서는 연구사례를 소개한 뒤 5장에서는 연구결과에 대해 서술하고 6장에서 요약 및 결론으로 마무리 짓고자 한다.
2. 연구 자료
2.1 기상레이더 관측자료
현재 대한민국 기상청에서 현업 운영 중인 S-밴드 이중편파 기상레이더(이하 기상레이더)는 인천국제공항 기상레이더를 제외하고 총 10대(강릉, 고산, 관악산, 광덕산, 구덕산, 면봉산, 백령도, 성산, 오성산, 진도)가 있으며 5분 간격으로 동시에 9개의 PPI (plan position indicator) 관측을 실시한다(Fig. 1). 2021년 기준 매 관측마다 고도각이 약 -0.2o부터 15o까지 바뀌며 매 고도각마다 안테나가 한 바퀴 회전한다. 관측 반경은 약 240 km이며 분해능은 250 m이다. 관측된 자료 내 비기상 에코는 clutter elimination algorithm for non-precipitation echo of radar data (CLEANER) 기법을 거쳐 제거된다(Oh et al., 2020). 관측을 통해 얻어지는 변수는 SW, 반사도, 차등반사도, 도플러속도, 차등위상차, 비차등위상차 등이 있다. SW는 샘플 부피에서 시선속도 분포의 분산 정도를 나타내는 변수이기 때문에 바람 시어나 난류의 정도를 파악할 수 있다. 현재 기상청에서는 각 기상레이더 관측소별 PPI 관측자료, 체적관측의 각 연직기둥에서 반사도가 가장 높은 부분만 표출한 자료인 연직최대(column-maximum; CMAX) 반사도 자료 등을 제공하고 있다. 본 연구에서는 CMAX 반사도, 반사도, SW 자료 위주로 활용한다. 여기서 CMAX 반사도는 수평으로 2차원 자료이며, 반사도, SW 자료는 연직, 수평으로 3차원 자료이다.
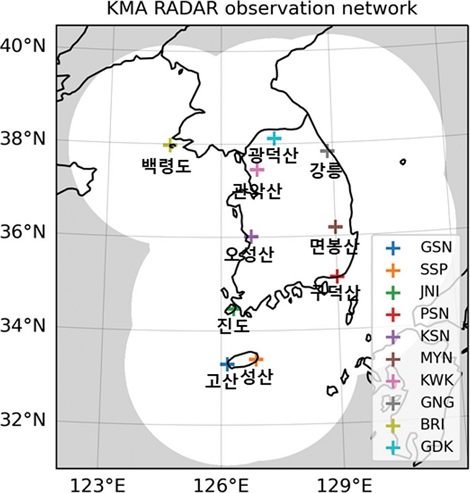
S-band weather radar network of Korea Meteorological Administration (KMA). White shading represents the observation areas and cross marks indicate the radar sites.
분석의 용이성을 위해 각 기상레이더에서 관측한 PPI 자료를 하나의 3차원 카르테시안 좌표계 격자로 합성하기 위해 Py-ART 패키지를 활용하였다. Py-ART는 미합중국 에너지부(United States Department of Energy) 산하 기관에서 기상레이더 자료 분석 및 활용을 위해 개발한 패키지이며(Helmus and Collis 2016), 다양한 선행연구에서 활용되었다(Hitchcock et al., 2021; Feng et al., 2022; Brown et al., 2023; Park and Kim, 2023). 위 패키지를 통해 1) 중심이 북위 36o, 동경 127.5o이고 수평, 연직해상도가 각각 1 km, 100 m인 3차원 카르테시안 좌표계 합성 자료와 2) 중심이 북위 38o, 동경 126o이고 수평, 연직해상도가 각각 500 m, 250 m인 3차원 카르테시안 좌표계 합성 자료를 생성하였다. 자료 1)은 향후 설명할 LMT 활용에 필요한 SW 자료를 수집할 때 사용하였고 자료 2)는 대류계의 난류 발생 특성 분석에 활용하였다.
기상청에서 제공하는 CMAX 반사도 자료는 북위 38o, 동경 126o를 중심으로 500 m의 수평해상도를 갖는 2차원 카르테시안 좌표계 합성 자료이며 반사도 에코(echo)의 대류영역과 층상영역 구분에 활용되었으며, 이에 대한 상세한 설명은 3.2.1 단원에 작성되었다.
2.2 항공기 관측자료
Aircraft Meteorological Data Relay (AMDAR)는 상업용 항공기에 기상 관측장비를 탑재하여 위치, 시간을 포함한 온도, 바람, EDR 등 기상정보를 수집한다(WMO, 2003). EDR은 난류의 객관적인 강도 지표로 활용되며, 국제민간항공기구에서 항공난류의 강도를 EDR로 표기하는 것을 권고하고 있다(WMO, 2012). 본 연구에서는 난류의 발생 위치 및 강도를 파악하기 위해 위도, 경도, 고도, EDR 자료를 활용하였다. EDR의 값에 따른 강도 범주는 약함(light, LGT), 중간(moderate; MOD), 강함(severe; SEV)으로 나눌 수 있다(Sharman and Pearson, 2017; Kim et al., 2021b). 본 연구에서는 선행연구 분류 결과에 속하는 범주 외에 LGT 강도보다 약한 NIL 강도 범주를 추가하여 총 네 단계의 강도 범주로 분류하였다. 또한 중간과 강함 강도를 포괄하여 중강도 이상(moderate or greater; MOG) 난류로 지칭하였다(Table 1).
2.3 재분석 자료
European Centre for Medium-range Weather Forecast (ECMWF) Re-Analysis version 5 (ERA5)는 ECMWF의 5세대 재분석 자료이며, 수평해상도는 0.25o이고 1시간 간격으로 제공된다(Hersbach et al., 2020). 연직으로는 1 hPa부터 1,000 hPa까지 총 37개 층으로 구성되어 있다. 본 연구에서는 기온, 바람, 혼합비, 강수량, 지위고도 등을 통해 종관 환경 분석 및 대류계의 구조를 파악하기 위해 활용하였다.
3. 연구 방법
3.1 로그정규맵핑기술
난류진단변수로부터 난류의 강도를 파악하기 위해서는 EDR 규모로 변환되어야 한다. 이를 위해 본 연구에서는 로그정규맵핑기술(lognormal mapping technique, LMT)을 통해 변환을 실시하였다. LMT는 난류진단변수 값에 대응되는 에디소산율 값을 얻는 기법으로, 주로 수치모델로 산출된 난류진단지수를 EDR 규모로 변환하기 위해 활용된다. 이 기법은 각기 다른 물리적 규모와 단위를 지닌 진단변수를 EDR 규모로 변환할 수 있는 장점이 있다(Sharman and Pearson, 2017).
장기간 항공기와 지상에서 관측된 EDR(ε1/3)의 분포가 로그정규분포를 따르는 특성을 이용해 임의의 진단변수(D) 값의 분포가 로그정규분포를 따르면 다음과 같이 표준화할 수 있다(Sharman et al., 2014; Kim et al., 2021a).
| (1) |
| (2) |
여기서 < > 는 평균, SD는 표준편차이며 D*는 D에 대응되는 EDR 값이다. 표준화된 Z1과 Z2는 같으므로
| (3) |
| (4) |
여기서 <ln(ε1/3)>과 SD ln(ε1/3)는 장기간의 항공기 관측자료로부터 얻어진 상수이므로 각각 C1, C2로 설정하고 정리하면 다음과 같다(Sharman and Pearson, 2017).
| (5) |
| (6) |
| (7) |
본 연구에서는 SW 기반 EDR (SW-EDR) 값을 산출하기 위해 진단변수를 SW로(Kim et al., 2021b), C1, C2를 각각 -2.572, 0.5067로 설정하면 다음과 같다(Sharman and Pearson, 2017).
| (8) |
| (9) |
| (10) |
따라서 b의 SD ln(SW)와 a의 <ln(SW)★>를 구하면 변환식이 결정된다. 이를 위해 SW 자료의 확률밀도함수를 형성하고, 이 확률밀도함수와 평균제곱근오차의 합이 가장 작은 로그정규분포곡선을 최적합함수로 도출하였다. 이 곡선의 표준편차와 평균을 계산하면 a와 b를 얻을 수 있다.
본 연구에서는 2021년 1년 한 해 기상레이더 관측자료 중 30분 간격의 SW 자료(수평 1 km , 연직 250m 해상도를 갖는 3차원 카르테시안 좌표계 합성 자료)를 수집하였다. 수집된 SW의 신뢰도를 평가하기 위해, 신호 대 잡음비(signal to noise, SNR)의 Confidence value (CV)를 산출하였다(Williams et al., 2006). CV는 SNR 값에 따라 0~1 사이의 값을 갖게 되며, r을 레이더로부터 거리(km)라 하고, Reflectivity (r)을 해당 r에서의 반사도(dBZ)라 하면 SNR (dB) 산출식은 다음과 같다.
여기서 20 dB ≤ SNR(r) ≤ 70 dB이면 CV가 1로 최대가 나타나며, SNR(r) ≤ 10 dB 또는 80 dB ≤ SNR(r)이면 CV는 0이 된다. Figure 2는 향후 소개할 대류사례의 CV 분포를 예시로 나타낸 그림이다. 다양한 고도각에서 관측된 SW가 높은 신뢰도를 보이는 것을 확인할 수 있다.
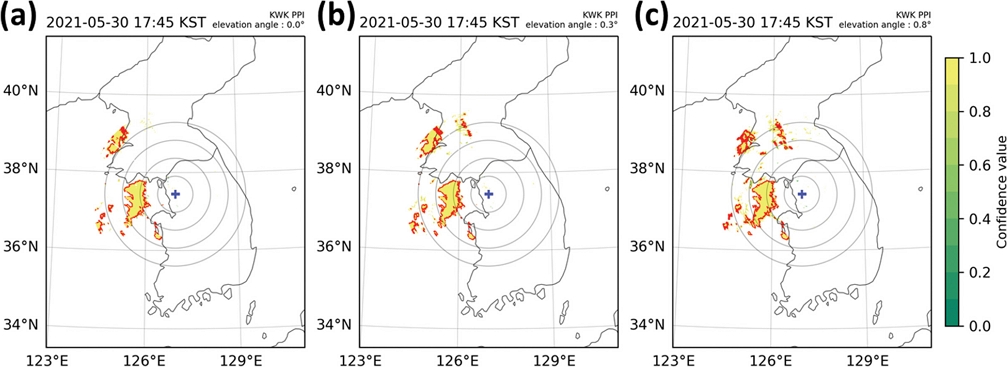
Confidence value (shading), boundary of 15 dBZ reflectivity (red solid line), location of weather radar (blue cross sign) and radius from the weather radar every 50 km (gray solid line). (a), (b) and (c) show the results of using spectrum width data from 0o, 0.3o and 0.8o elevation angle plan position indicator (PPI), respectively. The time of all figures is at 1745 KST on 30 May 2021.
다음으로, 대류영역에 해당될 가능성이 높은 SW 자료를 얻기 위해 반사도가 각각 0, 15, 30 dBZ 이상인 영역에 해당하는 SW 자료를 선별하였다. 선별된 SW에 자연로그를 취하여 50개의 계급으로 나눈 뒤 도수 분포를 구하였다. 이때 SW가 0일 경우 자연로그를 취한 SW (lnSW)는 발산하게 되므로, 계급의 최소 SW 값은 컴퓨터 메모리의 효율을 확보함과 동시에 0에 최대한 가까운 값인 0 .00001 m s-1로 설정하였으며 최대 SW 값은 1 5 m s-1로 설정하였다. 그 다음 확률밀도함수를 형성한 뒤 최적합함수로 도출한 곡선은 Fig. 3과 같다.
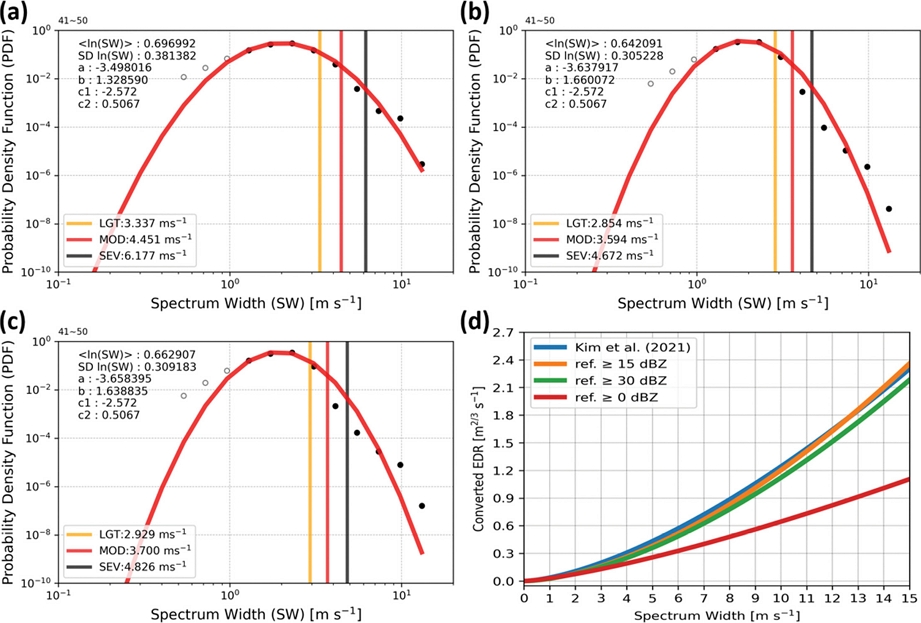
The probability density function (PDF) (circle) and best-fit curve (solid line) of collected spectrum width (SW) data from where reflectivity exceeded a (a) 0 dBZ, (b) 15 dBZ, (c) 30 dBZ. The vertical orange, red, and black solid lines represent the thresholds of the spectrum width for the light, moderate, and severe turbulence, respectively. (d) The relationship between the SW and SW based eddy dissipation rate for the derived formula from results of (a) (red solid line), (b) (orange solid line), and (c) (green solid line). The blue solid line in (d) is result of Kim et al. (2021b). The PDFs were calculated from every 30 minutes SW data in 2021.
SW의 분포는 로그정규분포를 비교적 잘 따르는 것으로 나타났으며(Figs. 3a-c) 이는 선별된 SW 자료가 대기에서 발생하는 난류의 특성을 내포하고 있음을 의미한다(Kim et al., 2021b). 항공기에 큰 위험을 줄 수 있는 강한 강도의 난류에 집중하기 위해 SW의 확률밀도함수의 우측 영역을 위주로 곡선을 형성하였다(Sharman and Pearson, 2017; Kim et al., 2018, 2021b; Kim, et al., 2021). 0 dBZ 이상 영역에 해당하는 SW를 선별하여 산출한 변환식의 경우 15, 30 dBZ 이상 영역의 SW 자료를 활용해 산출한 결과와 비교했을 때 SW-EDR이 낮게 산출되는 것을 확인할 수 있다(Fig. 3d). 0~15 dBZ 값의 레이더 에코는 지형에코, 청천 또는 약한 강수에 의해 나타날 수 있으며, 강수의 경계를 15 dBZ로 설정하는 국내외 선행연구를 참고하여 본 연구에서는 15 dBZ 이상 영역에 속하는 SW로 도출한 상수를 선택하였으며(Zhang et al., 2006; Sohn et al., 2013), 그 변환식은 다음과 같다.
| (11) |
3.2 대류계의 대류영역과 층상영역
본 연구에서는 연직최대 반사도 자료를 기반으로 대류계의 대류영역과 층상영역을 구분하였다. 구분 목적은 층상영역 면적 시계열을 활용한 대류계의 생애주기를 판정하기 위함이다.
Steiner et al. (1995)는 고도 3 km의 constant altitude PPI (CAPPI) 반사도 자료를 활용하여 격자점의 반사도가 40 dBZ 이상이거나(Intensity 조건), 격자점의 반사도와 주변 평균 반사도의 차이가 임계값 이상이면(Peakness 조건) 대류영역으로 구분하는 알고리즘을 고안하였으며, 다양한 선행연구에서 해당 알고리즘을 이용하여 대류영역을 구분하는 과정을 수행한 바 있다(Yuter and Houze, 1997; Feng et al., 2018; Hitchcock et al., 2021; Brown et al., 2023).
Feng et al. (2022)는 Steiner et al. (1995) 알고리즘(이하 기존 알고리즘)을 바탕으로 새로운 알고리즘을 고안하였다. 기존 알고리즘과 차이점으로는 1) 2 km 수평해상도의 CAPPI 반사도 자료 대신 5 00 m 수평 해상도의 CMAX 반사도 자료 활용, 2) Intensity 조건의 반사도 임계값을 40 dBZ에서 60 dBZ로 상향 설정, 3) Peakness 조건의 임계값 함수를 수정한 점 등이 있다. 그 결과 지형에 의한 차폐 완화, 대류 발생 시 더욱 신속한 탐지 확률 증가, 상대적으로 강도가 약하거나 고립되어 있는 대류의 탐지 확률 증가 등의 효과가 있음을 언급하였다.
본 연구에서는 기상청에서 제공하는 CMAX 반사도 자료 확보가 용이한 점, 확보된 자료의 수평해상도가 500 m로 동일한 점이 새로운 알고리즘 적용이 더욱 적합하다고 판단하여 Feng et al. (2022) 알고리즘을 이용하여 대류계의 대류영역과 층상영역 구분을 수행하였다. CMAX 반사도가 15 dBZ 미만인 에코는 약한 에코(weak echo)로 따로 구분하였다. 수행에 사용한 자료는 기상청에서 제공하는 CMAX 반사도 자료이며 10분 간격으로 사용하였다. Figure 4는 새로운 알고리즘을 통해 대류계를 대류영역, 층상영역, 약한 에코로 구분한 예시이다.
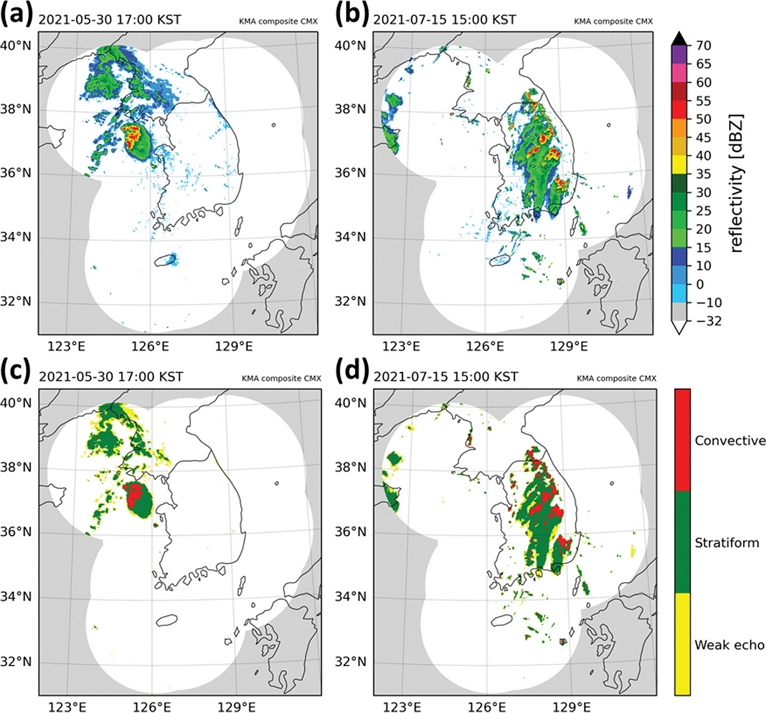
(a-b) Column-maximum reflectivity and (c-d) examples of areas identified as convective area (red), stratiform area (green), and weak echo (< 15 dBZ; yellow) by the separation algorithm. The (a) and (c) show cloud cluster (CC) case at 1700 KST on 30 May 2021 and the (d) and (e) show isolated thunderstorm (ISs) case at 1500 KST on 15 July 2021.
본 연구에서는 대류계의 층상영역 면적의 시계열을 활용해 대류계의 생애주기를 총 세 단계(적운 단계 성숙 단계, 소멸 단계)로 구분하였다. 먼저 대류계의 발생부터 소멸까지의 층상영역의 평균면적을 계산한 뒤 층상영역 면적이 평균면적보다 작은 기간은 적운 단계, 평균면적보다 큰 기간은 성숙 단계, 성숙 단계 이후 평균면적보다 작은 기간은 소멸 단계로 구분하였다(Coniglio et al., 2010; Feng et al., 2018). 이때, 보다 정확한 층상영역 면적 계산을 위해 목표 대류계 외 다른 에코의 영향을 최소화하는 사각형 도메인을 10분 간격으로 새로 설정하여 목표 대류계를 최대한 선별하였다(Fig. 5). Figure 5(a-c)의 경우, 분석 대상으로 하는 대류계가 각기 다른 시각과 공간에서 발생한 다수의 대류셀과 함께 도메인에 포함되는 것을 방지하기 위해 도메인이 이동하는 것을 확인할 수 있다. 반면 Fig. 5(d-f)는 다른 대류계의 영향이 없었기 때문에 도메인이 고정되어 있는 것을 확인할 수 있다.
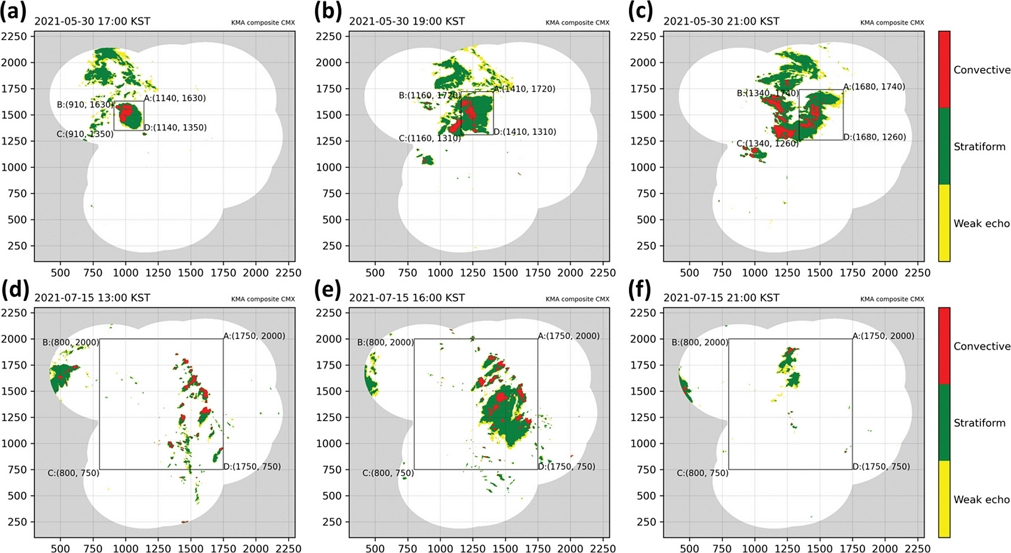
Target domain (black square) during lifespan of each of cases. The shading represents the convective area (red), stratiform area (green), and weak echo (yellow). The gray shading represents the out of radar observation range. The (a-c) and (d-f) show the results of cloud cluster and isolated thunderstorm cases, respectively.
4. 연구 사례
본 연구에서는 SW-EDR이 항공기에서 기록된 EDR 값(AMDAR-EDR)과의 상관성을 비교했을 때 잘 일치하는지 확인하기 위해 2021년 한 해 동안 AMDAR-EDR 자료 중 한반도 레이더 관측 영역을 통과한 AMDAR-EDR 자료를 분석 사례로 선정하였다. Lee and Kim (2007)은 한반도 여름철에 빈번히 발생하는 호우시스템을 기상레이더 반사도 에코의 형태, 시공간 규모, 움직임 등의 현상을 기준으로 스콜선(squall line), 구름무리(cloud cluster; CC), 고립된 뇌우(isolated thunderstorm; IS), 대류밴드(convective band)로 구분한 바 있다. 본 연구에서 선정한 대류사례를 Lee and Kim(2007) 기준을 활용해 유형을 판단하였다.
4.1 2021년 5월 30일 구름무리 사례
해당 사례는 5월 30일 1500 KST 경에 서해에서 대류가 발생한 뒤 동해까지 이동하였다(Fig. 6). Yang et al. (2024)는 해당 사례를 CC 유형으로 분류하고, 수치모델실험을 통해 대류 내부와 근처에서 발생한 난류의 발생 메커니즘을 분석한 바 있다.
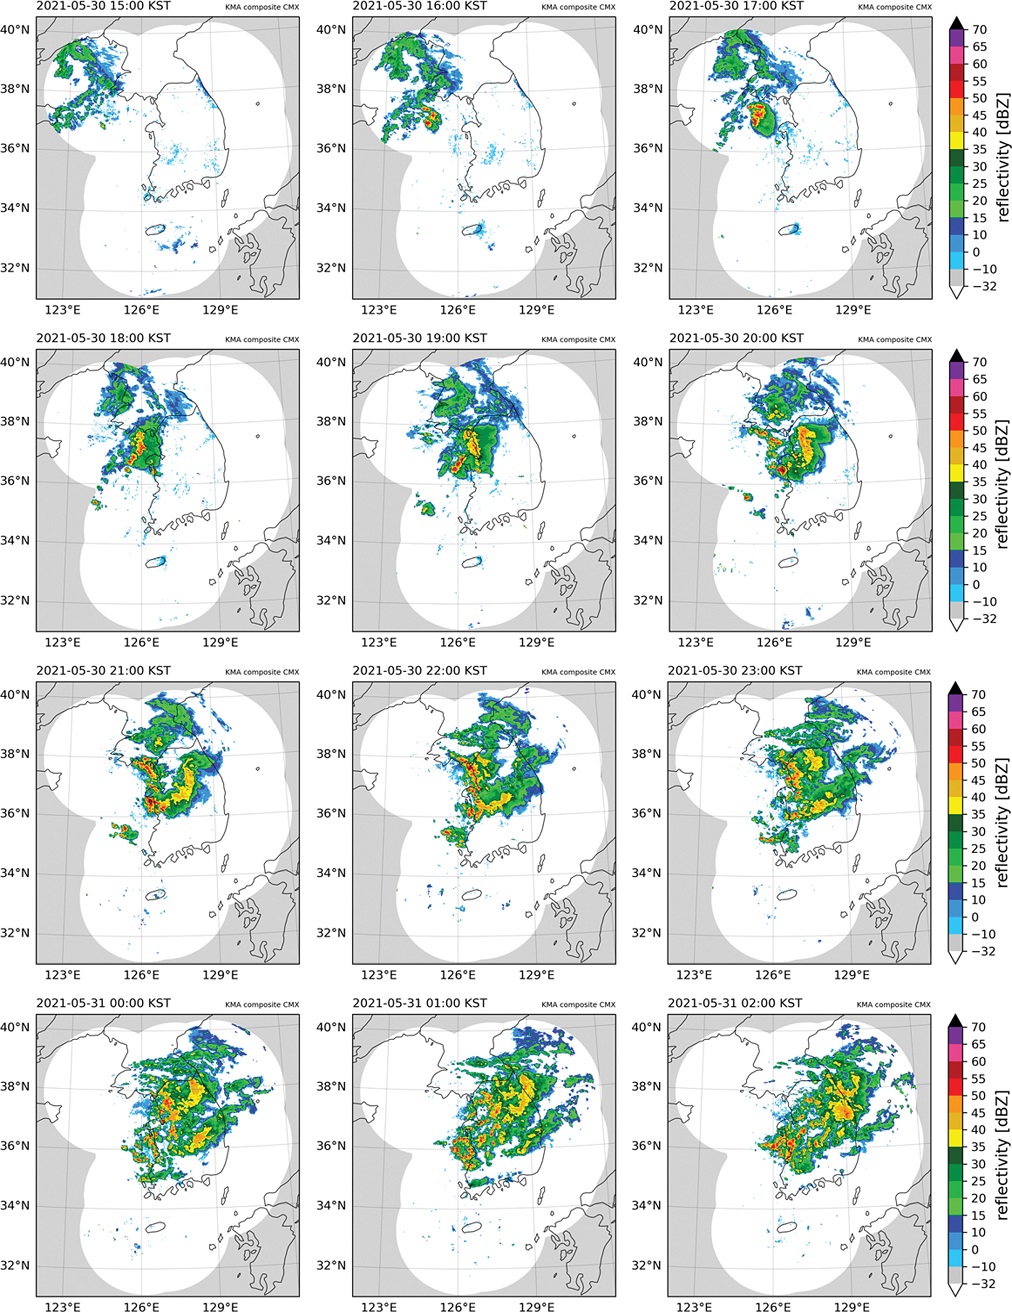
Column-maximum reflectivity (shading) during lifespan (from 1500 KST on 30 May 2021 to 0200 KST on 31 May 2021) of cloud cluster case.
당시 ERA5 1500 KST 자료를 통해 요동반도에 지상 고기압이 존재하고 한반도에서 남풍계열 바람이 불었으며(Fig. 7a) 상층에 기압골 및 한기가 존재하는 것을 확인하였다(Fig. 7b). 이때 한반도 서쪽에 상층 기압골이 존재하고, 하층에서 수분속이 수렴하는 것을 고려했을 때(Fig. 7c), 대류가 발달하기 좋은 환경으로 판단된다. 이로 인해 수도권과 충청도에 많은 강수가 발생하였다(Fig. 7d).
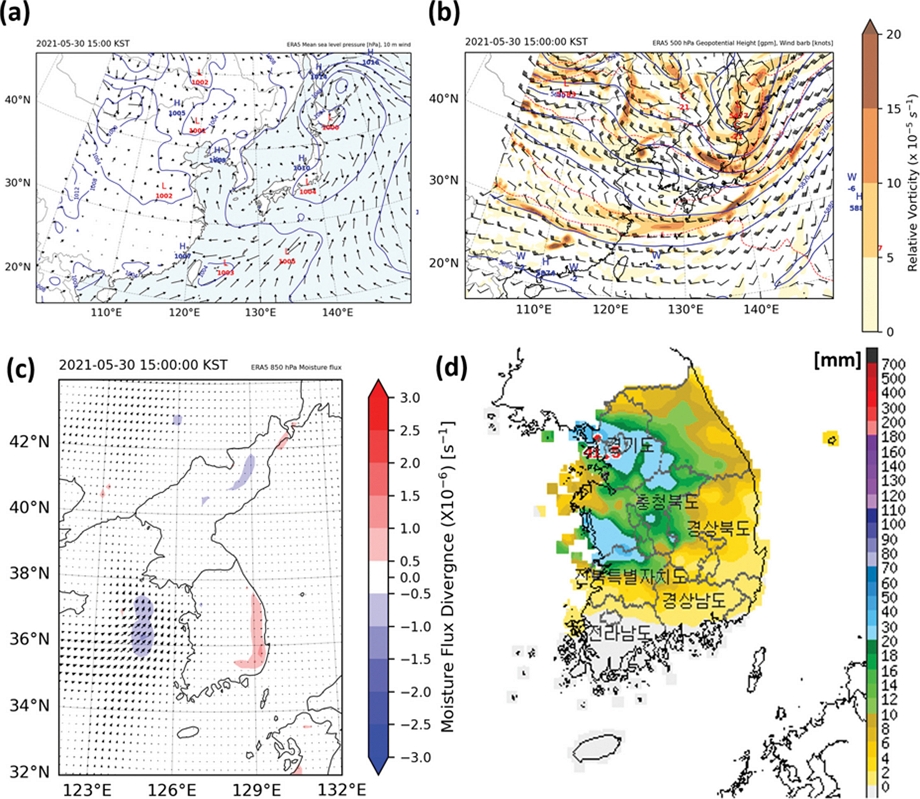
(a) Sea level pressure (contour) and 10 m wind (vectors). (b) 500 hPa geopotential height (solid contours), wind (wind barbs), and temperature (dashed contours). (c) 850 hPa moisture flux (vectors) and moisture flux divergence (shading). (d) 24 hours accumulated precipitation (shading) from 1200 KST on 30 May 2021 to 1200 KST on 31 May 2021. (a)-(c) were obtained from ERA5 reanalysis data, (d) was obtained from automatic weather station (AWS).
4.2 2021년 7월 15일 고립된 뇌우 사례
이 사례는 7월 15일 1200 KST 경에 영서지방에서 대류세포들이 발생한 사례이다(Fig. 8). 15일 0900 KST ERA5 자료를 통해 한반도 지표에서는 남동풍 계열 바람이(Fig. 9a), 상층에서는 일본에 위치한 저기압의 영향으로 강한 북동풍이 발생한 것으로 판단된다(Fig. 10b). 오산 라디오존데로 관측한 결과, 대류권계면의 고도는 약 14.5 km로 비교적 높게 나타났고, 쇼월터 안정지수(Showalter stability index; SSI)는 -1.6으로 뇌우 가능성 급증 단계 범위에 해당한다(Fig. 10c). 대류 온도는 29.6oC로, 같은 시각 영서지방의 무인자동기상관측장비(automatic weather station; AWS)에서 관측된 지면온도는 30oC, 일부는 40oC를 초과하는 것을 확인할 수 있다(Fig. 10d). 따라서 대류온도보다 지면온도가 더 높아짐에 따라 대류현상이 발생하고 강수계가 성장한 것으로 판단된다.
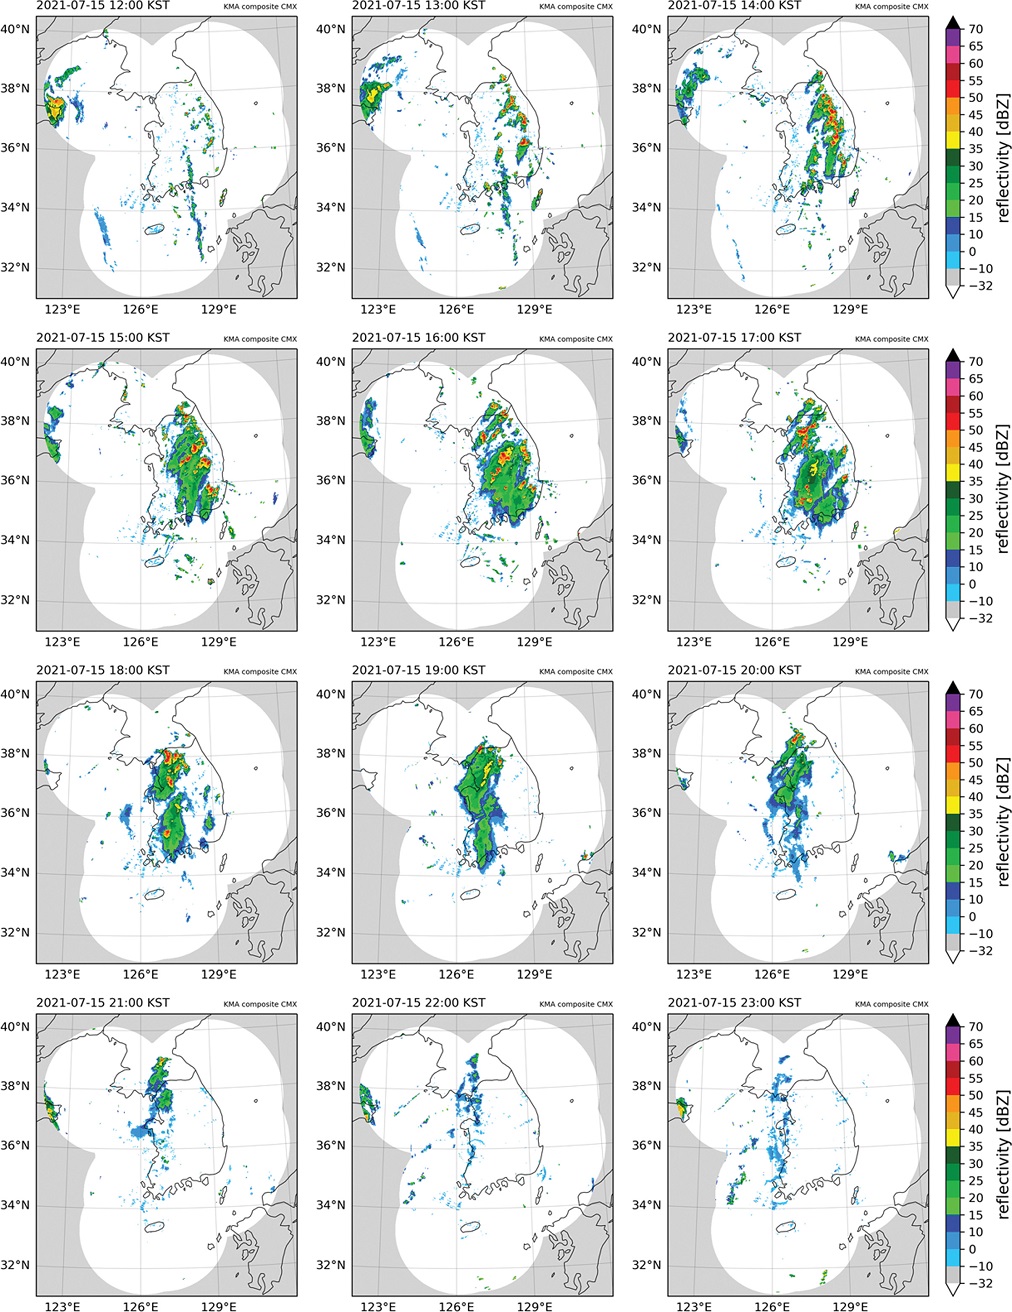
Column-maximum reflectivity (shading) during lifespan (from 1100 KST on 15 July 2021 to 2300 KST on 15 July 2021) of isolated thunderstorm.
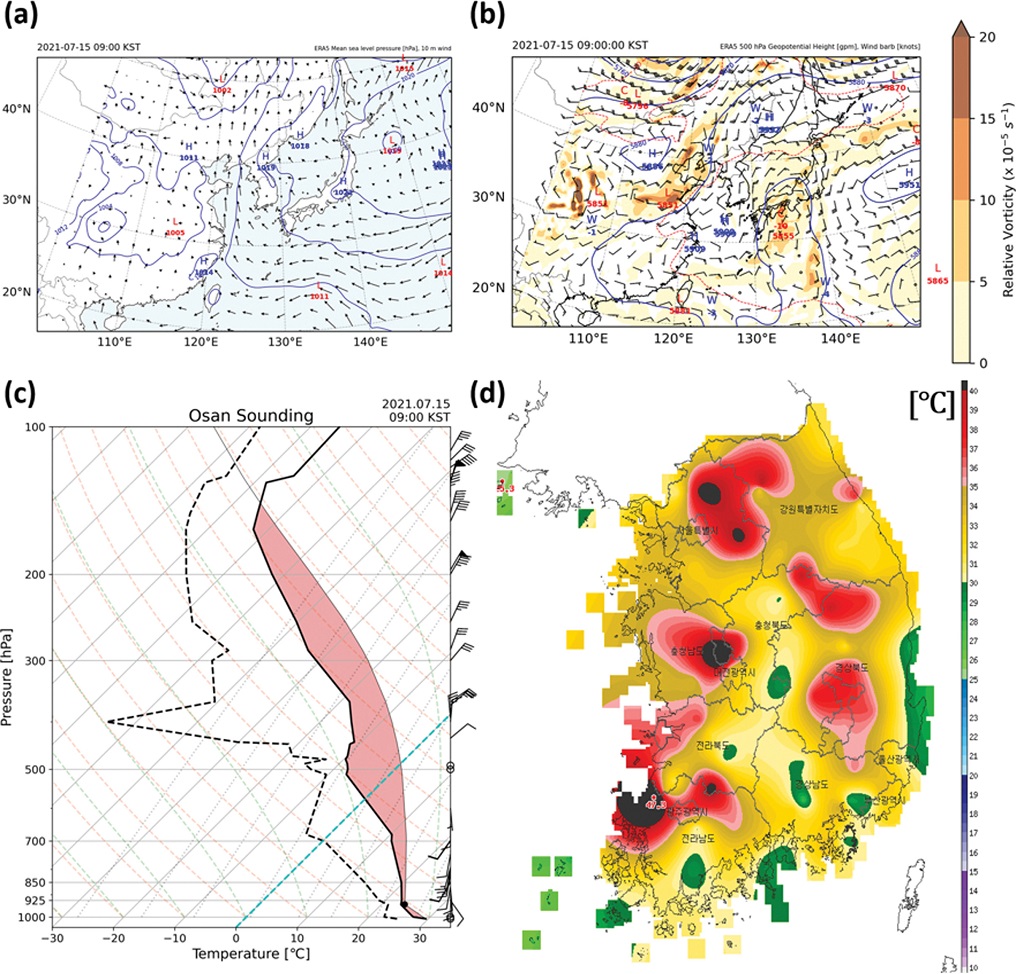
(a) Sea level pressure (contour) and 10 m wind (vectors). (b) 500 hPa geopotential height (solid contours), wind (wind barbs), and temperature (dashed contours). (c) Skew T-log p diagram including temperature (black solid), dewpoint temperature (black dashed), and wind (wind barbs) obtained from the observed at Osan sation. (d) Surface temperature (shading) obtained from the AWS. (a) and (b) were obtained from ERA5 reanalysis data. Time of all figures is at 0900 KST on 15 July 2021.
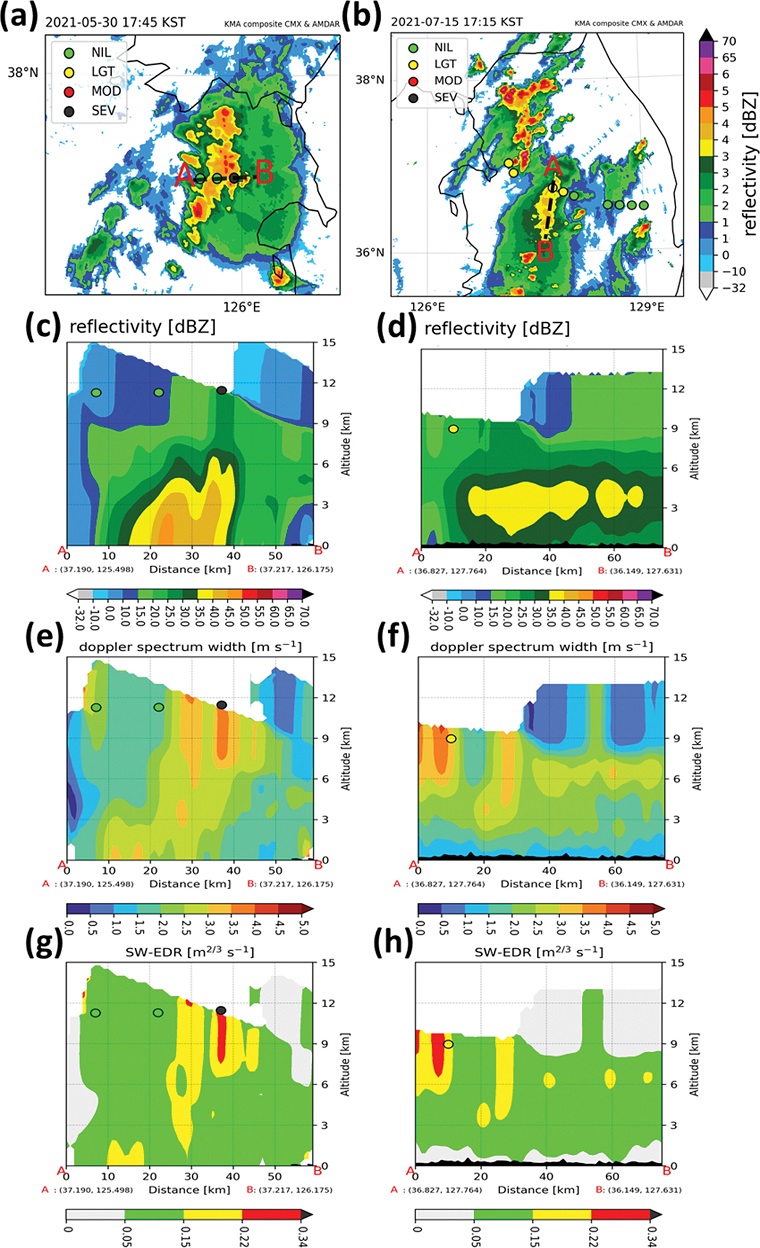
(a)-(b) Column-maximum reflectivity (shading) and vertical cross section line (black dashed). Vertical cross sections of (c)-(d) reflectivity, (e)-(f) spectrum width, and (g)-(h) spectrum width derived EDR. The eddy dissipation rate (EDR) data obtained from aircraft are indicated as colored circles according to the EDR values. The left and right panels show the results of cloud cluster (at 1745 KST on 30 May 2021) and isolated thunderstorm cases (at 1715 KST on 15 July 2021), respectively.
5. 연구 결과
5.1 변환된 EDR과 AMDAR EDR의 비교
앞서 설명한 LMT를 통해 SW로부터 EDR을 얻는 변환식의 상수를 결정하였다. Kim et al. (2021b)는 본 연구와 같은 방법론을 통해 얻은 SW-EDR과 항공기 관측을 통해 산출한 EDR (in situ EDR)을 비교 분석한 바 있다. 그 결과 SW-EDR의 값과 in situ EDR의 값이 잘 일치함을 보였고, SW-EDR의 장점과 필요성을 제시하였다. 본 연구에서도 변환식을 거쳐 얻어진 SW-EDR이 항공기에서 관측된 EDR과 비교하여 신뢰할 만한 결과를 산출하는지 확인하였다.
본 연구에서는 SW-EDR의 연직 단면 자료를 활용하여 앞서 선정된 두 유형의 사례(CC, 사례, IS 사례)에서 관측된 최대 AMDAR-EDR 자료와 SW-EDR의 비교 분석을 수행하였다(Fig. 10). SW-EDR과 AMDAR-EDR의 위치와 강도가 비교적 잘 일치하는 것을 확인할 수 있다(Figs. 10g, h). 특히 Fig. 10g의 x = 37 km, z = 7~11 km 영역을 비행하며 기록된 AMDAR-EDR은 0.351 m2/3 s-1로 나타났는데, SW-EDR 또한 이 국지적으로 강한 난류 영역을 포착하였으며, SW-EDR 값의 범위도 중강도 이상으로 일치하는 것을 확인할 수 있다. 국지적으로 강한 난류 영역뿐만 아니라 항공기에서 관측된 강도가 비교적 낮은 x = 6 k m , z = 11 km 위치의 난류와 x = 2 2 km , z = 11 km 위치의 난류 또한 SW-EDR이 잘 포착하고 있으며, SW-EDR 값의 범위도 AMDAR-EDR과 서로 일치하는 것으로 나타났다. 추가적으로 Fig. 10h의 x = 1 0 km , z = 9 km 영역의 AMDAR-EDR은 0.176 m2/3 s-1로 관측되었는데, SW-EDR 값의 범위도 LGT로 서로 일치하는 것을 확인할 수 있다.
한편 반사도와 SW-EDR의 연직 단면에서 반사도가 높게 나타나는 영역과 SW-EDR이 강하게 나타나는 영역이 상이한데 이는 선행연구와 유사한 결과인 것으로 판단된다(Kim et al., 2021b). 두 사례에서 공통적으로, 반사도의 경우 주로 대류계의 고도 6 km 이하의 하단부에서 강한 강수로 인해 30 dBZ 이상 높은 반사도가 나타나는 반면(Figs. 10c, d), SW-EDR은 고도 6 k m 이상의 상단부에서 0.15 m2/3 s-1보다 큰 강한 난류 분포가 나타나는 것을 확인할 수 있다(Figs. 10g, h). 이는 강한 대류운 내 난류 정보를 파악하기고 이를 안전하게 회피하기 위해서는 반사도 자료보다는 SW와 SW-EDR 자료를 활용하는 것이 더욱 효과적임을 시사한다.
5.2 생애주기 판단
앞서 설명한 바와 같이 층상영역 면적 시계열 자료를 산출한 뒤 생애주기를 판단하였다. 면적 계산은 10분 간격으로 이루어졌으며, 3.2.2 단원에서 언급한 사각형 도메인 내 목표 대류계의 면적을 계산하였다(Fig. 5).
Figure 11의 자료에서 녹색, 적색, 청색 배경은 각각 적운, 성숙, 소멸 단계에 해당한다. 두 사례 공통적으로 성숙 단계에 층상영역과 대류영역의 면적이 최대로 나타났으며, 대류영역 면적의 최대가 나타난 후 층상영역 면적의 최대가 나타났다. CC 사례의 성숙 단계는 약 1720 KST부터 2210 KST까지(Fig. 11a), IS 사례의 성숙 단계는 약 1330 KST부터 1940 KST까지로 나타났다(Fig. 11b).
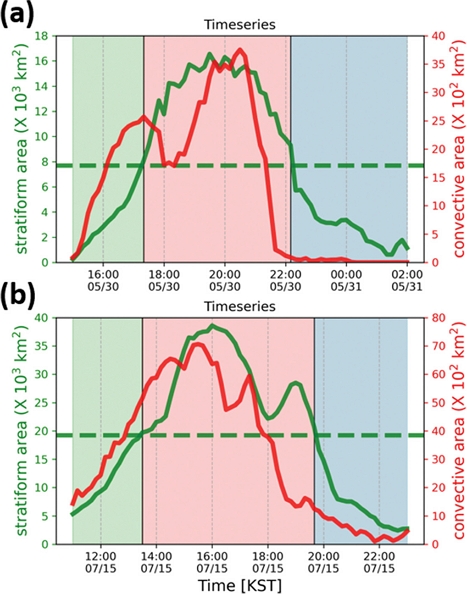
Time series for the stratiform area (green solid line) and convective area (red solid line) within the box domain in Fig. 5, calculated using column-maximum reflectivity data with 10 min time intervals. A mean value of stratiform area is indicated as a green dashed line. The green, red, and blue background colors indicate the life cycle stage of convective system (initial stage, mature stage, and dissipating stage), respectively. The (a) and (b) show the results of cloud cluster and isolated thunderstorm cases, respectively.
5.3 난류 발생 특성
3차원 SW 자료를 SW-EDR로 변환한 뒤 생애주기에 따른, 연직 영역에 따른 발생 특성 분석을 수행하였다. 먼저 3.2.2 단원에서 언급한 사각형 도메인 내 대상 대류계에서 2.2에서 제시한 난류 강도별(NIL, 약함, 중간, 강함) 격자점 개수를 산출하여 분석을 수행하였다. 또한 단순 강도별 격자점 개수 분석뿐만 아니라 3.2.2 단원에서 설정한 도메인 영역에 해당하는 모든 격자점 수에 대한 난류 강도별 격자점 수의 비율을 산출함으로써 난류 강도별 상대적인 중요성을 확인하였다. 도메인 영역에서 NIL, LGT, MOD, SEV에 해당하는 난류의 비율(ratioI)은 다음과 같이 계산된다.
| (12) |
NI은 난류 강도(NIL, LGT, MOD, SEV)에 각각 해당하는 격자점 수, Ntot은 모든 난류 강도의 격자점 수의 합을 의미한다.
먼저 도메인 내 영역에서 난류 강도별 격자점 수를 확인해보면 두 사례 모두 NIL 강도의 난류가 우세하여 전체 난류 중 80% 이상의 비율을 차지하고, 난류의 강도가 증가함에 따라 이들의 비율이 감소하는 것으로 나타났다(Fig. 12). 약함 강도 난류 비율의 경우 두 사례에서 최대 약 12% 전후의 비율로 나타났고, 성숙 단계 때 최대가 나타나는 IS 사례와 달리 CC 사례는 적운 단계 때 최대가(약 12.5%), 소멸 단계 때 비교적 높은 비율이 나타났다(약 9%). 중간강도의 경우 CC 사례는 적운 단계 때(약 2.5%), IS 사례는 성숙 단계 초기(약 3.9%)와 소멸 단계 초기(약 3.7%)에 비율이 높게 나타나는 것을 확인할 수 있다(Figs. 12b, d). 마지막으로 강함 강도의 경우 CC 사례는 성숙 단계 때 비율이 약 0.5%로 최대를 보인 뒤 급감하였으며(Fig. 12b), IS 사례는 성숙 단계까지 비율이 증가하다 소멸 단계 초기에 최대값(약 1.3%)이 확인되었다(Fig. 12d). CC 사례와 IS 사례 둘 다 강함 강도의 난류가 성숙 단계 때 높은 비율이 나타나는 공통점을 찾을 수 있다(Figs. 12b, d).
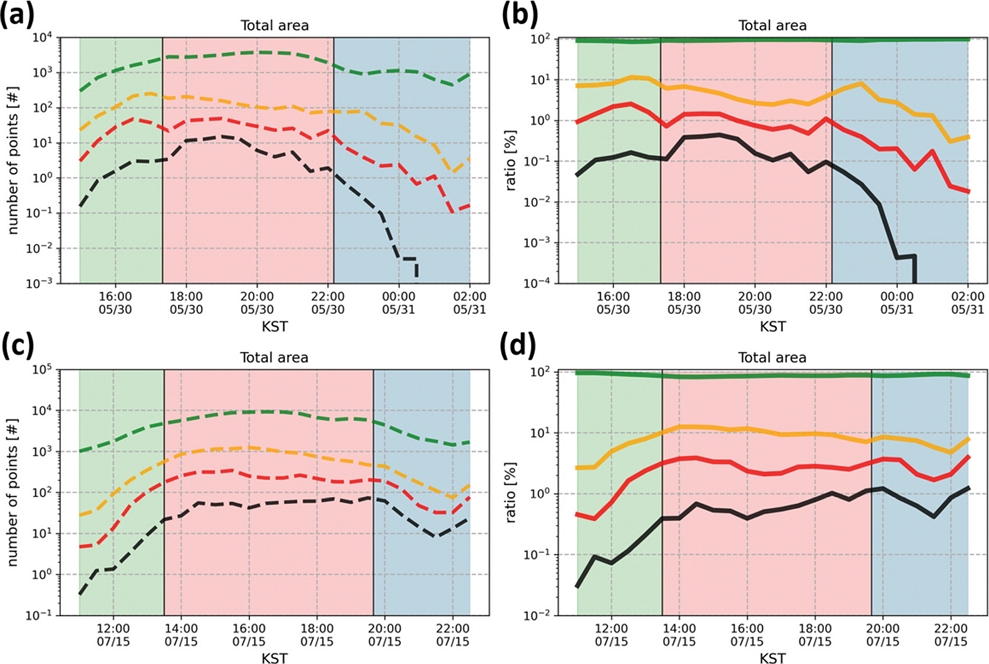
Time series for (a, c) number of grid points of each turbulence intensity (dashed line) and (b, d) ratio of each turbulence intensity (solid line) within the box domain in Fig. 5. The colors of line indicate the intensity of turbulence (green: NIL, yellow: light, red: moderate, and black: severe). The upper and lower panels show the results of cloud cluster and isolated thunderstorm cases, respectively.
CC 사례의 경우 성숙 단계부터 소멸 단계로 갈수록 약함 강도 이상의 난류의 비율이 감소하는 경향이 있는 반면에(Fig. 12b), IS 사례는 적운 단계에서 소멸 단계로 갈수록 비율이 증가하는 경향을 보이는데(Fig. 12d), 대류가 강하게 발달하는 성숙 단계뿐만 아니라 대류가 약화되는 소멸 단계 때도 운항 시 주의가 필요하다.
한편, 선행연구에 따르면 대기 중 청천난류에 대한 중강도 이상 난류의 비율은 모델 재분석에서는 약 1% 미만(Lee et al., 2023), 항공기 관측에서는 약 0.1% 미만(Sharman et al., 2014)으로 나타났으나, 본 연구인 CIT의 중강도 이상 비율은 약 5% 정도로 나타나 대기 중 대류운이 발생할 경우 중강도 이상 난류 발생 가능성이 대류운이 없을 때 대비 최소 5~50배 이상 높다는 것을 확인할 수 있다. 또한 CIT 비율은 낙뢰 자료를 활용한 Kim and Chun (2011b) 에서는 약 10% 정도로 차지했고, 위성자료를 활용한 Baek et al. (2024) 역시 약 10% 정도를 차지한데 비해 본 연구에서는 약 5% 정도로 확인되었다. 이는 선행연구들이 각각 2차원 수평영역에 해당되는 부분만 고려했다면, 본 연구에서는 지상의 기상레이더가 관측할 수 있는 3차원 부피 공간 내에서 확인하였기 때문으로 해석된다.
추가적으로, 항공기에 치명적인 피해를 줄 가능성이 높은 MOG 강도(SW-EDR ≥ 0.22 m2/3 s-1) 난류의 평균 SW-EDR 값과 MOG 강도 난류가 분포하는 부피를 산출하였다(Fig. 13). 이때 3.2.2 단원에서 언급한 사각형 도메인 내의 SW-EDR 자료만을 활용하였다. 먼저CC 사례는 MOG 강도 난류의 평균 SW-EDR이 약 0.25 m2/3 s-1부터 성숙 단계까지 증가하는 추세를 보였으며, 성숙 단계 때 약 0.31 m2/3 s-1의 최대값을 보인 뒤, 소멸 단계로 가면서 약 0.23 m2/3 s-1까지 감소하는 추세를 보였다(Fig. 13a). IS 사례의 경우 CC 사례와 달리 적운 단계 때 MOG 강도 난류의 평균 SW-EDR이 약 0.37 m2/3 s-1의 최대값을 보인 뒤, 약 0.26 m2/3 s-1까지 급감하였다. 그 이후 성숙 단계 동안 약 0.3 m2/3 s-1까지 증가하는 추세를 보이며, 소멸 단계에서는 평균 SW-EDR이 비교적 유지되는 추세를 확인할 수 있다(Fig. 13b). 한편 두 사례 공통적으로 MOG 강도 난류가 분포하는 부피가 성숙 단계 때 최대(CC 사례: 약 8,000 km3, IS 사례: 약 50,000 km3)가 나타나는 것을 확인할 수 있다. 즉, 두 사례 모두 성숙 단계 때 MOG 난류 영역이 가장 넓게 확장되는 것을 의미한다.
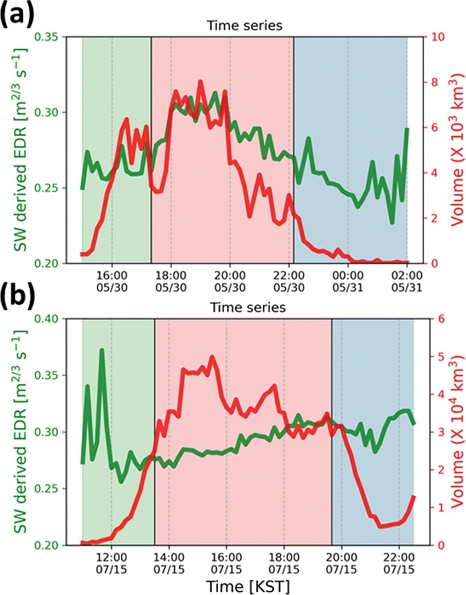
Time series for the mean of SW-EDR for MOG category (green solid line) and turbulent volume of MOG category (red solid line) within the box domain in Fig. 5. The green, red, and blue background colors indicate the life cycle stage of convective system (initial stage, mature stage, and dissipating stage), respectively. The (a) and (b) show the results of cloud cluster and isolated thunderstorm cases, respectively.
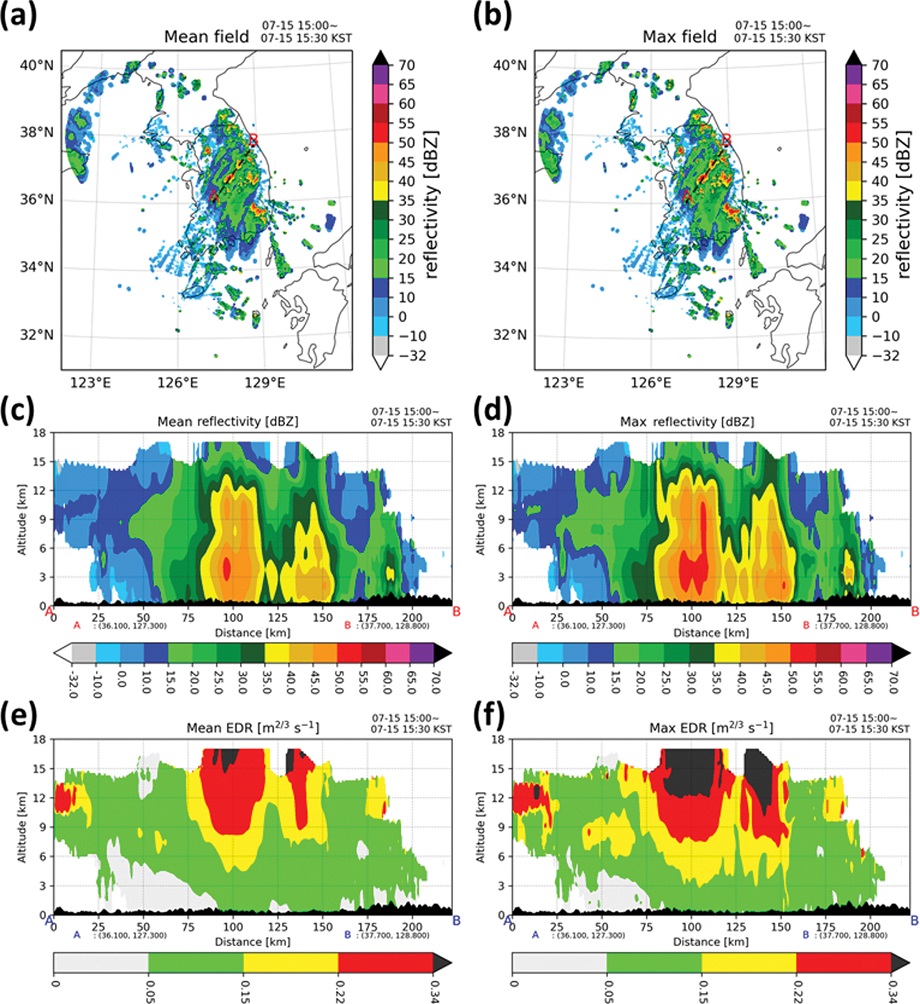
마지막으로 대류계의 고도에 따른 난류 발생 특성을 분석하기 위해, 각 사례별로 반사도와 SW-EDR의 30분 동안 평균 자료와 최대 자료를 산출하고 연직 단면 분석을 실시하였다. 시기는 각각 CC 사례는 1700~1730 KST로 성숙 단계로 접어드는 시기였으며, IS 사례는 1500~1530 KST로 성숙 단계 시기였다.
Figure 14과 Fig. 15는 각각 CC 사례와 IS 사례의 30분 평균 자료의 단면(a, c, e)과 30분 내 최대 자료의 단면(b, d, f)을 나타내는 그림이다. 먼저 CC 사례의 경우 반사도가 30 dBZ 이상인 영역은 주로 고도 7 km, 10 km 이하에 분포하는 반면(Figs. 14c, d의 x = 30 - 70 km 영역), MOG 강도 이상의 SW-EDR은 고도 약 12 km 이상 영역에 분포하는 것을 확인할 수 있다. 특히 고도 약 15 km 부근에서는 0.34 m2/3 s-1 이상 강한 난류의 분포가 나타났다. 또한 비교적 반사도가 낮은(< 20 dBZ) 모루운 부근(Fig. 14f의 x = 130 km, z = 6 - 1 2 km )에서도 MOG 강도 난류가 분포가 나타난다. IS 사례의 경우 CC 사례의 결과와 유하게, 반사도가 30 dBZ 이상인 영역은 주로 고도 12 km 이하에 분포하는 반면(Figs. 15c, d의 x = 80 - 155 km 영역), MOG 강도의 SW-EDR의 분포는 고도 9 km 이상부터 대류운의 상부까지 넓게 나타났다. 이러한 결과는 본 연구와 동일한 방법론을 통해 EDR을 산출 후 분석한 선행 연구뿐만 아니라, SW를 이용하되 다른 방법론을 통해 산출한 EDR을 분석한 선행연구와도 일치하는 결과이다(Williams et al., 2006; Krozel et al., 2015; Kim et al., 2021b). 따라서 대중적으로 활용되는 반사도보다, 대류운에서의 CIT 탐지는 SW-EDR을 활용하는 것이 효과적이며, SW-EDR를 활용하면 더욱 안전한 항공기 운항에 도움이 될 것으로 기대된다.
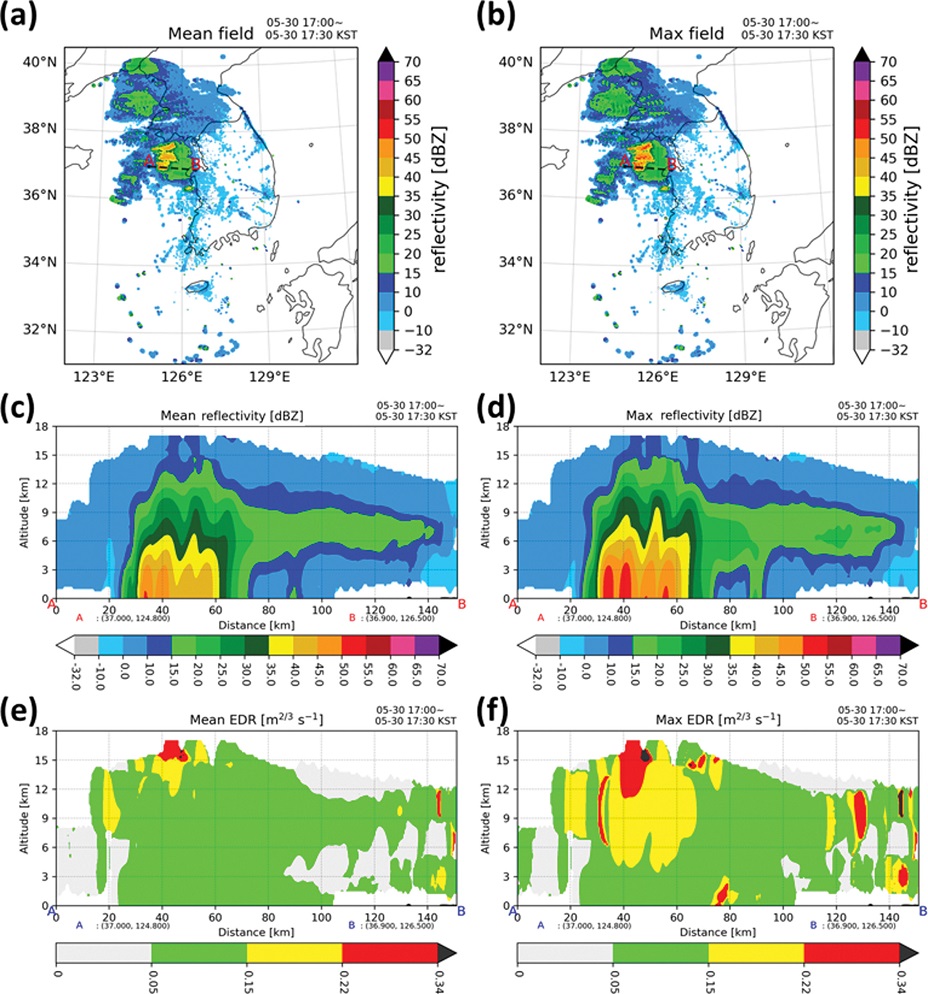
(Left panels) Time averaged values and (right panels) maximum values for the time period of at 1700~1730 KST on May 30 2021. (a)-(b) Column maximum reflectivity (shading) and vertical cross section line (dashed line). (c)-(d) Vertical cross sections of reflectivity (shading). (e)-(f) Vertical cross sections of spectrum width derived eddy dissipation rate (shading).
6. 요약 및 결론
본 연구에서는 S-밴드 이중편파 기상레이더 자료를 활용하여 대류에서 발생하는 난류의 객관적인 강도를 파악하고 발생 특성을 분석하였다.
기상레이더 관측으로부터 얻을 수 있는 스펙트럼 폭은 샘플부피에서 입자의 시선속도 분포의 분산 정도를 나타내는 변수이기 때문에 바람 시어나 난류의 정도를 파악할 수 있지만 난류의 객관적인 강도는 알 수 없다. 따라서 스펙트럼 폭을 난류진단지수로 설정하여 로그정규맵핑기술을 통해 객관적 난류 강도인 EDR로 변환할 수 있는 관계식의 상수를 도출하였다. 그리고 EDR의 값에 따라 NIL, 약함, 중간, 강함 총 네 가지 강도 범주로 분류하였다.
AMDAR-EDR이 기록된 사례 중 SW-EDR과 비교가 가능한 대류 사례를 선정하고 선행연구에서 제시한 기준에 따라 구름무리 그리고 고립된 뇌우로 유형을 분류하였다. 다음으로 스펙트럼 폭으로부터 관계식을 거쳐 얻어진 SW-EDR이 신뢰할 수 있는지 확인하기 위해 항공기에서 관측된 AMDAR-EDR과 비교를 실시하였다. 그 결과 각 사례에서 SW-EDR이 AMDAR-EDR의 강도와 위치를 비교적 잘 포착하는 것으로 확인되었다. 이 과정에서 반사도가 높은 영역과 SW-EDR이 높게 나타나는 영역이 상이한 것으로 나타났는데 이는 선행연구 결과와 유사하며, 반사도 자료 보다는 SW-EDR자료를 활용하는 것이 대류운 상부에서 대류에 의한 난류 발생 및 강도 파악에 더욱 유용할 것임을 시사한다.
대류계에서 생애주기에 따른 난류의 발생 특성을 분석하기 위해 대류계를 층상영역 면적의 시계열을 형성하여 세 단계(적운, 성숙, 소멸 단계)로 나누었다. 또한 난류 강도별 상대적인 중요성을 확인하기 위해 대류계에서 발생하는 모든 강도의 격자점 수에 대한 특정 강도의 격자점 수를 계산하여 비율 분석을 주로 수행하였다. 대류계의 생애주기를 기준으로 분석한 결과 구름무리 사례는 적운 단계 때 약함, 중간 강도 난류의 비율이 높게, 성숙 단계 때 강함 강도 난류의 비율이 높게 나타났다. 또한 성숙 단계에서 소멸 단계로 갈수록 약함, 중간, 강함 강도 비율이 감소하는 경향이 있다. 반면 고립된 뇌우 사례는 성숙 단계 때 약함, 중간, 강함 강도의 난류 비율이 높게 나타나고, 소멸 단계에 진입해도 비율이 유지 및 증가하는 경향이 있는데, 이는 소멸 단계에 진입한 뒤 비율이 급감하는 구름무리 사례와는 대비되는 결과이다. 마지막으로 두 사례 공통적으로, 반사도가 높은 영역(대류계의 중, 하부)과 강한 난류가 분포하고 있는 영역(대류계의 상부)이 상이하게 나타났으며, 이는 여러 선행 연구와 일치하는 결과이다. 따라서 대중적으로 활용되는 반사도보단 SW-EDR이 대류운에서 발생하는 CIT 탐지에 더욱 효과적이다.
위 결과들을 종합하여 항공기 운항 시 주의해야할 내용을 다음과 같이 제안하고자 한다.
- 1. 대류에 의한 난류 탐지에는 스펙트럼 폭 기반 에디소산율 자료를 활용
- 2. 대류계의 성숙 단계뿐만 아니라 적운, 소멸 단계에도 강한 강도 난류 조우 대비 필요
- 3. 대류계를 관통해야 할 경우, 상단부를 회피하여 운항
- 4. 비교적 반사도가 낮은 모루운 부근도 난류 주의 필요
한편 각기 다른 대류 유형에 속하는 사례에 따라, 시간에 따라, 공간에 따라, 난류 강도에 따라 발생 특성에 차이가 있는 것으로 파악되었다. 이러한 결과는 대류운 주변에서 급작스럽게 발생하는 강한 CIT를 조기 탐지하고 회피하는데 많은 도움을 줄 수 있을 것으로 기대된다. 향후 나라호 항공기 관측자료 및 항공기 궤적 자료 등 다양한 항공기 관측자료 기반 바람 및 난류 자료 활용 시 더 다양한 사례에서의 대류 유형별, 생애주기별, 영역별 한반도에서의 대류에 의한 난류 발생 특성을 파악할 수 있을 것으로 기대된다(Kim and Kim, 2022; Kim et al., 2024).
Acknowledgments
이 연구는 기상청「 차세대 항공교통 지원 항공기상 기술개발(NARAE-Weather)」(KMI2022-00310)의 지원으로 수행되었습니다. 본 논문에 많은 지도와 조언을 주신 서울대학교 지구환경과학부 백종진 교수님과 김상우 교수님께도 감사의 말씀을 드립니다.
References
-
Baek, S.-H., J.-H. Kim, S.-H. Kim, Y. Lee, Y.-J. Noh, and S.-M. Lee, 2024: Characteristics of convectively induced turbulence in East Asia using geostationary Korea Multi-Purpose Satellite-2A (GK-2A) and in situ aircraft data. J. Geophys. Res. Atmos., 129, e2024JD041671.
[https://doi.org/10.1029/2024JD041671]

-
Brown, A., A. Dowdy, T. P. Lane, and S. Hitchcock, 2023: Types of severe convective wind events in Eastern Australia. Mon. Wea. Rev., 151, 419-448.
[https://doi.org/10.1175/MWR-D-22-0096.1]

-
Cohn, S. A., 1995: Radar measurements of turbulent eddy dissipation rate in the troposphere: A comparison of techniques. J. Atmos. Oceanic Technol., 12, 85-95.
[https://doi.org/10.1175/1520-0426(1995)012<0085:RMOTED>2.0.CO;2]

-
Coniglio, M. C., J. Y. Hwang, and D. J. Stensrud, 2010: Environmental factors in the upscale growth and longevity of MCSs derived from rapid update cycle analyses. Mon. Wea. Rev., 138, 3514-3539.
[https://doi.org/10.1175/2010MWR3233.1]

-
Feng, Z., L. R. Leung, R. A. Houze, Jr., S. Hagos, J. Hardin, Q. Yang, B. Han, and J. Fan, 2018: Structure and evolution of mesoscale convective systems: Sensitivity to cloud microphysics in convection-permitting simulations over the United States. J. Adv. Model. Earth Syst., 10, 1470-1494.
[https://doi.org/10.1029/2018MS001305]

-
Feng, Z., A. Varble, J. Hardin, J. Marquis, A. Hunzinger, Z. Zhang, and M. Thieman, 2022: Deep convection initiation, growth, and environments in the complex terrain of central argentina during CACTI. Mon. Wea. Rev., 150, 1135-1155.
[https://doi.org/10.1175/MWR-D-21-0237.1]

-
Gisinger, S., M. Bramberger, A. Dörnbrack, and P. Bechtold, 2024: Severe convectively induced turbulence hitting a passenger aircraft and its forecast by the ECMWF IFS model. Geophys. Res. Lett., 51, e2024GL113037.
[https://doi.org/10.1029/2024GL113037]

-
Helmus, J. J., and S. M. Collis, 2016: The Python ARM Radar Toolkit (Py-ART), a library for working with weather radar data in the Python programming language. J. Open Res. Softw., 4, e25.
[https://doi.org/10.5334/jors.119]

-
Hersbach, H., and Coauthors, 2020: The ERA5 global reanalysis. Quart. J. Roy. Meteor. Soc., 146, 1999-2049.
[https://doi.org/10.1002/qj.3803]

-
Hitchcock, S. M., T. P. Lane, R. A. Warren, and J. S. Soderholm, 2021: Linear rainfall features and their association with rainfall extremes near Melbourne, Australia. Mon. Wea. Rev., 149, 3401-3417.
[https://doi.org/10.1175/MWR-D-21-0007.1]

-
Helmus, J. J., and S. M. Collis, 2016: The Python ARM Radar Toolkit (Py-ART), a library for working with weather radar data in the Python programming language. J. Open Res. Softw., 4, e25.
[https://doi.org/10.5334/jors.119]

-
Kim, E.-T., J.-H. Kim, S.-H. Kim, and C. Morcrette, 2024: Operational aviation icing forecast algorithm for the Korea Meteorological Administration. Wea. Forecasting, 39, 501-521.
[https://doi.org/10.1175/WAF-D-23-0160.1]

-
Kim, J., and J.-H. Kim, 2022: Retrieval and quality assessment of atmospheric winds from the aircraft-based observation near Incheon International Airport, Korea. Atmosphere, 32, 323-340.
[https://doi.org/10.14191/ATMOS.2022.32.4.323]

-
Kim, J., J.-H. Kim, and R. D. Sharman, 2021a: Characteristics of energy dissipation rate observed from the high-frequency sonic anemometer at Boseong, South Korea. Atmosphere, 12, 837.
[https://doi.org/10.3390/atmos12070837]

-
Kim, J.-H., and H.-Y. Chun, 2010: A numerical study of clear-air turbulence (CAT) encounters over South Korea on 2 April 2007. J. Appl. Meteor. Climatol., 49, 2381-2403.
[https://doi.org/10.1175/2010JAMC2449.1]

-
Kim, J.-H., and H.-Y. Chun, 2011a: Development of the Korean Mid- and Upper-Level Aviation Turbulence Guidance (KTG) system using the regional unified model. Atmosphere, 21, 497-506.
[https://doi.org/10.14191/ATMOS.2011.21.4.497]

-
Kim, J.-H., and H.-Y. Chun, 2011b: Statistics and possible sources of aviation turbulence over South Korea. J. Appl. Meteor. Climatol., 50, 311-324.
[https://doi.org/10.1175/2010JAMC2492.1]

-
Kim, J.-H., H.-Y. Chun, R. D. Sharman, and T. L. Keller, 2011: Evaluations of upper-level turbulence diagnostics performance using the Graphical Turbulence Guidance (GTG) system and pilot reports (PIREPs) over East Asia. J. Appl. Meteor. Climatol., 50, 1936-1951.
[https://doi.org/10.1175/JAMC-D-10-05017.1]

-
Kim, J.-H., and H.-Y. Chun, 2012a: A numerical simulation of convectively induced turbulence above deep convection. J. Appl. Meteor. Climatol., 51, 1180-1200.
[https://doi.org/10.1175/JAMC-D-11-0140.1]

-
Kim, J.-H., and H.-Y. Chun, 2012b: Development of the Korean Aviation Turbulence Guidance (KTG) system using the Operational Unified Model (UM) of the Korea Meteorological Administration (KMA) and pilot reports (PIREPs). J. Korean Soc. Aviat. Aeronaut., 20, 76-83.
[https://doi.org/10.12985/ksaa.2012.20.4.076]

-
Kim, J.-H., H.-Y. Chun, R. D. Sharman, and S. B. Trier, 2014: The role of vertical shear on aviation turbulence within cirrus bands of a simulated Western Pacific cyclone. Mon. Wea. Rev., 142, 2794-2813.
[https://doi.org/10.1175/MWR-D-14-00008.1]

-
Kim, J.-H., R. Sharman, M. Strahan, J. W. Scheck, C. Bartholomew, J. C. H. Cheung, P. Buchanan, and N. Gait, 2018: Improvements in nonconvective aviation turbulence prediction for the World Area Forecast System. Bull. Amer. Meteor. Soc., 99, 2295-2311.
[https://doi.org/10.1175/BAMS-D-17-0117.1]

-
Kim, J.-H., J.-R. Park, S.-H. Kim, J. Kim, E. Lee, S. Baek, and G. Lee, 2021b: A detection of convectively induced turbulence using in situ aircraft and radar spectral width data. Remote Sens., 13, 726.
[https://doi.org/10.3390/rs13040726]

-
Kim, S.-H., H.-Y. Chun, D.-B. Lee, J.-H. Kim, and R. D. Sharman, 2021: Improving numerical weather prediction-based near-cloud aviation turbulence forecasts by diagnosing convective gravity wave breaking. Wea. Forecasting, 36, 1735-1757.
[https://doi.org/10.1175/WAF-D-20-0213.1]

-
Kim, J.-H., J.-H. Kim, H.-Y. Chun, and R. D. Sharman, 2023: Global response of upper-level aviation turbulence from various sources to climate change. npj Clim. Atmos. Sci., 6, 92.
[https://doi.org/10.1038/s41612-023-00421-3]

-
Krozel, J. A., W. Deierling, R. Sharman, and J. K. Williams, 2015: Detecting convective induced turbulence via total lightning sensing. AIAA 2015-1548. AIAA Guidance, Navigation, and Control Conference.
[https://doi.org/10.2514/6.2015-1548]

-
Lane, T. P., R. D. Sharman, T. L. Clark, and H.-M. Hsu, 2003: An investigation of turbulence generation mechanisms above deep convection. J. Atmos. Sci., 60, 1297-1321.
[https://doi.org/10.1175/1520-0469(2003)60<1297>2.0.CO;2]

-
Lee, D.-B., and H.-Y. Chun, 2018: Development of the Global-Korean Aviation Turbulence Guidance (Global-KTG) system using the Global Data Assimilation and Prediction System (GDAPS) of the Korea Meteorological Administration (KMA). Atmosphere, 28, 223-232.
[https://doi.org/10.14191/ATMOS.2018.28.2.223]

-
Lee, J. H., J.-H. Kim, R. D. Sharman, J. Kim, and S.-W. Son, 2023: Climatology of clear-air turbulence in the upper troposphere and lower stratosphere in the Northern Hemisphere using ERA5 reanalysis data. J. Geophys. Res. Atmos., 128, e2022JD037679.
[https://doi.org/10.1029/2022JD037679]

- Lee, T.-Y., and Y.-H. Kim, 2007: Heavy precipitation systems over the Korean Peninsula and their classification. Asia-Pac. J. Atmos. Sci., 43, 367-396.
-
Oh, Y.-A., H.-L. Kim, and M.-K. Suk, 2020: Clutter elimination algorithm for non-precipitation echo of radar data considering meteorological and observational properties in polarimetric measurements. Remote Sens., 12, 3790.
[https://doi.org/10.3390/rs12223790]

-
Park, Y.-J., and J.-H. Kim, 2023: Aviation convective index for deep convective area using the Global Unified Model of the Korean Meteorological Administration, Korea: Part 1. Development and statistical evaluation. Atmosphere, 33, 519-530.
[https://doi.org/10.14191/ATMOS.2023.33.5.519]

-
Pearson, J. M., and R. D. Sharman, 2017: Prediction of energy dissipation rates for aviation turbulence. Part II: Nowcasting convective and nonconvective turbulence. J. Appl. Meteor. Climatol., 56, 339-351.
[https://doi.org/10.1175/JAMC-D-16-0312.1]

-
Sharman, R. D., C. Tebaldi, G. Wiener, and J. Wolff, 2006: An integrated approach to mid- and upper-level turbulence forecasting. Wea. Forecasting, 21, 268-287.
[https://doi.org/10.1175/WAF924.1]

-
Sharman, R. D., S. B. Trier, T. P. Lane, and J. D. Doyle, 2012: Sources and dynamics of turbulence in the upper troposphere and lower stratosphere: A review. Geophys. Res. Lett., 39, L12803.
[https://doi.org/10.1029/2012GL051996]

-
Sharman, R. D., L. B. Cornman, G. Meymaris, J. Pearson, and T. Farrar, 2014: Description and derived climatologies of automated in situ eddy-dissipation-rate reports of atmospheric turbulence. J. Appl. Meteor. Climatol., 53, 1416-1432.
[https://doi.org/10.1175/JAMC-D-13-0329.1]

-
Sharman, R. D., and T. Lane, 2016: Aviation Turbulence: Processes, Detection, Prediction. Springer, 523 pp.
[https://doi.org/10.1007/978-3-319-23630-8]

-
Sharman, R. D., and J. M. Pearson, 2017: Prediction of energy dissipation rates for aviation turbulence. Part I: Forecasting nonconvective turbulence. J. Appl. Meteor. Climatol., 56, 317-337.
[https://doi.org/10.1175/JAMC-D-16-0205.1]

-
Sohn, B. J., G.-H. Ryu, H.-J. Song, and M.-L. Ou, 2013: Characteristic features of warm-type rain producing heavy rainfall over the Korean Peninsula inferred from TRMM measurements. Mon. Wea. Rev., 141, 3873-3888.
[https://doi.org/10.1175/MWR-D-13-00075.1]

-
Steiner, M., R. A. Houze, and S. E. Yuter, 1995: Climatological characterization of three-dimensional storm structure from operational radar and rain gauge data. J. Appl. Meteor. Climatol., 34, 1978-2007.
[https://doi.org/10.1175/1520-0450(1995)034<1978>2.0.CO;2]

-
Williams, J., L. Cornman, J. Yee, S. Carson, G. Blackburn, and J. Craig, 2006: NEXRAD detection of hazardous turbulence. AIAA 2006-76. 44th AIAA Aerospace Sciences Meeting and Exhibit.
[https://doi.org/10.2514/6.2006-76]

- WMO, 2003: Aircraft Meteorological Data Relay (AMDAR) reference manual. World Meteorological Organization, WMO-No. 958, 80 pp.
- WMO, 2012: Final report of the Fifth WMO Workshop on the Impact of Various Observing Systems on Numerical Weather Prediction. World Meteorological Organization, WMO Tech. Rep. 2012-1, 25 pp.
-
Yang, S.-I., J. H. Lee, and J.-H. Kim, 2024: A case study on near-cloud turbulence around the mesoscale convective system in the Korean Peninsula. Atmosphere, 34, 153-176.
[https://doi.org/10.14191/ATMOS.2024.34.2.153]

-
Yuter, S. E., and R. A. Houze, 1997: Measurements of raindrop size distributions over the Pacific warm pool and implications for Z-R relations. J. Appl. Meteor. Climatol., 36, 847-867.
[https://doi.org/10.1175/1520-0450(1997)036<0847>2.0.CO;2]

-
Zhang, C.-Z., H. Uyeda, H. Yamada, B. Geng, and Y. Ni, 2006: Characteristics of mesoscale convective systems over the East part of continental China during the Meiyu from 2001 to 2003. J. Meteor. Soc. Japan, 84, 763-782.
[https://doi.org/10.2151/jmsj.84.763]


