한국형앙상블모델(KIM)의 장마 시종일 예측성능 진단: 2021년 장마사례를 중심으로
Ⓒ 2024 Korean Meteorological Society
Abstract
The accurate prediction of Changma (Korean summer monsoon) onset and withdrawal dates is crucial for various sectors including agriculture, water resource management, and disaster prevention. This study applies 25 ensemble members from the operational Korean Integrated Model (KIM) to the Korea Meteorological Administration (KMA) Changma Index (CMI) to diagnose the forecast skill for the onset and withdrawal dates of the 2021 Changma, which marked as the third shortest period on record. The CMI, consisting of 200 hPa geopotential height and zonal wind variables around the Korean Peninsula, was used to compare reanalysis data and KIM’s ensemble forecast data. While the CMI from individual ensemble members showed significant variability in predicting the Changma onset and withdrawal dates, the ensemble mean CMI accurately predicted the Changma onset date 12 days in advance with a one-day error margin, and also accurately predicted the Changma withdrawal date 9 days in advance. Detailed analysis of the variables constituting the CMI in KIM’s ensemble forecast data indicated that variations in the 200 hPa geopotential height were particularly influential in determining the Changma onset and withdrawal dates. These results demonstrate that the ensemble mean forecast of KIM is more effective than individual ensemble member forecasts for predicting Changma onset and withdrawal dates, highlights the utility of KIM’s ensemble forecast data and the effectiveness of using upper atmospheric variables (specifically 200 hPa geopotential height) for these predictions.
Keywords:
Korean Integrated Model (KIM), Ensemble prediction, Changma onset and withdrawal, Changma index1. 서 론
동아시아 여름 몬순(East Asian Summer Monsoon, EASM)은 바람의 반전과 강한 강수를 특징으로 하는 아시아 기후 체계의 중요한 구성 요소이다(Lau and Li, 1984). EASM은 중국 남부 양쯔강 지역, 대만, 한국, 일본 등을 관통하는 몬순 전선을 형성하며, 지역/국가에 따라 일본에서는 ‘바이우(Baiu)’, 중국에서 ‘메이유(Meiyu)’, 한국에서 ‘장마(Changma)’로 정의된다. 우리나라의 장마는 일반적으로 남쪽의 열대성 기단과 북쪽의 한대성 기단이 만나서 정체전선을 형성한다(Wang et al., 2007; Chu et al., 2012; Lee and Seo, 2013). 정체전선이 걸쳐 있는 지역에는 강한 하층제트에 따른 습윤한 공기 유입으로 인해 장기간에 걸쳐 많은 비가 내린다(KMA, 2011). 특히, 최근 30년(1991~2020년) 동안 한반도의 평균 장마 기간은 약 32일로, 이 기간에 한반도 연 총 강수량의 30%가 집중되었다(KMA, 2022). 장마 기간에 집중적으로 강수가 발생하여 많은 인명과 재산 피해가 발생했다. 그러나 장마는 수자원 측면에서 긍정적인 영향도 있다. 장마 기간에 내린 강수량은 댐에 저장되어 생활용수, 공업용수, 농업용수 등으로 활용되어 실생활과 매우 밀접한 관계가 있다. 따라서 장마로 인한 피해를 예방하고 댐수자원 확보 계획을 수립하기 위해 장마의 시작과 종료일을 정확하게 예측하는 것이 중요하다.
여러 선행연구에서 기상/기후 예측 모델을 활용한 몬순 예측이 활발하게 연구되고 있다. 몬순 시작일의 예측에 대한 연구로 Chevuturi et al. (2019)에서는 영국 기상청의 GloSea5-GC2 모델과 다양한 몬순 지수를 사용한 결과 약 한 달 전부터 인도 여름 몬순의 시작일을 1~3일 정도의 오차 범위 내에서 예측하였다. 또한, European Centre for Medium‐Range Weather Forecasts (ECMWF)의 ECMWF’s seasonal forecasting system 5 (SEAS5) 모델을 사용한 결과 시작일을 1~2일 정도의 오차 범위 내에서 예측하였다(Chevuturi et al., 2021). 몬순 종료일까지 예측에 고려한 연구로 Dong et al. (2015)에서는 Coupled Model Intercomparison Project Phase 5 (CMIP5)의 여러 모델들과 하층 대기의 수분과 바람을 고려하는 Precipitable Water-u component wind (PW-U) 지수를 사용한 결과 아시아(인도, 동아시아, 북서태평양) 여름 몬순의 시작일은 약 6~8일 오차 범위 내에서, 종료일은 평균적으로 15일 정도 이르게 예측됨을 확인하였다. 영역을 줄여 EASM의 시종일에 대한 연구로 Kwon et al. (2017)에서는 CMIP5의 여러 모델들로 강수량을 고려하는 몬순 지수(Wang and LinHo, 2002)를 사용한 결과, EASM의 시종일은 최대 2 pentad (pentad; 5일 간격)의 오차 범위를 가지며, 전반적으로 기간을 짧게 예측하는 경향을 보였다.
선행연구들이 주로 대규모 몬순 시스템에 초점을 맞춘 반면, 동아시아의 장마, Baiu, Meiyu와 같은 지역적 특성을 가진 강수 시스템의 시종일 예측 연구는 상대적으로 부족한 실정이다. 특히 한반도의 종관 패턴을 고려한 장마 시종일 예측 연구는 미흡한 상황에서, 최근 장마 기간의 변동성이 더욱 증가하고 있어 예측의 어려움이 가중되고 있다. 과거에는 일반적으로 3주에서 5주 정도였으나, 최근에는 그 변동 폭이 더욱 커지고 있다(KMA, 2022). 이로 인해 장마 예측의 불확실성이 높아져, 2주 이하의 선행시간을 가진 중기 예측의 중요성이 더욱 부각되고 있다.
본 연구는 이러한 연구 격차를 해소하기 위한 첫 단계로, 한반도 예측에 특화된 한국형앙상블모델(Korean Integrated Model, KIM)을 활용하여 장마 시종일 예측 가능성을 탐색하고자 한다. KIM은 한반도의 복잡한 지형과 기상 현상을 고려하여 개발되어 장마와 같은 지역적 기상 현상을 모의하는데 장점이 있다. 본 연구에서는 장마 시종 시 한반도 주변에 형성되는 종관 패턴을 고려한 장마 지수를 활용하며, 앙상블 예측의 특성을 살리기 위해 개별 앙상블 멤버와 앙상블 평균의 예측 결과를 함께 분석한다. 2021년 장마 사례를 중심으로 KIM과 장마지수(Changma Index, CMI)를 활용한 장마 시종일 예측의 가능성을 탐색함으로써, 새로운 장마 시종일 예측 방법의 잠재력을 살펴보고, 향후 장마 예측 연구에 대한 통찰을 얻고자 한다.
본 논문의 구성은 다음과 같다. 2장에서는 사용된 재분석자료와 KIM을 상세히 소개하고, 장마 시종일을 선정하는 방법에 대해 설명하며 이를 2021년 장마 사례에 적용하였다. 3장에서는 2021년 장마 사례의 종관적 특징과 CMI의 변화를 분석하였다. 4장에서는 KIM 앙상블 예측 결과를 활용하여 2장에서 선정된 2021년의 장마 시작일(4.1장)과 종료일(4.2장)의 예측 성능을 분석하고, 다른 장마 시종 표출 방법과 비교하였다 (4.3장). 마지막으로 5장에서는 연구 결과를 요약하고 향후 연구 방향에 대해 토의하였다.
2. 자료 및 방법
2.1 Korean Integrated Model (KIM)
기상청은 초단기(6시간 이내), 단기(4일 이내), 중기(10일 이내) 예보와 특보 지원을 위하여 KIM을 개발하고 이를 활용하고 있다. KIM은 육면체구 격자 체계를 사용하며, 전지구 모델로서 비정역학 코어(Choi and Hong, 2016)와 고해상도 모델에 적합한 물리과정을 포함하고 있다. 주요 특징으로는 자료동화를 위한 관측 전처리(Kang et al., 2018) 및 Hybrid-4DEnVar의 자료동화 체계(Hong et al., 2018)와 3차 Runge-Kutta 시간분할적분 방식을 사용한 예측 시스템이다. KIM은 2020년 4월 28일부터 현업 운영을 시작하였으며, 초기에 version 3.5에서 시작하여 2023년 2월 기준 version 3.8까지 개선되어 운영 중이다. 본 연구에서는 KIM을 기반으로 한 전지구 앙상블 예측 시스템인 Ensemble Prediction System Global (EPSG)에서 생산된 자료를 사용하였다(KMA NMC, 2022). EPSG는 KIM의 앙상블 예측 버전으로, 이하 본 논문에서는 “KIM 앙상블 예측 자료”로 지칭한다. KIM 앙상블 예측 자료의 수평 해상도는 ne144np3(약 32 km)이며, 연직으로는 91개의 층(L91)을 사용한다. 12시간 간격으로 순환 예측을 수행하며, 매일 0000, 1200 UTC에는 확률 예측용으로 12일 동안 1개의 Control Run과 25개의 앙상블 멤버들을, 0600, 1800 UTC는 전지구 분석용으로 12시간 동안 50개의 앙상블 멤버로 예측을 수행한다. 본 연구에서는 2021년 당시의 현업 버전인 KIM 3.6a LATE의 앙상블 예측 자료를 사용하여 2021년 6~7월의 장마 시종일 예측 성능을 분석하였다. 분석에는 0000 UTC 초기 시간의 25개 앙상블 멤버를 바탕으로 200 hPa 지위고도와 동서방향 바람, 그리고 누적 강수량 자료를 사용하였다.
2.2 재분석자료
본 연구에서는 ECMWF에서 제공하는 최신 ECMWF Reanalysis v5 (ERA5) 자료를 사용하였다(Hersbach et al., 2020). ERA5는 이전 버전인 ERA‐Interim (Dee et al., 2011)에 비해 개선된 물리과정과 자료동화 시스템을 사용하여 더 높은 시공간 해상도의 자료를 제공한다. 연구에 대한 분석 자료로 2021년 6월 20일부터 7월 23일까지의 기간 동안 200 hPa 지위고도와 동서 방향 바람 변수를 사용하였고, 시간 해상도는 daily 0000 UTC, 공간 해상도는 0.25o × 0.25o이다.
강수량은 National Aeronautics and Space Administration (NASA)의 Global Precipitation Measurement (GPM; Source: https://disc.gsfc.nasa.gov) IMERG Final Precipitation L3 1 day 0.1o × 0.1o V06 자료를 사용하였다. GPM은 세계 강수 관측을 위해 최첨단 레이더와 라디오미터 시스템을 탑재하였다. 2014년 2월 NASA와 Japanese Aerospace Exploration Agency (일본 항공 우주 연구 개발 기구)에 의해 발사되어 Tropical Rainfall Measuring Mission (TRMM)의 뒤를 잇는 강수 자료이다(Huffman et al., 2015). GPM은 다중 위성 관측으로 전지구적인 고해상도 강수 자료를 제공하며, 특히 육지와 해양에서의 강수를 모두 관측할 수 있는 장점이 있다(Yong et al., 2015). 본 연구는 2021년 6월 20일부터 7월 23일까지의 일누적 강수량 자료를 사용하였다. 또한, 장마의 시작과 종료 시 발생하는 강수량 종관 패턴의 예측 성능을 평가하기 위해 GPM 강수량 자료와 KIM 앙상블 예측 자료(강수량)를 사용하여 패턴상관계수(Pattern Correlation Coefficient, PCC)를 분석하였다.
2.3 KMA Changma Index (CMI)
기상청은 장마 시종일을 수치모델로 모니터링하기 위해 장마 시기에 발생하는 한반도 주변 기압계를 고려하여 CMI를 개발하였으며(KMA, 2012), 아래의 수식(1)로 구성된다:
| (1) |
식(1)의 CMI는 장마 시종일을 결정하는 값이고, GPH200start와 Jet200은 장마 시작을 결정하는 변수, GPH200end는 장마 종료를 결정하는 변수이다. CMI를 구성하는 변수들은 아래 식(2), (3), (4)에 의해 계산된다.
첫 번째 변수인 GPH200start의 조건 식은 아래의 수식(2)와 같다:
| (2) |
식(2)의 GPH200start는 CMI에서 장마 시작을 결정하는 변수이고, GPH20036.25oN는 36.25oN, 122.5o‐132.5oE에서 동서 평균한 200 hPa 지위고도의 값이다. 식(2)에서 GPH20036.25oN의 값이 12,350 gpm 이상이면 75%를, 미만이면 위의 조건 식으로 계산된 값을 GPH200start에 적용한다. GPH200start는 CMI에서 0 ~75 %의 값을 차지하며, 여름철 북태평양 고기압 및 티베트 고기압의 성장으로 인한 정체전선 형성을 판단하는 역할을 한다.
CMI의 두 번째 변수인 Jet200의 조건 식은 아래의 수식(3)과 같다:
| (3) |
식(3)의 Jet200은 CMI에서 장마 시작을 결정하는 변수이고, U20027.5oN는 27.5oN, 122.5o‐132.5oE에서 동서 평균한 200 hPa 동서방향 바람의 값이다. U20027.5oN의 값이 35 m s-1을 초과하면 0%를, 10 m s-1 이상, 35 m s-1 이하이면 위의 조건 식으로 계산된 값을, 10 m s-1 미만은 2 5 %를 Jet200에 적용된다. Jet200은 아열대 제트의 북상과 위치를 판단하는 역할을 한다.
CMI의 세 번째 변수인 GPH200end의 조건 식은 아래 수식(4)와 같다:
| (4) |
식(4)에서 GPH200end은 장마 종료를 결정하는 변수이고, GPH20045.0oN는 45.0o N, 122.5o‐132.5oE에서 동서 평균한 200 hPa 지위고도의 값이다. GPH20045.0oN의 값이 12300 gpm 이상일 때만 GPH200end에 값이 적용된다. GPH200end는 장마 종료를 결정하는 변수로, CMI에서 100% 이하의 값으로 감소시키는 역할을 한다. 주된 역할로 장마 이후 북태평양 고기압 및 티베트 고기압이 한반도 상공을 완전히 덮어 정체전선이 북상하거나 소멸되었는지를 판단한다.
식(2), (3), (4)를 통해 계산된 값들을 식(1)에 적용하여 CMI를 산출한다. CMI는 0~100% 범위 내에 분포하도록 조정되며, 100%에 가까울수록 장마 시작 시 형성되는 기압 패턴과 일치함을 나타낸다. 본 연구에서는 CMI가 처음으로 100%에 도달한 시점을 장마 시작일로, 장마 시작 이후 CMI가 처음으로 80% 이하로 떨어진 시점의 하루 전 날을 장마 종료일로 선정하였다.
3. 2021년 장마 사례 분석
장마 시종일 분석을 위해 한반도의 제주와 중부 지역 기준으로 1982년 이후 세 번째로 짧은 기간을 기록한 2021년 장마 사례(KMA, 2021)를 선정하여, 2.3장에서 정의된 CMI를 바탕으로 2021년 6월 20일~7월 23일의 CMI 시계열을 분석하였다(Fig. 1). 6월 20일부터 CMI 값은 40~80% 사이를 유지하다가 6월 29일부터 점진적으로 상승하였고, 7월 2일에 처음으로 100%에 도달하며 장마 시작 기준에 충족하였다. 이후 7월 9일까지 CMI 값을 100%로 유지하였으나, 7월 10일에 89.22%, 11일에 9 4.35 %로 떨어졌다. 7월 12일에 70.00%로 하락하여 80% 미만을 기록함으로써 장마 종료 기준을 충족하였다. 장마 종료 기준이 충족된 이후인 7월 13일~7월 22일까지 0%를 기록하면서 장마가 완전히 종료되었다(Fig. 1 Black dashed line). 위의 분석을 바탕으로 장마 시작일을 2021년 7월 2일, 종료일을 7월 11일로 선정하였다(Fig. 1 Gray box). 같은 기간 동안 한반도 일 누적 강수량을 분석한 결과는 다음과 같다. 1) 장마 시작 전(6월 20일~7월 1일): 일 누적 강수량이 평균 1.35 mm day-1 정도로 낮게 유지됨. 2) 장마 기간(7월 2일~11일): 정체전선과 저기압의 영향으로 일 누적 강수량 평균 30.78 mm day-1, 최대 56.47 mm day-1의 많은 강수량이 기록됨(7월 3일~7일). 장마 종료 시점에 가까워지면서 강수량이 전반적으로 감소함. 3) 장마 종료 후(7월 12일~23일): 평균 0.41 mm day-1, 최대 0.58 mm day-1(7월 12일~14일)가 기록됨. 평균 2.65 mm day-1로 낮은 일 누적 강수량이 기록됨(7월 15일~23일). 이러한 일 누적 강수량의 변화 패턴은 CMI로 선정된 장마 시종일이 정체전선의 이동과 소멸을 잘 나타내고 있음을 의미한다(Fig. 1 Blue bar graph).
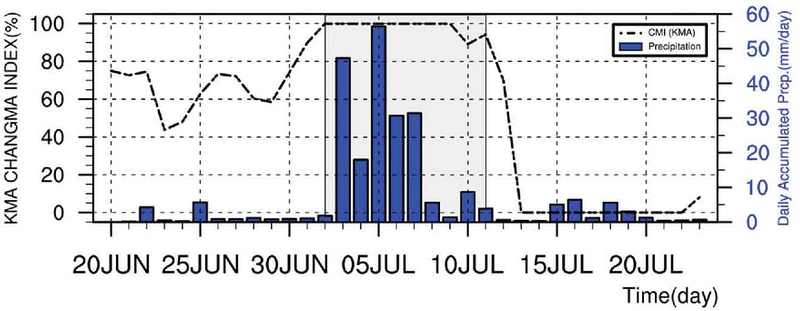
Time series of Korean Meteorological Administration (KMA) Changma Index (CMI; black dashed line) calculated using ERA5 reanalysis data and daily accumulated precipitation (blue bar) from GPM data over the Korean Peninsula (34o-38oN, 126o-130oE) from 20 June 2021, to 23 July 2021. The Changma period, redefined using the CMI, is indicated by the gray box.
Figure 1에서 선정된 2021년 장마 시종일을 기준으로, 해당 사례의 지상과 상층의 종관 패턴 분석을 수행하였다(Fig. 2). 장마가 시작된 7월 2일의 지상일기도(Fig. 2a)에서는 서해상을 통과한 온대 저기압이 한반도 내륙으로 진입하며 아래쪽에 위치한 정체전선을 북쪽으로 끌어올리면서 장마가 시작되었다. 상층 패턴(Fig. 2d)에서는 200 hPa 12,350 gpm 선(red solid contour)이 CMI 시작 기준 선(red dashed contour)을 넘으며, 북태평양 고기압의 영향권에 들어섰음을 보여준다. 장마 전성기인 7월 6일(Figs. 2b, e)에는 정체전선이 한반도 남부지방에 걸쳐 있으며, 한반도 중부 지방 위로 아열대 제트가 형성되었고, 남부지방에 정체전선을 동반한 강수가 지속되었다. 그러나 7월 9일 이후 정체전선이 남하하며 강수량이 감소하였다(Fig. 1 Blue bar graph). 장마 종료일인 7월 11일(Figs. 2c, f)에는 정체전선이 한반도 동쪽으로 밀려났고, 상층에서는 200 hPa 12,300 gpm선(blue solid contour)이 40°N 이상으로 아열대 제트와 함께 북상하여 GPH200end 값이 증가함으로 장마가 종료되었다. 2021년 사례 분석을 통해 장마의 시종이 종관규모 기압계의 변화와 밀접하게 연관되어 있음을 확인할 수 있었다. 온대 저기압의 이동, 정체전선의 위치 변화, 그리고 북태평양 고기압과 아열대 제트의 북상이 장마 시종을 결정짓는 주요 요인으로 작용하였으며, CMI의 구성 요소들이 종관 패턴의 변화를 잘 반영하고 있음을 확인하였다.
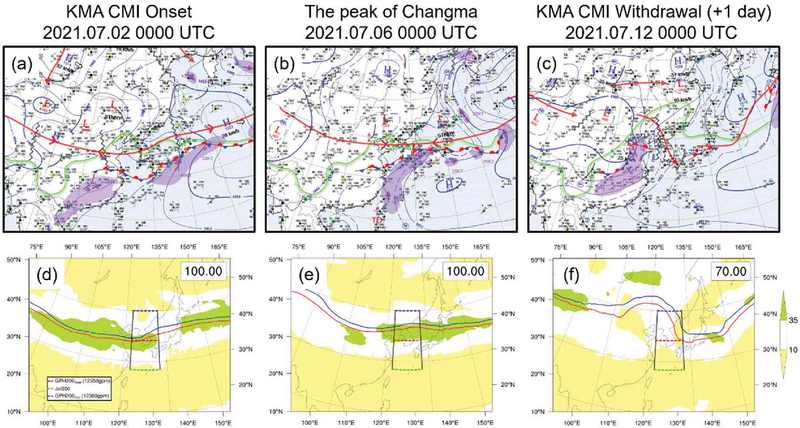
Surface weather charts (a-c) and synoptic patterns derived from Korean Meteorological Administration (KMA) Changma Index (CMI) variables (d-f) during the 2021 Changma period: (a, d) CMI onset (2 July 2021, 0000 UTC; CMI = 100), (b, e) peak of Changma (6 July 2021, 0000 UTC; CMI = 100), and (c, f) CMI withdrawal (12 July 2021, 0000 UTC; CMI = 69.9961). In surface weather charts (a-c), isobars (blue contours), upper-level jet streams (red arrows), low-level jet streams (purple shaded areas and arrows), and troughs and ridges (black solid lines) are shown. In CMI-based synoptic patterns (d-f), 200 hPa 12350 gpm line represents GPH200start (red solid contour), 200 hPa zonal wind speeds show Jet200 (shaded), and 200 hPa 12300 gpm line indicates GPH200end (blue solid contour). The dashed lines near the Korean Peninsula (122.5˚-132.5˚E) represent the reference lines for GPH200start (red), Jet200 (green), and GPH200end (blue) calculations. The CMI values for each date are shown in the top right corner of panels d-f.
4. 결 과
4.1 장마 시작일 예측성능 진단
장마 시작일(7월 2일)에 대한 KIM 앙상블 예측 자료의 CMI 분석 결과, 앙상블 평균과 앙상블 스프레드의 특성이 초기장에 따라 다르게 나타났다. 장마 시작 12일 전(Fig. 3a)과 8일 전(Fig. 3b) 초기장에서는 앙상블 스프레드가 예측시간 약 2~3일부터 증가한 반면, 4일 전(Fig. 3c) 초기장에서는 약 7일 이후부터 앙상블 스프레드가 증가하였다. 전체 초기장에서 앙상블 평균은 재분석자료의 CMI와 유사한 분포를 보였으며, 특히 장마 시작일 12일 전 초기장에서 하루 정도의 오차로 장마 시작일을 예측하였다(Fig. 3a). KIM 앙상블 예측 자료의 앙상블 평균에 대한 CMI 변수별 종관 패턴 분석 결과, 전반적으로 재분석자료와 유사한 패턴을 보였다(Fig. 2d). Figure 4b에서 200 hPa 12,350 gpm 선의 북상이 다소 낮게 형성된 것을 제외하고, 모든 초기장에서 한반도 인근의 200 hPa 12,350 gpm 선(Fig. 4 red solid contour)과 아열대 제트 중심의 북상을 잘 모의하였다(Fig. 4).
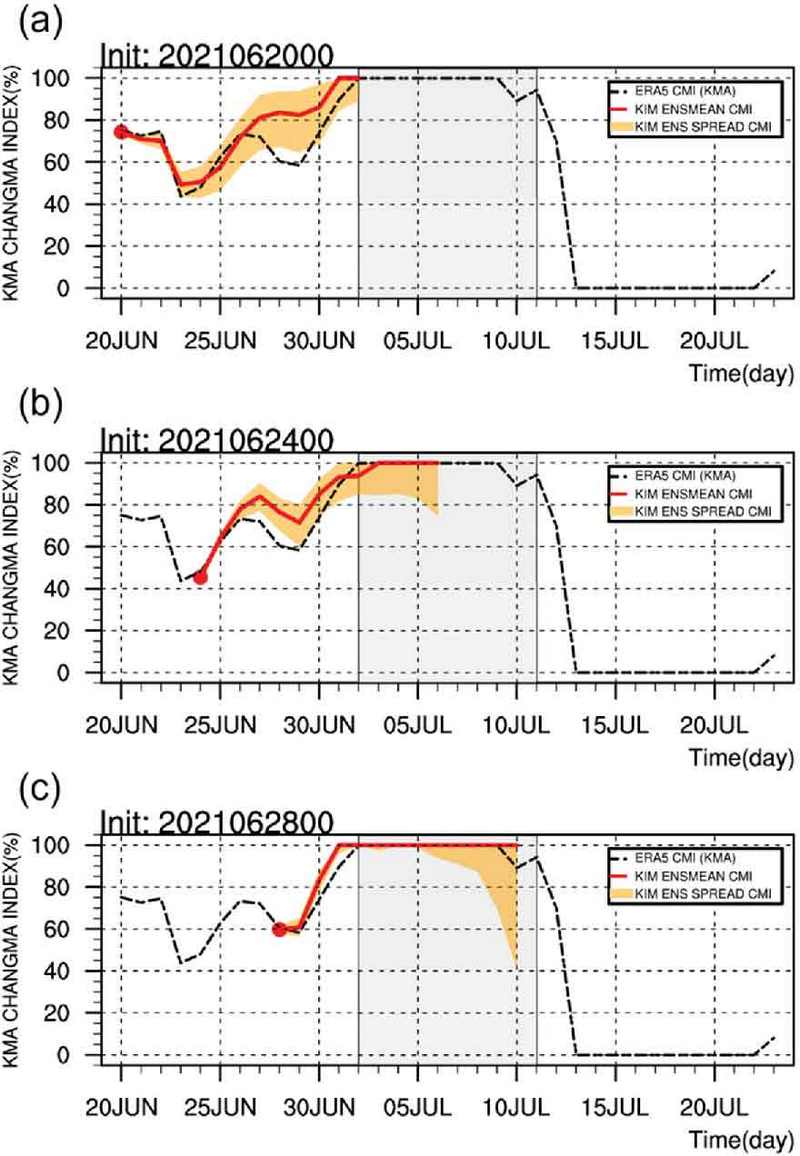
Time series of Korean Meteorological Administration (KMA) Changma Index (CMI). Each panel represents forecast results of the Korean Integrated Model (KIM) initial times: (a) 20 June 2021, 0000 UTC, (b) 24 June 2021, 0000 UTC, and (c) 28 June 2021, 0000 UTC. The black dashed line indicates the ERA5 reanalysis CMI (black dashed line) from 20 June 2021 to 23 July 2021, and the Changma period, using the CMI, is indicated by the gray box. Within KIM forecast ensemble, the red solid line indicates the ensemble mean (ENSMEAN), while the shaded orange area indicates the region within one standard deviation from the ensemble members mean.

Same as Figs. 2d-f, but showing ensemble mean forecasts for the CMI onset (Valid time: 2 July 2021, 0000 UTC) from different initial times: (a) 20 June 2021, 0000 UTC, (b) 24 June 2021, 0000 UTC, and (c) 28 June 2021, 0000 UTC. The forecast CMI values for the ensemble mean at each initial time are shown in the top right corner of each panel.
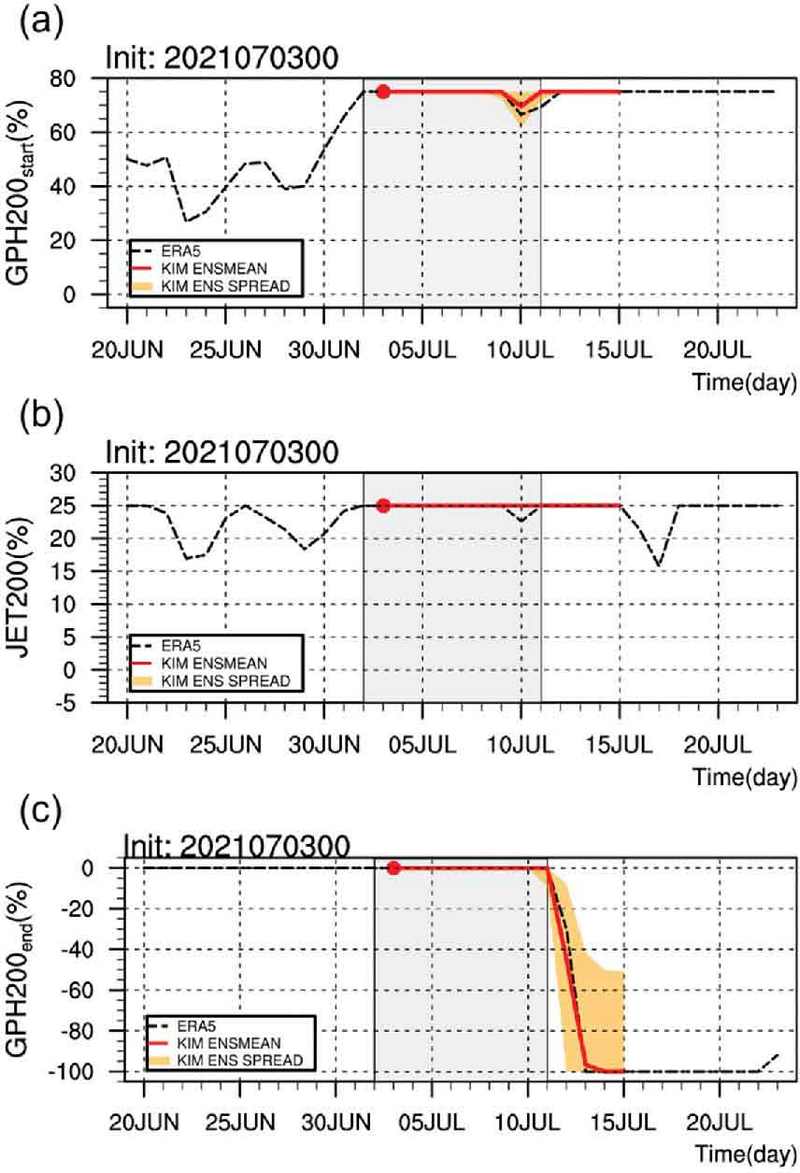
장마 시작일 12일 전 초기장(Figs. 3a, 4a)에 대한 CMI 구성 요소 별 분석 결과, GPH200start (Fig. 5a)와 Jet200 (Fig. 5b)의 앙상블 스프레드는 예측시간 2~3일부터 증가한 반면, GPH200end (Fig. 5 c)은 예측시간 11~12일이 되어서야 스프레드가 형성되었다. GPH200start와 Jet200의 앙상블 평균 예측이 재분석자료의 시계열을 전반적으로 유사하게 예측한다. 특히 GPH200start는 CMI (Fig. 3a)의 예측시간에 따른 결과 흐름과 유사하게 나타났다.
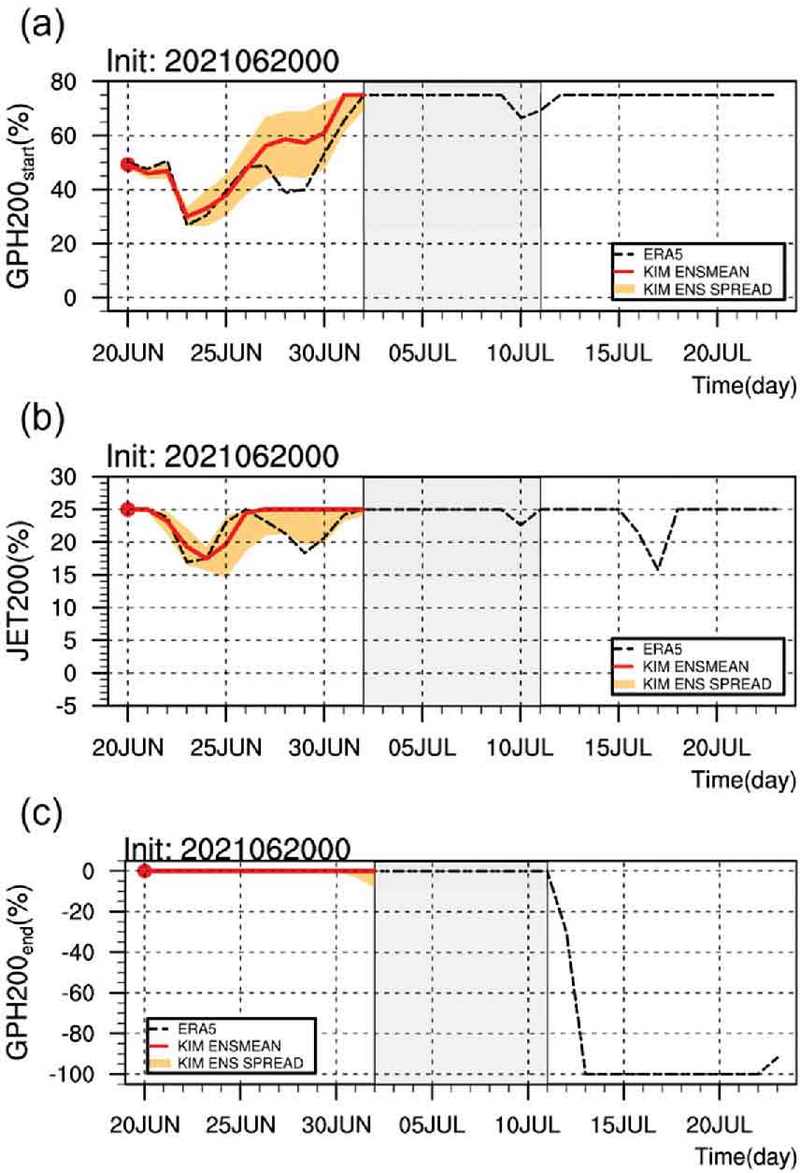
Time Series of each variable constituting the Korean Meteorological Administration (KMA) Changma Index (CMI), initiated on 20 June 2021, 0000 UTC: (a) GPH200start, (b) Jet200, and (c) GPH200end. The black dashed line indicates the ERA5 reanalysis CMI variable (black dashed line) from 20 June 2021 to 23 July 2021, and the Changma period, using the CMI, is indicated by the gray box. Within KIM forecast ensemble, the red solid line indicates the ensemble mean (ENSMEAN), while the shaded orange area indicates the region within one standard deviation from the ensemble mean.
4.2 장마 종료일 예측성능 진단
장마 종료 시점 다음 날(7월 12일)에 대한 KIM 앙상블 예측 자료의 CMI 분석 결과, 앙상블 평균과 앙상블 스프레드의 특성이 예측일에 따라 다르게 나타났다. 전체 초기장에서 앙상블 평균은 재분석자료의 CMI와 유사한 분포를 보였다. 특히, KIM 앙상블 예측 자료의 앙상블 평균 CMI는 장마 종료 시점 다음 날의 9일 전 초기장에서 정확하게 장마 종료 시점 다음 날을 예측하였다(Fig. 6b). 12일 전 초기장(Fig. 6a)에서는 장마 종료 시점을 1일 늦게 예측하였으며, 6일 전 초기장(Fig. 6c)에서는 장마 종료 시점을 정확히 예측하였다. 앙상블 스프레드에서는 12일 전 초기장(Fig. 6a)에서는 예측 초반부터 스프레드가 크게 나타났으며, 장마 종료 시점을 중심으로 더욱 증가하였다. 9일 전 초기장(Fig. 6b)에서는 예측 초반에는 스프레드가 작았으나, 장마 종료 시점에 가까워지면서 급격히 증가하였다. 6일 전 초기장(Fig. 6c)에서는 전반적으로 스프레드가 작았으며, 장마 종료 직전에만 약간 증가하는 양상을 보였다. KIM 앙상블 예측 자료의 앙상블 평균에 대한 CMI 변수 별 종관 패턴 분석 결과, 전반적으로 재분석자료와 유사한 패턴을 보였다(Fig. 2f). 모든 초기장에서 한반도 인근의 200 hPa 12,300 gpm 선(blue solid contour)이 만주 지역까지 북상하는 것을 잘 모의하였다(Fig. 7).
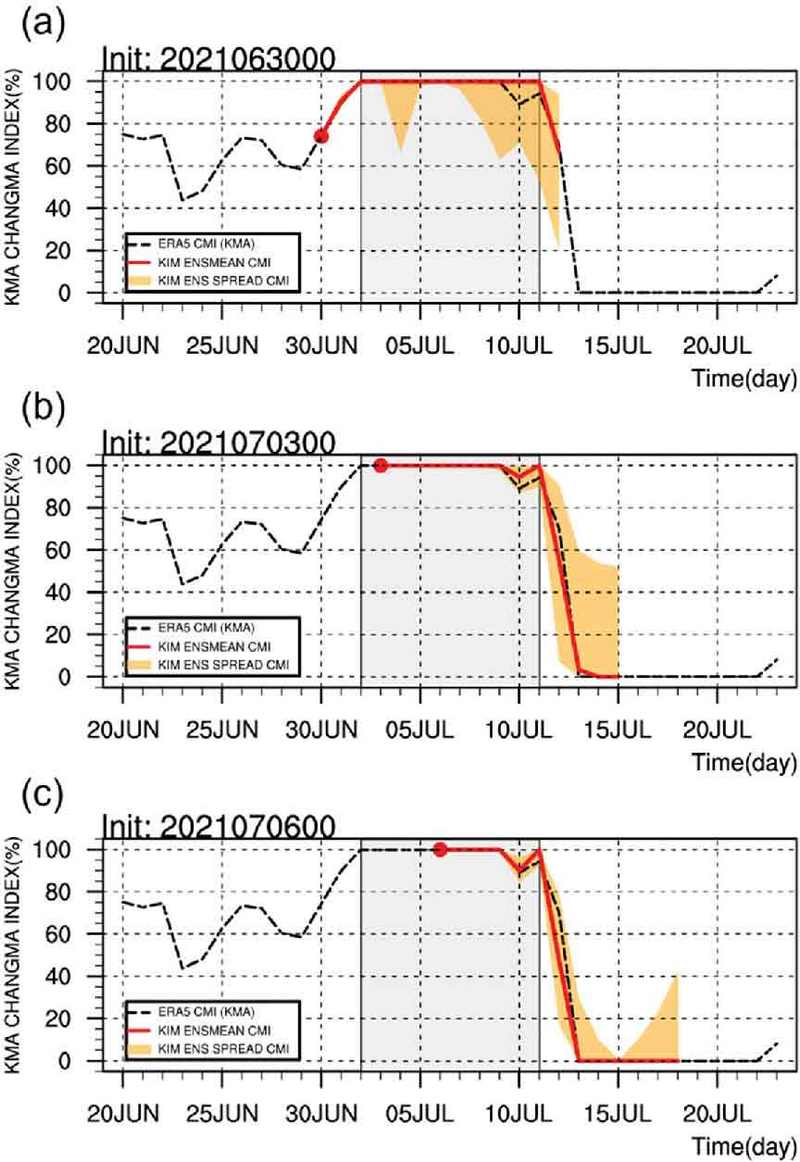
Same as Fig. 3 except for forecast results of the Korean Integrated Model (KIM) initial times: (a) 30 June 2021, 0000 UTC, (b) 3 July 2021, 0000 UTC, and (c) 6 July 2021, 0000 UTC.

Same as Fig. 4, but showing ensemble mean forecasts for the CMI withdrawal (Valid time: 12 July 2021, 0000 UTC) from different initial times: (a) 30 June 2021, 0000 UTC, (b) 3 July 2021, 0000 UTC, and (c) 6 July 2021, 0000 UTC.
장마 종료일 9일 전 초기장(Figs. 6b, 7b)에 대한 CMI 구성 요소 별 분석 결과, GPH200start (Fig. 8a)와 Jet200 (Fig. 8b)은 모든 예측시간에서 스프레드가 작았고, GPH200end (Fig. 8c)에서 예측시간 9일부터 스프레드가 증가하였다. CMI 모든 변수들의 앙상블 평균은 재분석자료와 유사한 분포를 보였다. 특히, GPH200end는 CMI (Fig. 6b)의 예측시간에 따른 결과 흐름과 유사하게 나타났다.
4.3 장마 시종일 예측 성능 비교
본 연구에서는 상층 변수들을 사용하는 CMI의 성능을 평가하기 위해, 기존 선행연구(Ho et al., 2003; Ha et al., 2005; Kwon et al., 2017)에서 사용된 지상 관측 변수 기반의 방법과 비교 분석을 수행하였다. 구체적으로, 일 누적 강수량의 종관적 패턴을 평가하는 PCC 분석을 통해 CMI의 장마 시종일 예측 성능을 비교하였다. PCC는 두 공간 패턴 간의 유사성을 -1에서 1 사이의 값으로 나타내는 지표로, 1에 가까울수록 높은 유사성을 의미하며, 본 연구에서 강수 패턴 예측의 정량적 평가를 위해 PCC가 0.6 이상일 때 예측이 잘 수행되었다고 판단하였다. PCC와 CMI의 비교 분석은 다음과 같이 수행되었다. PCC 분석의 경우, 장마 시작일(7월 2일)과 종료일(7월 11일)을 기준으로 11일 전부터 하루 전까지의 예측 값을 사용하여 각 시점에 형성되는 강수 패턴을 평가하였다(Fig. S1). CMI 분석에서는 장마 시작일(7월 2일)과 종료 다음 날(7월 12일)을 기준으로 12일 전부터 하루 전까지의 예측 값을 사용하여 각 시점에 형성되는 CMI를 평가하였다(Fig. 9). 장마 시작일의 일 누적 강수량 PCC는 앙상블 평균에서 하루 전 예측에서도 0.6보다 낮은 값을 보였으며, 모든 앙상블 멤버에서도 0.6 이상을 기록하지 못하였다(Fig. S1a). 반면, CMI를 활용한 장마 시작일 예측은 12일 전 초기장에서 하루 정도의 오차로 예측이 가능하였다(Figs. 3a, 5, and 9a). 장마 종료일의 일 누적 강수량 PCC는 앙상블 평균에서 5일 전 예측부터 0.6 이상의 값을 유지하였다(Fig. S1b). 일부 앙상블 멤버는 9일 전 예측에서도 0.6 이상의 값을 보였다. CMI를 활용한 장마 종료 시점 다음 날 예측은 9일 전 초기장에서부터 앙상블 평균은 80% 아래 값을 예측해 PCC보다 빠른 선행시간에서 예측이 가능한 것으로 나타났다(Figs. 6b, 8, and 9b). 종합적으로, CMI를 활용한 장마 시종일 예측이 PCC를 활용한 방법보다 더 높은 예측성을 보여주었다.
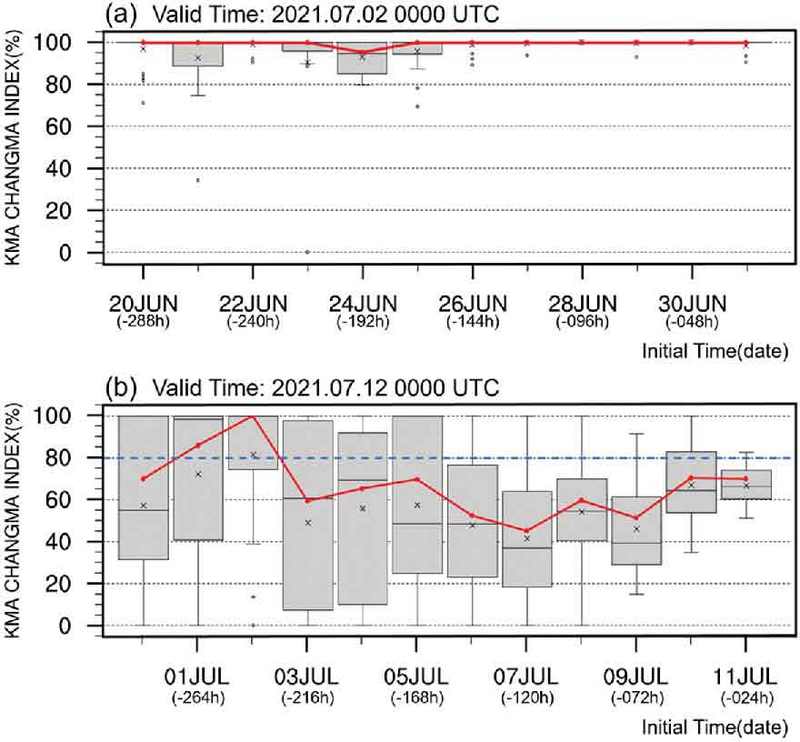
Box plots of the Korean Meteorological Administration (KMA) Changma Index (CMI) forecasts using the Korean Integrated Model (KIM). The forecasts are initialized at 24-hour intervals from -288 h to -024 h before the validation time. Panel (a) shows forecasts for the Changma onset date (2 July 2021, 0000 UTC), while panel (b) shows forecasts for the day after the Changma withdrawal date (12 July 2021, 0000 UTC). The red solid line indicates the ensemble mean. The box plots (gray boxes) represent the distribution of individual ensemble members, where the box extends from the 25th to 75th percentiles, with a line at the median. The whiskers extend to the most extreme data points not considered outliers, and outliers are plotted as individual points. The ‘x’ marks within the boxes indicate the mean of the ensemble members. In panel (b), the blue dashed line at 80% CMI indicates the threshold for determining the Changma withdrawal.
5. 요약 및 결론
본 연구에서는 KIM 앙상블 예측 자료와 CMI를 활용하여 2021년 장마 사례의 시종일 예측 성능을 분석하였다. 주요 결과는 다음과 같다.
CMI 분석 결과, 2021년 장마의 시작일과 종료일은 각각 7월 2일, 7월 11일로 진단되었다. KIM 앙상블 예측 자료를 이용한 CMI 분석에서, 앙상블 평균이 개별 앙상블 멤버보다 더 정확한 예측 성능을 보였다. 이는 앙상블 평균이 장마기간에 형성되는 종관 패턴을 더 잘 반영함을 시사한다. 앙상블 평균 CMI는 장마 시작일을 12일 전 초기장에서 하루 오차로(Figs. 3a, 4a), 장마 종료 시점 다음 날을 9일 전 초기장에서 정확하게 예측하였다(Figs. 6b, 7b). CMI 구성 변수 분석 결과, 200 hPa 지위고도(GPH200start, GPH200end)가 장마 시종일 예측에 중요한 역할을 하는 것으로 나타났다. 특히, 장마 시작일에는 GPH200start가, 종료일 예측에는 GPH200end가 주요한 영향을 미쳤다(Figs. 5a, 8c). 이는 상층 대기의 지위고도 변화가 장마의 시작과 종료를 결정하는 데 핵심적인 역할을 한다는 것을 보여준다. 장마의 특성이 강화되면서 모델이 비교적 긴 예측시간에 대해 일관적인 CMI를 모의하는 것으로 나타났다. 또한, 장마 종료 이후 북태평양 고기압과 티베트 고기압의 북상을 모델이 잘 모의하고 있음을 확인하였다. 장마를 대표하는 직접적인 강수량을 활용한 PCC와 비교 분석한 결과, CMI가 장마 시작일은 약 11일, 종료일은 약 4일 더 이른 시점에 정확한 예측이 가능을 보였다. PCC 분석에서는 장마 시작일보다 종료일에 대한 예측 성능이 더 우수하게 나타났는데, 이는 장마 종료 시 강수가 없는 패턴이 형성되어 예측이 용이해지기 때문으로 해석된다. 반면, CMI는 상층 대기의 변수를 이용하여 장마의 종관적인 특성을 직접적으로 반영하므로, 시작일과 종료일 모두에서 더 안정적이고 빠른 예측이 가능한 것으로 나타났다.
본 연구의 한계점으로는 2021년 단일 사례만을 분석하여 다양한 장마 패턴에 대한 일반화가 어렵다는 점과, 850 hPa 상당온위, 수분 플럭스 등 장마와 관련된 다른 중요 변수들을 종합적으로 고려하지 않았다는 점이 있다(Seo et al., 2011; KMA, 2022). 향후 연구에서는 이러한 한계점을 극복하기 위해 다양한 과거 장마 사례에 대한 CMI 방법의 적용 가능성 검증, KIM 앙상블 예측 자료의 특성을 고려한 개선된 CMI 정의, 그리고 하층 대기 변수들을 포함한 종합적인 장마 분석 방법 개발이 필요하다.
결론적으로, 본 연구에서 제시한 CMI를 활용한 장마 시종일 예측 방법은 기존 방법들의 한계를 극복하고 더 정확하고 조기의 예측을 가능케 한다. 이는 수자원 관리, 농업 계획, 재해 예방 등 다양한 분야에서 중요한 의사결정 도구로 활용될 수 있을 것이다. 향후 추가적인 연구와 개선을 통해, 본 연구의 결과가 한반도 장마 예측 능력 향상에 실질적으로 기여할 수 있기를 기대한다.
Acknowledgments
본 연구는 국립부경대학교 자율창의학술연구비(2024년)에 의하여 연구되었음. 또한, 본 연구는 기상청 수치모델링센터에서 한국형앙상블모델(KIM) 자료를 제공받아 수행되었음.
REFERENCES
-
Chevuturi, A., A. G. Turner, S. J. Woolnough, G. M. Martin, and C. MacLachlan, 2019: Indian summer monsoon onset forecast skill in the UK Met Office initialized coupled seasonal forecasting system (GloSea5-GC2). Climate Dyn., 52, 6599-6617.
[https://doi.org/10.1007/s00382-018-4536-1]

-
Chevuturi, A., A. G. Turner, S. Johnson, A. Weisheimer, J. K. P. Shonk, T. N. Stockdale, and R. Senan, 2021: Forecast skill of the Indian monsoon and its onset in the ECMWF seasonal forecasting system 5 (SEAS5). Climate Dyn., 56, 2941-2957.
[https://doi.org/10.1007/s00382-020-05624-5]

-
Choi, S.-J., and S.-Y. Hong, 2016: A global non-hydrostatic dynamical core using the spectral element method on a cubed-sphere grid. Asia-Pac. J. Atmos. Sci., 52, 291-307.
[https://doi.org/10.1007/s13143-016-0005-0]

-
Chu, J.-E., S. N. Hameed, and K.-J. Ha, 2012: Nonlinear, intraseasonal phases of the East Asian summer monsoon: Extraction and analysis using self-organizing maps. J. Climate, 25, 6975-6988.
[https://doi.org/10.1175/JCLI-D-11-00512.1]

-
Dee, D. P., and Coauthors, 2011: The ERA‐Interim reanalysis: Configuration and performance of the data assimilation system. Quart. J. Roy. Meteor. Soc., 137, 553-597.
[https://doi.org/10.1002/qj.828]

-
Dong, G., H. Zhang, A. Moise, L. Hanson, P. Liang, and H. Ye, 2015: CMIP5 model-simulated onset, duration and intensity of the Asian summer monsoon in current and future climate. Climate Dyn., 46, 355-382.
[https://doi.org/10.1007/s00382-015-2588-z]

- Ha, K.-J., K.-S. Yun, J.-G. Jhun, and C.-K. Park, 2005: Definition of onset/retreat and intensity of Changma during the boreal summer monsoon season. J. Korean Meteor. Soc., 41, 927-942 (in Korean with English abstract).
-
Hersbach, H., and Coauthors, 2020: The ERA5 global reanalysis. Quart. J. Roy. Meteor. Soc., 146, 1999-2049.
[https://doi.org/10.1002/qj.3803]

-
Ho, C.-H., J.-Y. Lee, M.-H. Ahn, and H.-S. Lee, 2003: A sudden change in summer rainfall characteristics in Korea during the late 1970s. Int. J. Climatol., 23, 117-128.
[https://doi.org/10.1002/joc.864]

-
Hong, S.-Y., and Coauthors, 2018: The Korean Integrated Model (KIM) system for global weather forecasting. Asia-Pac. J. Atmos. Sci., 54, 267-292.
[https://doi.org/10.1007/s13143-018-0028-9]

- Huffman, G. J., D. T. Bolvin, and E. J. Nelkin, 2015: Day 1 IMERG final run release notes. NASA/GSFC: Greenbelt, MD, USA, 9 pp.
-
Kang, J.-H., and Coauthors, 2018: Development of an observation processing package for data assimilation in KIAPS. Asia-Pac. J. Atmos. Sci., 54, 303-318.
[https://doi.org/10.1007/s13143-018-0030-2]

- KMA, 2011: 2011 White Paper on Changma. Korea Meteorological Administration, 266 pp (in Korean).
- KMA, 2012: Handheld forecasting; Stationary Fronts. Korea Meteorological Administration, 15, 12 pp (in Korean).
- KMA, 2021: 2021 Abnormal Climate Report. Korea Meteorological Administration, 234 pp (in Korean).
- KMA, 2022: 2022 White Paper on Changma. Korea Meteorological Administration, 394 pp (in Korean).
- KMA NMC, 2022: Verification of numerical weather forecasting system. Korea Meteorological Administration Numerical Modeling Center (in Korean).
- Kwon, S.-H., K.-O. Boo, S. Shim, and Y.-H. Byun, 2017: Evaluation of the East Asian summer monsoon season simulated in CMIP5 models and the future change. Atmosphere, 27, 133-150.
-
Lau, K.-M., and M.-T. Li, 1984: The monsoon of East Asia and its global associations—A survey. Bull. Amer. Meteor. Soc., 65, 114-125.
[https://doi.org/10.1175/1520-0477(1984)065<0114:TMOEAA>2.0.CO;2]

-
Lee, S.-E., and K.-H. Seo, 2013: The development of a statistical forecast model for Changma. Wea. Forecasting, 28, 1304-1321.
[https://doi.org/10.1175/WAF-D-13-00003.1]

- Seo, K.-H., J.-H. Son, and J.-Y. Lee, 2011: A new look at Changma. Atmosphere, 21, 109-121.
-
Wang, B., J.-G. Jhun, and B.-K. Moon, 2007: Variability and singularity of Seoul, South Korea, rainy season (1778~2004). J. Climate, 20, 2572-2580.
[https://doi.org/10.1175/JCLI4123.1]

-
Wang, B., and LinHo, 2002: Rainy season of the Asian Pacific summer monsoon. J. Climate, 15, 386-398.
[https://doi.org/10.1175/1520-0442(2002)015<0386:RSOTAP>2.0.CO;2]

-
Yong, B., D. Liu, J. J. Gourley, Y. Tian, G. J. Huffman, L. Ren, and Y. Hong, 2015: Global view of real-time TRMM multisatellite precipitation analysis: Implications for its successor global precipitation measurement mission. Bull. Amer. Meteor. Soc., 96, 283-296.
[https://doi.org/10.1175/BAMS-D-14-00017.1]

Appendix
SUPPLEMENTARY
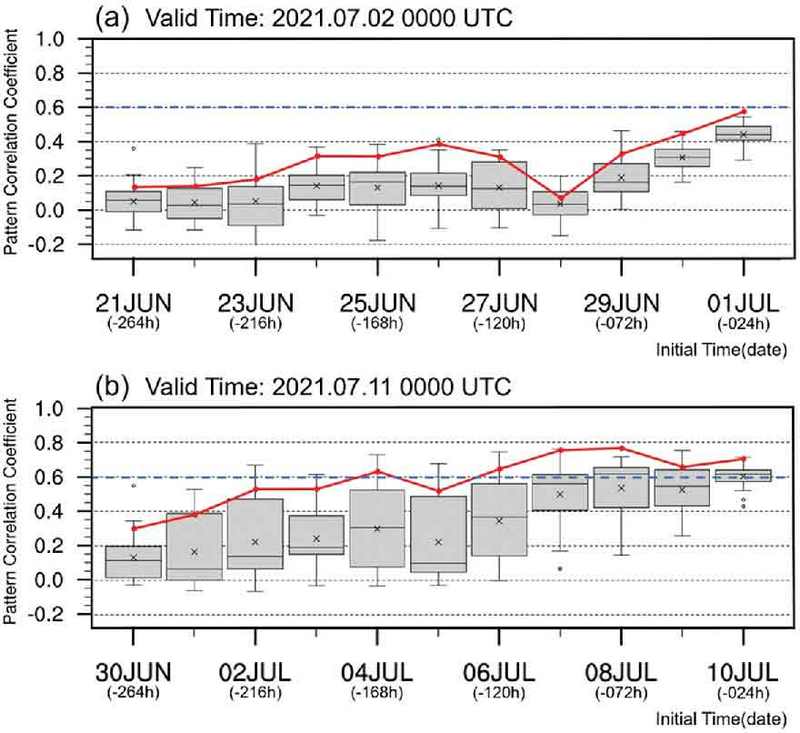
Box plots of daily accumulated precipitation Pattern Correlation Coefficient (PCC) using the Korean Integrated Model (KIM). The model starts at initial times of -024 h and extends to -264 h at 24-hour intervals, focusing on the validation time centered around Changma onset date of 2 July 2021 (a) and Changma withdrawal date of 11 July 2021 (b). The red solid line indicates the ensemble mean. The box plots (gray boxes) represent the distribution of individual ensemble members, where the box extends from the 25th to 75th percentiles, with a line at the median. The whiskers extend to the most extreme data points not considered outliers, and outliers are plotted as individual points. The ‘x’ marks within the boxes indicate the mean of the ensemble members. The PCC region encompasses the vicinity of the Korean Peninsula (25o-45oN, 110o-140oE), and the significance scale of 0.6 (blue dashed line) assesses the statistical significance.
