최근 동아시아 여름몬순과 북서태평양 여름몬순의 관계 변화
Ⓒ 2024 Korean Meteorological Society
Abstract
It has been recognized that interannual relationship between Northeast Asian and western North Pacific (WNP) summer monsoon intensities has a negative correlation with a statistical significance. This teleconnection can be understood by the responses to the stationary Rossby wave, which is forced by variability of the western North Pacific summer monsoon intensity. In addition, the relationship between two monsoon intensities have a large variability on decadal time-scale associated with adjacent climate variability. The study for the recent changes in these long-term relationships has not been reported so far. This study suggests the recent relationship between Northeast Asian and WNP summer monsoons with an extension of the analysis period in the previous studies. Based on the reanalysis datasets, this study also shows atmospheric teleconnection changes associated with El Nino in summertime during the different decadal periods. This study also suggests the possible reasons for the analysis results in terms of teleconnection changes.
Keywords:
Northeast Asian summer monsoon, WNP summer monsoon, Decadal variability, Teleconnection1. 서 론
아시아 여름 몬순(Asian summer monsoon)은 강수에 의한 열적 강제력을 통하여 아시아 지역은 물론 전지구적인 수문순환(hydrological cycle)에 영향을 준다(예, Wang et al., 2001). 이러한 아시아 여름 몬순은 서태평양 지역까지 확장하여 서로 구분되는 세 가지 몬순시스템으로 나뉜다(Wang and LinHo, 2002). 그것은 동아시아 여름 몬순, 인도 여름 몬순, 그리고 북서태평양 여름 몬순이다. 이 세 가지 지역적 몬순시스템은 각각 강한 경년 변동성(interannual variability)을 가지며, 서로 다른 몬순시스템에 영향을 줄 수 있다(예, Ding and Wang, 2005).
북반구 여름철 필리핀 주변의 대기의 깊은 대류활동(deep convective activity)은 정체 로스비파(stationary Rossby wave)를 통해 동아시아 지역을 비롯한 주변 지역에 원격상관(teleconnection) 패턴을 형성시킨다(Nitta, 1987; Wang et al., 2001; Kwon et al., 2007). 이러한 원격상관은 동아시아 여름 몬순의 강도와 북서태평양 여름 몬순 강도가 서로 음의 상관성을 갖게한다.
Kwon et al. (2005)는 동아시아 여름 몬순의 강도와 북서태평양 여름 몬순의 강도의 음의 상관성이 1990년대 중반 이후 큰 폭으로 증가했음을 보였다. 또한 그들은 두 몬순 시스템의 음의 상관성 증가는 북서태평양 여름 몬순 원격상관 패턴 변화에 따라 나타났다는 것을 보였다. Yim et al. (2008)은 이러한 원격상관 패턴의 변화가 1990년대 중반 이후 증가된 중태평양 엘니뇨와 관련된 변동성에 기인한다고 설명하였다. 본 연구에서는 2000년대 중반까지인 선행연구의 분석기간을 2023년까지 확장하여 북서태평양 여름 몬순과 동아시아 여름 몬순의 강도의 변화를 살펴보고 그 가능한 이유를 제시하고자 한다.
2. 자 료
강수 자료로 NOAA (National Oceanic and Atmospheric Administration) CPC (Climate Prediction Center)의 CMAP (CPC Merged Analysis of Precipitation) 월별 자료를 사용하였다. CMAP 자료의 수평 해상도는 경도 2.5o, 위도 2.5o이다(Xie and Arkin, 1997). 해수면온도 자료로 NCEP (National Center for Environmental Prediction)의 OI (Optimum Interpolation) 재분석자료가 활용되었다(Reynolds and Smith, 1994). 해수면온도의 수평 해상도는 경도 2.0도, 위도 2.0도이다. 지위고도 등 대기 순환에 대한 자료로 NCEP-NCAR (National Center for Environmental Prediction-National Center for Atmospheric Research) 재분석자료가 활용되었다(Kalnay et al., 1996). 수평해상도는 경도와 위도 2.5도이다. 분석 기간은 1979년부터 2023년까지의 45년이고, 모든 자료는 기후 평균값이 제거된 편차의 6~8월 평균값을 사용하였다.
3. 결 과
3.1 북서태평양 여름몬순과 동아시아 여름몬순의 상관성 변화
여름 몬순 강도의 경년 변동성을 지수화는 여름 몬순 시스템의 복잡성으로 인하여 바람, 강수 등을 이용한 많은 선행연구들이 있어 왔다(예, Webster and Yang, 1992; Wang and Fan, 1999). 본 연구에서는 동아시아 지역 여름철 여름 몬순을 대표할 수 있는 지수로 강수에 기반한 동아시아 여름 강수 편차 지수(East Asian Summer Rainfall Anomalies, EASRA)를 이용하였고(Lee et al., 2005), 북서태평양 지역 여름 몬순을 대표할 수 있는 지수로 북서태평양 여름 강수 편차 지수(Western North Pacific Rainfall Anomalies, WNPRA)를 이용하였다(Kwon et al., 2005). 동아시아 여름 강수 편차 지수는 동아시아 지역(115oE-150oE, 30oN-50oN) 평균한 여름철 강수편차로 정의되고, 북서태평양 여름 강수 편차 지수는 북서태평양 지역(120oE-150oE, 10oN-20oN) 평균한 여름철 강수편차로 정의된다.
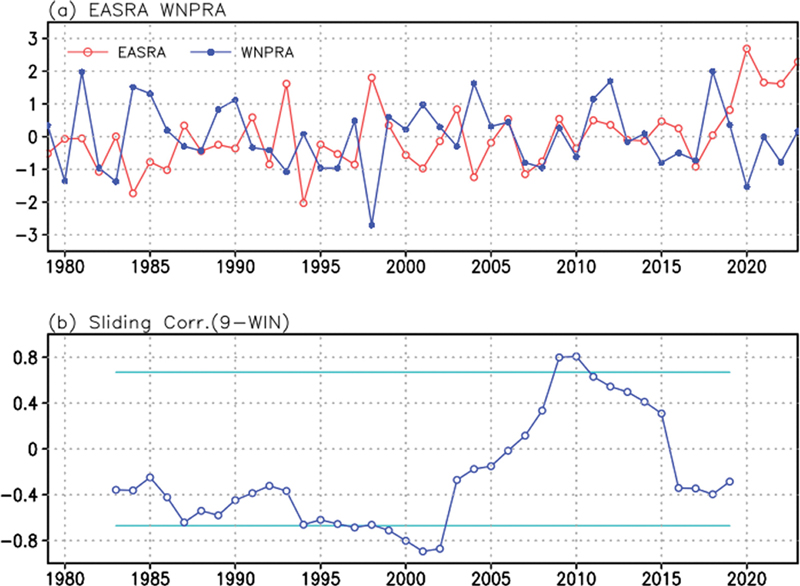
Figure 1은 두 지수의 시간에 따른 변화와 상관성의 변화를 보인다. 두 지수의 전체 기간 즉, 1979년부터 2023년까지에 대한 상관계수는 약 -0.31로서 각 지수를 확률변수로 가정했을 때, 95% 신뢰수준에서 통계적으로 유의미한 음의 상관성을 갖는다. 그러나 주어진 기간에 따라 두 지수의 매우 큰 상관성 변동이 나타난다. 선행연구의 결과에서와 마찬가지로 1990년대 중반 전후로 두 지수의 음의 상관성은 증가하였으나, 2000년대 중반 이후 두 지수는 양의 상관성으로 바뀌었다. 2005년에서 2017년까지에 대한 두 지수의 상관계수는 약 0.61이다. 한편, 2018년 이후 2023년까지 두 지수의 상관계수는 약 -0.86이다. 이러한 관측적인 결과는 두 몬순 시스템의 관계가 십년 시간 규모에서 큰 폭으로 변동하고 있음을 제시한다.

(a) Normalized WNPRA (Western North Pacific Rainfall Anomaly), and EASRA (East Asian Summer Rainfall Anomaly) are represented by closed and open circles, respectively. (b) Sliding correlation coefficients between WNPRA and EASRA in a open circle with a window of 9 years. The horizontal line represents the significance level at 95%, determined by the t-test.
3.2 북서태평양 원격상관의 변화
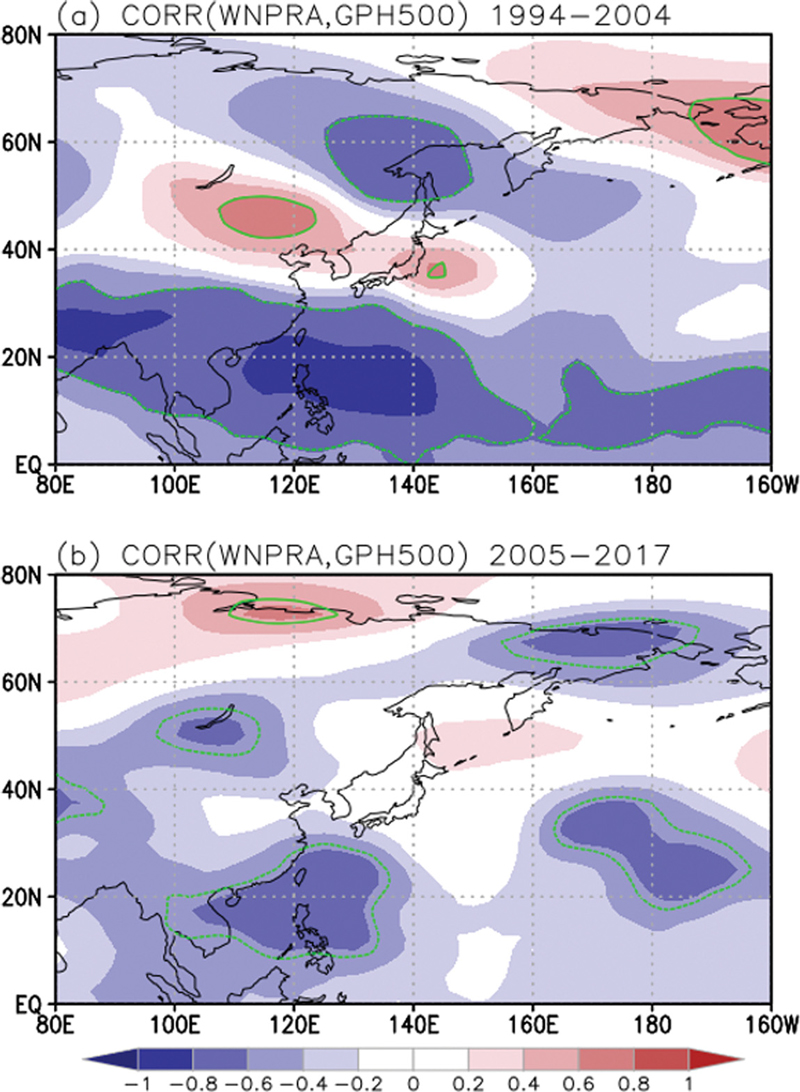
북서태평양 강수 편차 지수(WNPRA)와 동아시아 여름 강수 편차 지수(EASRA)의 음의 상관성은 북서태평양 원격상관에 의해 나타날 수 있다. Figure 2는 WNPRA와 중층 기압 편차의 상관도를 보이는데, 1994~2004 기간에 대해 북서태평양에서 동아시아 그리고 북미 대륙에 이르는 원격상관 패턴을 뚜렷이 볼 수 있다(Fig. 2a). 여름철 이 원격상관 패턴은 북서태평양 원격상관 패턴(Wang et al., 2001) 및 태평양-일본 패턴(Nitta, 1987)으로 인용된다. 이 패턴에서 한반도를 포함하는 동아시아 지역은 북서태평양 강수가 증가할 때 고기압 편차를 갖는다. 이러한 고기압 편차는 동아시아 지역에서 발달하는 대류활동을 억제하여 그 지역의 강수량을 감소시킬 수 있다.

Maps of correlation coefficients between JJA (June, July, and August)‐mean geopotential height anomaly at 500 hPa and the WNPRA during the periods (a) 1994~2004, and (b) 2005~2017. The 95% confidence level is indicated by a green dashed line.
그러나 2005~2017 기간에서는 북서태평양 강수의 증감에 따른 북서태평양 원격상관 혹은 태평양-일본패턴이 잘 나타나지 않는다(Fig. 2b). 이에 따라 북서태평양 강수의 증가에 따라 동아시아 지역에 고기압 편차가 나타나지 않아 그 지역의 강수는 억제되지 않는다. 오히려 그 시기 WNPRA와 EASRA는 양의 상관성을 갖는다. Yim et al. (2008)에 따르면, 북서태평양 원격상관 패턴은 중태평양 엘니뇨(Central Pacific El Nino; Kao and Yu, 2009) 변동에 따라 나타나고, 태평양-일본 원격상관 패턴은 동태평양 엘니뇨(Eastern Pacific El Nino) 변동에 따라 나타난다. 1994~2004 기간에서 나타나는 동아시아 지역의 고기압 패턴은 두 원격상관 패턴의 결과로 나타날 수 있다(Fig. 2a). 특히, 한반도 북서쪽 고기압 패턴은 북서태평양 원격상관 패턴의 결과이고, 일본 동쪽의 고기압 패턴은 태평양-일본 원격상관 패턴의 결과로 보인다(Kwon et al., 2005). 그러나 2005~2017 기간에는 이 두 가지 원격상관 패턴이 모두 분명하게 나타나지 않는다(Fig. 2b).
3.3 북서태평양 원격상관의 변화
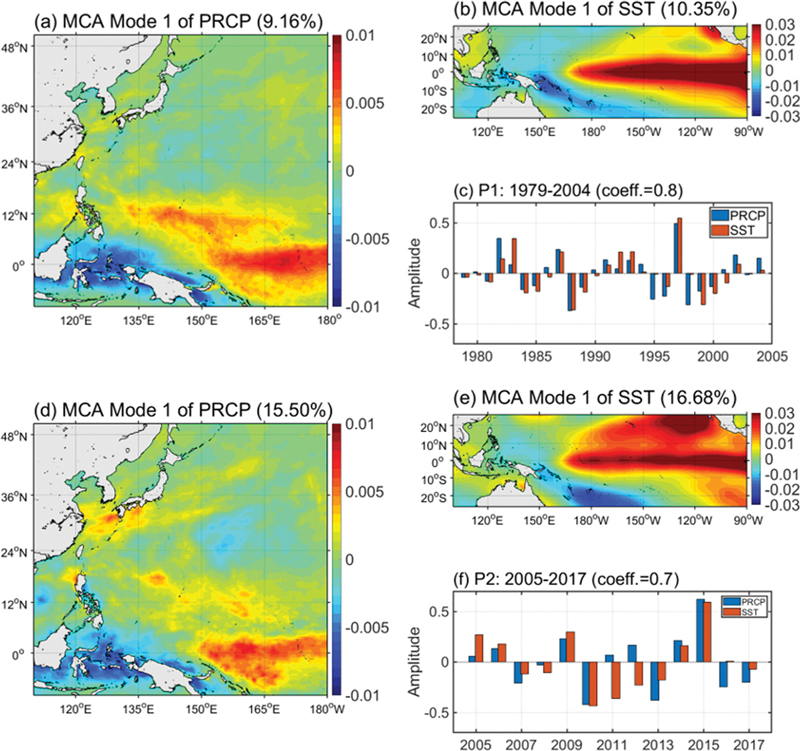
1979 년부터 2004 년까지 기간 동안 북서태평양 여름철 강수량 편차와 열대중태평양 해수면온도 편차의 MCA (Maximum Covariance Analysis) 분석 결과, 첫번째 결합모드 패턴은 열대동태평양 지역에 강한 해수면온도 편차를 갖는 동태평양 엘니뇨 모드(Eastern Pacific El Nino mode)로 분석된다(Fig. 3b; Yim et al., 2008). 동태평양 엘니뇨에 의해 형성된 북서태평양 지역 강수 패턴은 태평양-일본 원격상관 패턴(Pacific-Japan teleconnection) 패턴을 유도하며, 북서태평양 지역 강수편차와 동아시아 지역강수편차가 음의 상관성을 갖게 한다(예, Nitta, 1987). 반면에 2005년부터 2017년까지 같은 분석에서는 첫 번째 결합모드가 전형적인 엘니뇨 패턴과는 차이를 보인다. 즉, 열대지역은 동태평양 엘니뇨 패턴과 유사하고, 열대 지역에서 최대 편차가 나타나는 정점 위치도 큰 차이를 보이지 않는다(Fig. 3e). 그러나, 중태평양 아열대 지역에서 큰 편차를 갖는 패턴이 보인다. 이 아열대 지역 패턴은 태평양 남북모드(Pacific Meridional Mode, PMM) 패턴과 유사하다(Chiang and Vimont, 2004). 이 아열대 모드에 의해 변형되어 나타나는 엘니뇨는 태평양-일본 원격상관패턴을 유도하는 강수편차 패턴을 유도하지 못하는 것으로 보인다(Fig. 3d). 이 시기 엘니뇨 혹은 라니냐가 태평양-남북모드와 결합되어 나타나는 이유는 분명하지는 않지만, 일반적으로 엘니뇨 모드와 태평양-남북모드는 서로 영향을 주며 나타날 수 있다(Stuecker, 2018).

Spatial patterns of the first mode of the maximum covariance analysis between summer mean precipitation over the region 10oS-50oN, 110oE-180o and summer-mean tropical Pacific SST over the region 20oS-20oN, 130oE-90oW for (a) precipitation, (b) SST, and (c) corresponding time series in the period 1979~2004. (d, e, and f) Same as Fig. 1a-c, respectively, except for the period 2005~2017.
4. 결론 및 토의
본 연구노트는 선행연구(Kwon et al., 2005) 기간의 확장으로 2000년대 중반 이후 북서태평양 여름 몬순의 강도와 동아시아 여름 몬순 강도 상관성의 변화에 대하여 기술되었다. 약 십년 정도의 시간 규모에서 두 몬순 강도는 1980년대부터 2000년대 중반까지 음의 상관관계가 있고, 2000년대 중반 이후 양의 상관성이 있으며, 2010년대 중후반 다시 음의 상관성이 있다.
이러한 두 몬순 강도의 상관성 변화는 북서태평양 원격상관의 변화로 이해될 수 있다. 두 몬순이 음의 상관성이 있는 시기에는 북서태평양 원격상관이 뚜렷하게 나타나지만, 그렇지 않은 시기, 특히 2005년부터 2017년까지는 이러한 원격상관 패턴이 분명하게 나타나지 않는다. 이 시기 북서태평양으로부터 동아시아 지역에 이르는 원격상관은 단일한 원격상관 패턴으로 설명되기는 어렵다. 그러나 이러한 원격상관 패턴 변화를 설명할 수 있는 가능한 이유 중 하나는 북서태평양 강수 변동과 관련된 주요한 모드가 태평양 남북 모드에 의해 변조된 중태평양 엘니뇨 모드라는 것이다. 이 모드는 2005~2017 시기에 북서태평양 여름몬순의 강도와 동아시아 여름몬순의 강도가 양의 상관관계에 있다는 것을 어느 정도 설명할 수 있다. 그러나 이 모드가 뚜렷한 기간이 비교적 짧아 이 시기를 설명할 수 있는 원격상관 패턴을 통계적 특정하는 것은 어렵기 때문에 이 모드만으로 원격상관 변화를 설명하는 것은 다소 한계가 있다.
두 몬순의 장주기적인 관련성 변동에 관한 이해는 기후모형을 활용한 추가 분석이 요구되지만, 현재 수준(the-state-of-the-art)의 기후모형에서 모의되는 북서태평양 원격상관 패턴이 관측과는 다소 차이를 보여 기후모형을 활용한 북서태평양 원격상관 연구는 제한적이다. 그렇지만, 여름철 복합적인 북서태평양 원격상관 패턴 변동을 이해하기 위해서는 장기적분된 기후모델에서 나타나는 북서태평양 아열대 기후모드 변동에 대한 후속 연구가 요구된다.
Acknowledgments
본 논문의 개선을 위해 좋은 의견을 제시해 주신 두 분의 심사위원께 감사를 드립니다. 본 논문은 2024년 기상청 기후예측과의 지원(PG54280, 최근 변화하는 기후특성을 반영한 역학-통계모델 기반의 기압계 패턴 예측 기술 개발), 한국해양과학기술원의 지원(PO0147A, 해양기후예측센터 운영), 그리고 2024년도 해양수산부 재원으로 해양수산과학기술진흥원의 지원(20220566, 북서태평양 온난화 진단 및 한반도 영향 태풍발생·급강화 연구)을 받아 수행된 연구입니다.
REFERENCES
- Chiang, J. C. H., and D. J. Vimont, 2004: Analogous meridional modes of atmosphere-ocean variability in the tropical Atlantic and tropical Pacific. J. Climate, 17, 4143-4158.
-
Ding, Q., and B. Wang, 2005: Circumglobal teleconnection in the Northern Hemisphere summer. J. Climate, 18, 3483-3505.
[https://doi.org/10.1175/JCLI3473.1]

-
Kalnay, E., and Coauthors, 1996: The NCEP/NCAR 40-year reanalysis project. Bull. Amer. Meteor. Soc., 77, 437-472.
[https://doi.org/10.1175/1520-0477(1996)077<0437:TNYRP>2.0.CO;2]

-
Kao, H.-Y., and J. Y. Yu, 2009: Contrasting Eastern-Pacific and Central-Pacific types of ENSO. J. Climate, 22, 615-632.
[https://doi.org/10.1175/2008JCLI2309.1]

-
Kwon, M., J.-G. Jhun, B. Wang, S.-I. An, and J.-S. Kug, 2005: Decadal change in relationship between East Asian and WNP summer monsoons. Geophys. Res. Lett., 32.
[https://doi.org/10.1029/2005GL023026]

-
Kwon, M., J.-G. Jhun, and K.-J. Ha, 2007: Decadal change in East Asian summer monsoon circulation in the mid-1990s. Geophys. Res. Lett., 34.
[https://doi.org/10.1029/2007GL031977]

-
Lee, E.-J., J.-G. Jhun, and C.-K. Park, 2005: Remote connection of the East-Asian summer rainfall variation revealed by a newly defined monsoon index. J. Climate, 18, 4381-4393.
[https://doi.org/10.1175/JCLI3545.1]

-
Nitta, T., 1987: Convective activities in the tropical western Pacific and their impact on the Northern Hemisphere summer circulation. J. Meteor. Soc. Japan, 65, 373-390.
[https://doi.org/10.2151/jmsj1965.65.3_373]

-
Reynolds, R. W., and T. M. Smith, 1994: Improved global sea surface temperature analysis using optimum interpolation. J. Climate, 7, 929-948.
[https://doi.org/10.1175/1520-0442(1994)007<0929:IGSSTA>2.0.CO;2]

-
Stuecker, M. F., 2018: Revisiting the Pacific Meridional Mode. Sci. Rep., 8, 3216.
[https://doi.org/10.1038/s41598-018-21537-0]

-
Wang, B., and Z. Fan, 1999: Choice of south Asian summer monsoon indices. Bull. Amer. Meteor. Soc., 80, 629-638.
[https://doi.org/10.1175/1520-0477(1999)080<0629:COSASM>2.0.CO;2]

-
Wang, B., R. Wu, and K.-M. Lau, 2001: Interannual variability of the Asian summer monsoon: contrasts between the Indian and the western North Pacific-East Asian monsoons. J. Climate, 14, 4073-4090.
[https://doi.org/10.1175/1520-0442(2001)014<4073:IVOTAS>2.0.CO;2]

-
Wang, B., and LinHo, 2002: Rainy season of the Asian-Pacific summer monsoon. J. Climate, 15, 386-398.
[https://doi.org/10.1175/1520-0442(2002)015<0386:RSOTAP>2.0.CO;2]

-
Webster, P. J., and S. Yang, 1992: Monsoon and ENSO: Selectively interactive systems. Quart. J. Roy. Meteor. Soc., 118, 877-926.
[https://doi.org/10.1002/qj.49711850705]

-
Xie, P., and P. A. Arkin, 1997: Global precipitation: A 17-year monthly analysis based on gauge observations, satellite estimates, and numerical model outputs. Bull. Amer. Meteor. Soc., 78, 2539-2558.
[https://doi.org/10.1175/1520-0477(1997)078<2539:GPAYMA>2.0.CO;2]

-
Yim, S.-Y., J.-G. Jhun, and S.-W. Yeh, 2008: Decadal change in the relationship between East Asian-western North Pacific summer monsoons and ENSO in the mid-1990s. Geophys. Res. Lett., 35, L20711.
[https://doi.org/10.1029/2008GL035751]
