구름미세물리 모수화 방안 내 빗방울의 특성을 정의하는 매개변수가 한반도 여름철 강수 모의에 미치는 영향
Ⓒ 2024 Korean Meteorological Society
Abstract
The study examines the effects of parameters that define the characteristics of raindrops on the simulated precipitation during the summer season over Korea using the Weather Research and Forecasting (WRF) Double-Moment 6-class (WDM6) cloud microphysics scheme. Prescribed parameters, defining the characteristics of hydrometeors in the WDM6 scheme such as aR, bR, and fR in the fall velocity (VR) - diameter (DR) relationship and shape parameter (μR) in the number concentration (NR) - DR relationship, presents different values compared to the observed data from Two-Dimensional Video Disdrometer (2DVD) at Boseong standard meteorological observatory during 2018~2019. Three experiments were designed for the heavy rainfall event on August 8, 2022 using WRF version 4.3. These include the control (CNTL) experiment with original parameters in the WDM6 scheme; the MUR experiment, adopting the 50th percentile observation value for μR; and the MEDI experiment, which uses the same μR as MUR, but also includes fitted values for aR, bR, and fR from the 50th percentile of the observed VR - DR relationship. Both sensitivity experiments show improved precipitation simulation compared to the CNTL by reducing the bias and increasing the probability of detection and equitable threat scores. In these experiments, the raindrop mixing ratio increases and its number concentration decreases in the lower atmosphere. The microphysics budget analysis shows that the increase in the rain mixing ratio is due to enhanced source processes such as graupel melting, vapor condensation, and accretion between cloud water and rain. Our study also emphasizes that applying the solely observed μR produces more positive impact in the precipitation simulation.
Keywords:
WDM6, 2DVD, Raindrops, Parameter, Summer precipitation1. 서 론
수치 모델의 격자 간격이 감소함에 따라 격자 내 구름의 발달과 진화의 명시적인 표현이 가능해졌으며(Stensrud, 2009), 이러한 격자 규모의 미세물리 과정 및 강수의 예측은 구름미세물리 모수화 방안을 통해 이루어진다. 해당 모수화 방안은 수치 모델의 격자 크기가 임의의 구름보다 작은 경우, 격자 내 상대습도가 100%가 되는 상황에서 구름 및 구름으로부터 동반되는 강수과정을 모수화한다(Lim, 2019). 미세물리과정은 시·공간적 규모가 작기 때문에 관측하기 어려울 뿐만 아니라 수치모델에서 표현하는데 한계가 존재한다(Matsunobu et al., 2022). 구름과 강수 과정에 대한 모수화는 대기 수상의 물리적 특성을 미리 정의된 매개변수를 통해 규정하는데, 이 과정에서 불확실성 또는 오류가 내포될 수 있다(van Lier-Walqui et al., 2012). 대기 수상의 특성을 정의하는 매개변수는 구름미세물리 모수화 방안 내에서 고정되거나 진단된 값으로 처방된다. 이로 인해 지역 및 강수 유형에 따른 매개변수의 변화를 고려해줄 수 없고, 지표 강수 모의 성능을 저하시킬 수 있다. 따라서 대기 수상의 특성을 정의하는 매개변수의 영향을 파악하고 개선하는 연구가 필요하다(Lim, 2020).
빗방울의 특성 중 하나인 낙하 속도(VR)와 직경(DR)관계는 일반적으로 실험 자료에서 직접 도출한 경험적 공식을 사용하거나 물리적인 관계를 근거로 모수화하여 정의한다(Wang et al., 2010). Gunn and Kinzer(1949; 이하 GK49)는 1,013.25 hPa 기압, 20oC 기온 및 50% 상대습도 조건에서 30쌍의 DR과 그에 따라 변화하는 VR을 측정하였다. Liu and Orville (1969; 이하 LO69)는 VR - DR 관계를 최소제곱법을 통해 VR(DR) = 의 형태로 표현하고 매개변수 aR과 bR을 각각 841.9 m1-0.8 s-1와 0.8로 제안하였다. 한편 Kim et al. (2020)은 GK49의 측정 값을 활용하여 DR이 큰 경우 VR이 지수적으로 감소할 수 있도록 VR(DR) = 의 형태로 표현하고, 구름미세물리 모수화 방안에 적용하여 한반도 여름철 지표 강수 모의에 미치는 영향을 분석하였다.
한편 구름미세물리 모수화 방안에서 빗방울의 수농도 크기분포(NR)와 DR의 관계는 보편적 감마 분포 형태로 NR(DR) = N0RDRμRexp(- λRDR)와 같이 표현되며, N0R은 y 절편, λR은 기울기, 그리고 μR은 분포의 형태를 정의하는 매개변수를 의미한다. 지역별, 강수 유형별 NR - DR 관계의 특성에 관한 다양한 연구가 이루어지고 있으며(예, Seela et al., 2021; Mao et al., 2023; Zhang et al., 2023), 관측을 기반으로 한 여러 선행연구에서 μR이 강수 강도와 반비례함을 보였다(Moon et al., 2013; Jash et al., 2019; Ma et al., 2019). 국내에서는 Bang et al. (2017)이 대구 지역에서 2011~2012년 여름철에 관측한 이차원광학우적계(Two-Dimensional Video Disdrometer, 2DVD) 자료와 Marshall and Palmer(1948)에서 제시한 NR - DR 관계의 차이를 통해 대구 지역이 더 높은 액체수함량을 가짐을 보였다. Cha and Yum (2021)은 대관령과 목포 지역의 Parsivel 관측 자료로부터 해양 유형의 강수보다 육지 유형의 강수에서 μR과 λR의 값이 큼을 제시하였다. Lee et al. (2023)은 한반도 우적계 관측 자료를 통해 우수함량을 이용한 N0R의 진단식을 유도하고, Weather Research and Forecasting (WRF) Single-Moment 6-class (WSM6; Hong and Lim, 2006) 구름미세물리 모수화 방안에 진단식을 처방한 실험의 강수 모의 성능이 N0R을 규정된 상숫값으로 처방한 실험 대비 향상됨을 보였다.
벌크형 구름미세물리 모수화 방안 중 하나인 WRF Double-Moment 6-class (WDM6; Lim and Hong, 2010) 방안은 한반도 중규모 강수 현상 모의 연구에 폭넓게 활용되는 방안 중 하나이다. 해당 방안은 다른 여타 구름미세물리 모수화 방안(Morrison et al., 2005; Thompson et al., 2008)과 함께, 대기 수상의 특성, 상세 미세물리과정의 효율, 특정 과정에서 사용되는 임곗값 등을 정의하는 매개변수를 특정 상숫값으로 처방한다. WDM6 방안의 VR - DR 관계는 LO69가 제안한 관계 및 매개변수를 동일하게 차용한다. NR - DR 관계는 보편적 감마 분포를 사용하며, Cohard and Pinty (2000)의 연구를 기반으로 μR의 값은 1을 사용하게 된다. 이와 같이 WDM6 방안에서 VR - DR 및 NR - DR 관계를 정의하기 위해 사용하는 매개변수는 미리 규정된 값으로 처방되므로 여러 지역 및 강수 유형에 따른 빗방울의 특성 변화를 반영할 수 없다. 따라서 강수 모의에 불확실성을 발생시키는 요인으로 작용한다.
빗방울의 특성에 대한 분석 및 관련 매개변수들에 대한 제시가 선행 연구에서 이루어지고, 매개변수가 강수 모의에 미치는 영향에 대한 연구가 일부 진행된 바 있으나, 한반도에서 관측된 빗방울의 특성을 정의하는 모든 매개변수를 구름미세물리 모수화 방안 내에 처방하고 강수 모의에 미치는 영향을 살펴본 연구는 부재한 실정이다. 따라서 본 연구에서는 WDM6 방안을 활용하여 한반도에서 관측된 빗방울의 특성을 구름미세물리 모수화 방안에 적용하였을 때 강수대의 발달과 강수 강도 모의에 미치는 영향을 살펴보고자하였다. 2장 연구방법에서 관측된 빗방울의 특성과 강수 사례, 그리고 실험설계를 설명하고, 3장 연구결과에서 실험결과를 제시하였다. 그리고 4장에서는 요약 및 결론을 기술하였다.
2. 연구방법
2.1 관측된 빗방울의 특성
한반도에서 관측된 빗방울의 VR - DR 관계를 정의하는 매개변수와 NR - DR 관계의 μR을 얻기 위해 2018~2019년 4~11월 동안 보성 표준기상관측소에 설치된 2DVD 자료를 분석하였다. 관측 자료의 품질 관리를 위해 총 31,255분(520시간 상당) 동안 관측된 강수 입자 자료를 Atlas et al. (1973)에서 제안한 VR - DR 관계에서 60% 미만, 140% 이상을 벗어나는 입자는 제거하였다. 최종적으로 분석에 사용한 관측된 빗방울의 수는 총 12,025,359개이며, 해당 관측에서 보이는 VR - DR의 빈도와 NR - DR 관계에서 나타난 μR의 빈도를 표준화하여 Fig. 1에 제시하였다. 표준화한 빈도가 0.02 이상의 값을 보이는 영역을 살펴본 결과, 대부분의 빗방울이 2 mm보다 작은 DR, 8 m s-1보다 작은 VR을 가지며, μR은 0~15 사이의 값을 가지는 것으로 분석되었다. 관측에서 나타난 VR - DR 관계를 VR의 10, 50, 그리고 90 백분위수를 0.1 mm 간격으로 구하고 각각을 VR = 의 형태로 표현하여 기존 WDM6 방안 내 규정된 관계와 함께 Fig. 1a에 제시하였다. 50 백분위수 관계를 기준으로, WDM6 방안은 DR이 0.33 mm 미만인 경우 VR을 과대 추정(최대 0.095 m s-1), 0.33~2.6 mm는 VR을 과소 추정(최소 -0.450 m s-1), 그리고 2.6 mm 이상은 VR을 과대 추정(3 mm에서 0.3 m s-1, 5 mm에서 3.15 m s-1)한다. WDM6 방안에서 VR은 DR에 따라 계속 증가하며 4 mm 이상의 큰 DR에서 10 m s-1 이상의 매우 빠른 VR을 가진다. 50 백분위수 관계는 DR이 5.5 mm일 때 9.04 m s-1의 최대 VR을 가지며, 그 이상에서는 회귀식을 따라 감소하나 해당 DR을 가진 입자가 관측된 빈도는 매우 낮다. 관측된 μR의 경우, 10 백분위수의 값 조차도 WDM6 방안에 규정된 값보다 큰 것을 알 수 있다. 10, 50, 그리고 90 백분위수 관계가 가지는 매개변수를 정리하여 Table 1에 제시하였다. 10, 90 백분위수 관계를 통해 매개변수의 범위를 살펴보면, VR - DR 관계에서 aR은 3,474.71, 5,472.57, bR은 모두 1, 그리고 fR은 164.84, 193.97의 값을 갖는다. NR - DR 관계의 μR은 10, 90 백분위수가 각각 2.479, 15.96의 값을 가진다. 이를 통해 관측된 빗방울의 특성인 VR - DR 관계와 NR - DR 관계를 정의하는 매개변수가 기존 WDM6 방안 내 규정된 값과 상당한 차이를 보임을 알 수 있다.
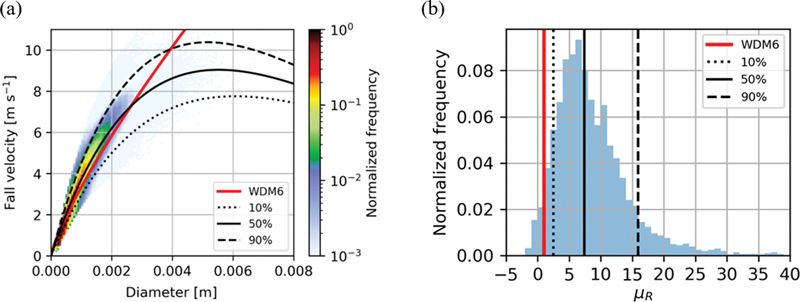
Normalized frequencies of (a) VR - DR and (b) μR using 2DVD observations. The red and black lines in (a)-(b) indicate the relationship of VR - DR and μR defined in WDM6 scheme and observed relationship, respectively. The black-dotted, solid, and dashed lines represent the 10th, 50th, and 90th percentiles from the 2DVD observation.

Parameters defining the rain characteristics such as the fall velocity [m s-1] (VR) - diameter [m] (DR) and number concentration [m-4] (NR) - DR relationships. Values in WDM6 represent the original parameters in WDM6 microphysics scheme. Values for 10th, 50th, and 90th percentile, obtained from Boseong standard weather observatory, are also noted.
2.2 한반도 강수 사례
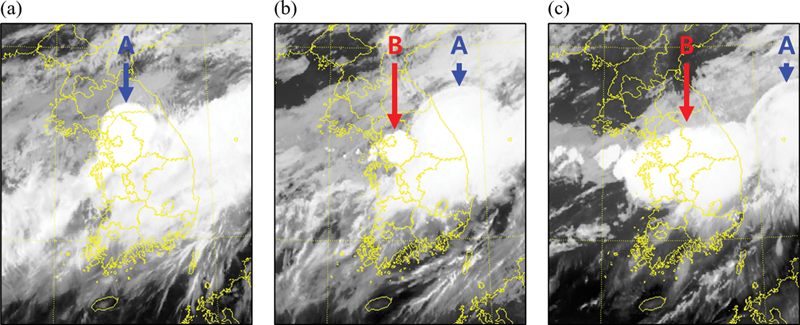
2022년 8월 8일부터 11일까지 한반도 중부지방에 정체전선이 머무르면서 기록적인 집중호우가 발생하였다. 특히 8일에 서울 남부지역을 중심으로 시간당 100 mm 이상의 매우 강한 비가 내렸고(KMA, 2023), 동작구에서는 1300 UTC에 시간당 141.5 mm의 강수를 기록하였다. 여름철 강한 강수를 동반한 사례에서 빗방울의 특성을 정의하는 매개변수가 강수에 미치는 영향을 살펴보기 위해 해당 사례를 적분 사례로 선정하였다. 8월 8일 1200 UTC 지상일기도를 살펴보면 한반도 북서쪽에 위치한 고기압을 통해 차고 건조한 공기가 남하하고, 남동쪽에서 확장된 북서태평양 고기압의 가장자리를 따라 따뜻하고 습한 공기가 유입되어 중부지방에 정체전선이 형성된 것을 확인할 수 있다(Fig. 2a). 자동기상관측 장비(Automatic Weather Station, AWS)에서 관측된 0600~1600 UTC 기간 누적 강수를 0.05o 간격으로 격자화한 공간 분포에서 200 mm 이상의 강한 강수가 서울 남부를 따라 동서로 자리하고 20 mm 이상의 강수가 중부지방에 기록되었음을 알 수 있다(Fig. 2b). 추가적으로 0900, 1200, 그리고 1500 UTC 천리안 2호(GEO-KOMPSAT-2A, GK2A) 적외 영상을 통해 중부지방에서 발달한 주요 강수대의 시간 변화를 살펴보았다(Fig. 3). 분석 기간동안 총 두개의 높게 발달한 구름이 확인되며 이로 인해 강수대가 형성되는데, 본 연구에서는 순서대로 각각 A, B 강수대라고 표현하였다. 0900 UTC 영상을 살펴보면, 한반도 중부와 남부지방을 뒤덮은 구름대가 동서로 길게 분포하며, 높게 발달한 A 강수대가 서울과 경기 지역에 자리하고 있다(Fig. 3a). 1200 UTC에는 점차 동쪽으로 이동한 A 강수대가 동해상에 위치하고 있으며, 새롭게 발달한 B 강수대가 서울과 경기 남부를 중심으로 성장하고 있다(Fig. 3b). 1500 UTC에는 먼저 발달했던 A 강수대가 동해 먼바다로 이동하였고, 뒤늦게 발달한 B 강수대가 한반도 중부지방에 동서로 넓게 자리하고 있음을 확인할 수 있다(Fig. 3c).
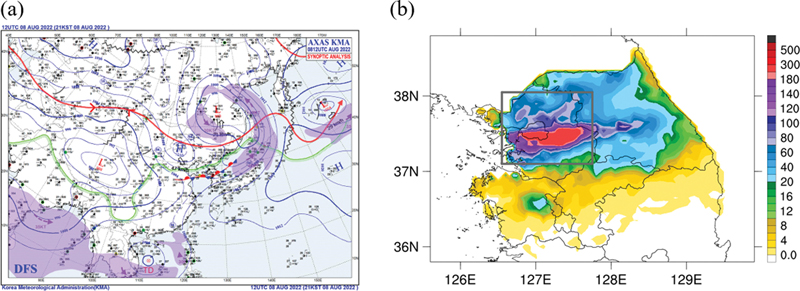
(a) Surface weather chart at 1200 UTC 8 on August 2022 and 10-h accumulated precipitation amount [mm] from AWS observations over the Korean Peninsula from 0600 to 1600 UTC 8 on August 2022. The gray box in b indicates the interest area.
2.3 실험 설계
관측된 빗방울의 특성을 정의하는 매개변수가 수치모델의 강수 모의에 미치는 영향을 살펴보고자 WRF 모델 버전 4.3 (Skamarock et al., 2021)을 사용하여 한반도를 중심으로 9, 3, 그리고 1 km 격자 간격으로 단방향 둥지 격자 방안으로 구성한 실험을 설계하였다(Fig. 4). 모델의 연직 층은 65개의 층으로 구성하였고, 최상층은 50 hPa으로 설정하였다. 모델 적분에 사용된 적운 모수화 방안은 Kain-Fritsch (Kain and Fritsch, 1990; Kain, 2004), 구름미세물리 모수화 방안은 WDM6 (Lim and Hong, 2010), 행성 경계층 모수화 방안은 Yonsei University Scheme (Hong et al., 2006),지표층 모수화는 Monin-Obukhov scheme (Jiménez et al., 2012), 지면 모델은 Unified Noah Land Surface Model (Chen and Dudhia, 2001), 그리고 장파 및 단파 모델은 Rapid Radiative Transfer Model for General Circulation Models (Iacono et al., 2008; Morcrette et al., 2008)이다. 여기서 3 km 이하의 격자 간격을 가지는 영역은 구름 및 강수 과정이 격자 규모 내에서 이루어진다 간주하고 적운 모수화 방안을 사용하지 않았다.
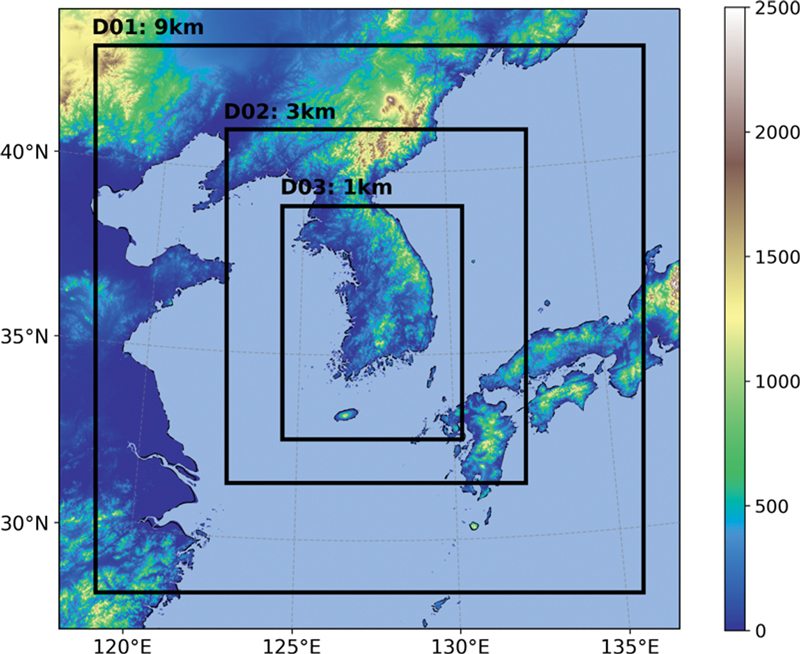
Model domain for the simulations with terrain height [m] (shaded). The black boxes indicate each sub domain.
초기 및 경계 조건은 유럽 중기 예보 센터(European Center for Medium-range Weather Forecasts, ECMWF) 5세대 재분석 자료(ERA5; Hersbach et al., 2020)를 6시간 간격으로 처방하였다. 사용한 물리 과정 및 초기/경계 자료의 정보를 참고문헌과 함께 Table 2에 정리하였다. 모델 적분 기간은 2022년 8월 8일 0000~1600 UTC이며, 스핀 업 시간을 고려하여 0600~1600 UTC를 분석 기간으로 설정하였다. 총 세 개의 실험을 구성하였는데, 기존 WDM6 방안 내 규정된 매개변수를 사용한 실험을 규준실험(CNTL)으로 정의하고, CNTL에서 NR - DR 관계의 μR을 50 백분위수 값으로 변경한 실험을 MUR, 그리고 μR 뿐만 아니라 VR - DR 관계의 aR, bR, 그리고 fR을 50 백분위수 값으로 변경한 실험을 MEDI라고 명명하였다(Table 3). 실험 분석은 가장 높은 해상도를 가지는 1 km 영역의 결과를 사용하였다.
3. 결 과
집중호우가 발생한 한반도 중부지방을 분석 영역으로 하여 CNTL에서 모의된 분석 기간 누적 강수의 공간 분포와 CNTL과 AWS 관측 간 차이, 그리고 각 민감도 실험과 CNTL간 차이를 Fig. 5에 제시하였다. CNTL은 중부지방에 20 mm 이상의 강수대를 관측과 유사하게 모의하나(Figs. 2b, 5a), 100 mm 이상의 강한 강수 중심이 관측 대비 북동쪽에 자리하고, 전반적으로 강수대가 북쪽에 위치하면서 충청도와 경상북도 북부에 나타난 약한 강수를 모의하지 못하였다. CNTL과 AWS의 누적 강수의 차이를 살펴보면(Fig. 5b), 서울 및 경기 지역에서는 음의 오차, 강원도 지역에서는 양의 오차를 보이며 CNTL의 강수대 중심 위치 모의 성능이 떨어지는 것을 알 수 있다. 또한 충청북도 북부에 강수를 모의하여 해당 지역에서 양의 오차를 보인다. 두 민감도 실험과 CNTL을 비교했을 때, 서울 및 경기 중부 지역에서 양의 차이, CNTL에서 100 mm 이상의 강수가 모의된 지역에서 음의 차이를 보이면서 CNTL에서 나타난 중심 위치 오차가 개선되는 것으로 확인된다(Figs. 5c-d). 한편, CNTL에서 나타난 충청북도 북부의 강수는 두 실험 모두 증가하는 것으로 분석되었다.
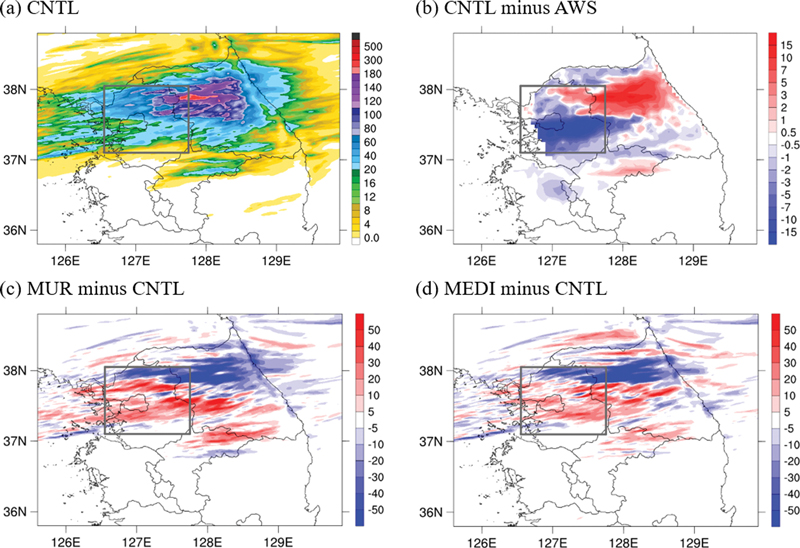
Spatial distribution of 10-h accumulated surface precipitation amount [mm] from 0600 to 1600 UTC 8 on August 2022, obtained from (a) CNTL, and the differences between (b) CNTL and AWS (CNTL minus AWS), (c) MUR and CNTL (MUR minus CNTL), and (d) MEDI and CNTL (MEDI minus CNTL).
정량적인 강수 모의 성능의 변화를 살펴보고자 분석 기간 누적 최대 강수량과 AWS 대비 bias (BIAS), probability of detection (POD), false alarm ratio (FAR), 그리고 equitable threat score (ETS) 통계 점수를 비교하였다(Table 4). 통계 점수 별 계산 방법은 다음과 같다. , 그리고 이고, ETS에서 ar은 무작위 맞힘을 의미하며 이다. 여기서 H는 맞힘(Hit), F는 거짓 알림(False alarm), M은 놓침(Miss), C는 부의 정확(Correct negative)이고 강수 유무를 판별하기 위해 적용한 임곗값은 0.05 mm이다. 분석 기간 매 시각에 대해 계산한 통계 점수의 평균 값을 제시하였다. 각 실험들의 예측 성능을 살펴보면, CNTL의 BIAS는 0.65, POD는 0.51, FAR은 0.20, 그리고 ETS는 0.23으로 나타났고, 두 민감도 실험에서 CNTL 대비 BIAS, POD, 그리고 ETS가 개선되고 FAR은 유사한 것을 확인할 수 있다. 특히 MUR은 BIAS, POD, 그리고 ETS가 각각 6.2%, 5.9%, 그리고 8.7% 개선되면서 가장 좋은 통계 점수를 보였다. 이를 통해 관측된 빗방울의 특성을 정의하는 매개변수를 처방한 경우 서울 및 경기 중부 지역의 강수 오차가 개선되고, H가 증가하면서 통계점수가 향상됨을 알 수 있다. 반면, 최대 강수 강도의 경우 AWS는 293 mm로 나타났으나, CNTL은 235.77 mm, MEDI는 170.05 mm, 그리고 MUR은 143.44 mm 순으로 낮은 강도를 보이는 것을 통해 관측된 매개변수의 처방이 강한 강수의 발달을 저지하는 역할을 하였음을 알 수 있다.

Maximum precipitation amount [mm] during 10 hours, along with the averaged statistical skill scores of bias, probability of detection (POD), false alarm ratio (FAR), and equitable threat score (ETS) during the analysis period for each experiment at the threshold of 0.05 mm. The observed precipitation from Automatic Weather System (AWS) is utilized to calculate the statistical skill scores.
서울 및 경기 지역을 관심 영역으로 설정하여 영역 평균 1시간 누적 강수의 시간 변화를 분석 기간에 대해 앞서 규정한 A, B 강수대의 영향을 받는 기간을 구분하여 살펴보았다(Fig. 6). 각 강수대는 서에서 동으로 이동하며 순서대로 영향을 주는데, AWS 관측을 통해 A 강수대에 의한 강수가 0800~1200 UTC, B 강수대에 의한 강수가 1100~1600 UTC에 발생하고, 각각 1000 UTC에 13.97 mm, 1500 UTC에 13.00 mm로 최대 강수가 나타났다. 모든 실험이 관측 대비 A 강수대에 의한 강수를 0800~1100 UTC에는 약하게 모의하다가 1200 UTC에 강하게 모의하고, B 강수대는 전반적으로 약하게 모의하였다. 세 실험이 모의한 강수의 시간 변화는 유사하게 나타나나, MUR은 CNTL 대비 A 강수대 발달 이전부터 0900 UTC까지의 강수를 강하게, A 강수대에 의한 강수를 약하게, 그리고 B 강수대에 의한 강수를 강하게 모의하였다. MEDI는 MUR과 유사한 시간 변화를 보이나, MUR에서 강수가 강해진 두 구간에서 상대적으로 덜 강해지는 경향을 보인다. 두 민감도 실험은 A 강수대 발달 이전인 0700~0800 UTC와 B 강수대가 발달한 1300~1600 UTC에 CNTL보다 강수를 강하게 모의하고, 이로 인해 관심 영역에서 민감도 실험이 CNTL과 양의 차이를 보이게 된다(Figs. 5c-d). 관심 영역 평균 강수의 분석기간 평균 값은 CNTL이 4.13 mm, MUR은 4.36 mm, 그리고 MEDI는 4.15 mm로, MUR에서 관심 영역 총 강수량이 크게 증가하는 것으로 나타났다.
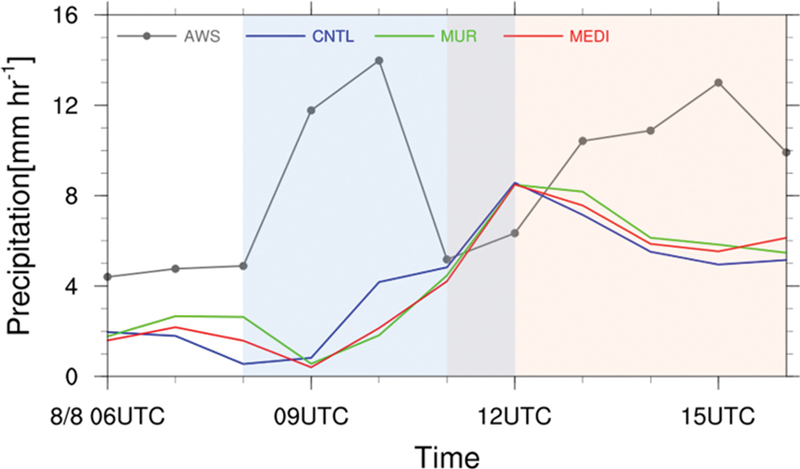
Time series of hourly precipitation from 0600 to 1600 UTC 8 on August 2022 over the gray box area in Fig. 2b. The segments shaded in blue and red correspond to periods influenced by each convection, noted by A and B in Fig. 3. The lines colored in gray, blue, green, and red represent the results for AWS, CNTL, MUR, and MEDI, respectively.
관심 영역에서 A 강수대가 동쪽으로 빠져나가고 B 강수대가 발달하기 시작하는 1200 UTC에서의 강수의 공간 분포를 살펴보았다(Fig. 7). AWS 관측을 통해 동진하면서 약화된 A 강수대에 의한 강수가 강원도 전반에 걸쳐 나타나고, B 강수대가 발달하면서 서울 남부를 중심으로 50 mm 이상의 강수가 있었음을 알 수 있다(Fig. 7a). 세 실험 모두 A 강수대의 중심이 관측 대비 남서쪽에 위치하고 강화되어 20 mm 이상의 강한 강수를 모의하였다. B 강수대는 관측과 유사한 시간에 발달하나, 경기도 북부에 동서로 길게 자리하고 관측 대비 상대적으로 약한 강수 강도를 모의하고 있다. 특징적으로 CNTL은 두 강수대가 거의 붙어서 나타나며 경기, 강원 사이에 100 mm 이상의 강수를 모의한 반면, 두 민감도 실험에서는 두 강수대가 분리되어 모의됨을 확인할 수 있다. 이러한 차이는 CNTL의 분석 영역 최대 강수량이 다른 실험 대비 높은 값을 보이는 원인이 된다. 민감도 실험 간에 차이를 살펴보면, MUR은 A 강수대의 중심 강수가 50 mm 이상으로 MEDI보다 강하게 나타나고 관심 영역 서쪽에도 50 mm 이상의 강한 강수를 모의한다. 이를 통해 관측된 VR - DR 관계의 aR, bR, 그리고 fR의 처방보다는 NR - DR 관계의 형태 매개변수인 μR의 처방이 관심 영역에서의 강수대 발달을 강화시키는 방향으로 작용하였음을 알 수 있다.
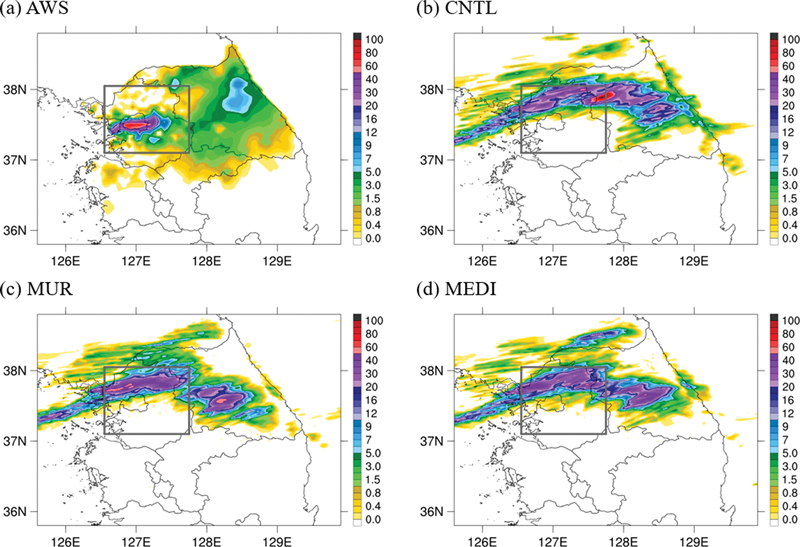
Spatial distribution of hourly surface precipitation rate [mm hr-1] at 1200 UTC 8 on August 2022 obtained from (a) AWS, (b) CNTL, (c) MUR, and (d) MEDI.
CNTL에서 모의한 분석 기간-관심 영역 평균 대기 수상 혼합비의 연직 분포와 각 민감도 실험 간의 차이를 살펴보았다(Fig. 8). CNTL에서 4 km를 기준으로 상층에는 얼음, 눈, 그리고 싸라기와 같은 고체형 대기 수상이 16 km까지 분포하고, 눈의 혼합비가 가장 큰 비율을 차지하고 있다. 하층에는 구름 방울과 빗방울과 같은 액체형 대기 수상이 분포하고, 빗방울의 혼합비가 큰 비율을 차지하는 것으로 나타났다. MUR과 CNTL간의 차이를 살펴보면, 구름 방울은 6 km 고도 전후에서 증가하며, 빗방울은 6 km 이하의 고도, 그리고 눈과 싸라기는 발생고도에서 증가하는 것을 알 수 있다. 여기서 하층 빗방울의 증가는 관심 영역의 강수 증가에 영향을 준 것으로 분석된다. MEDI도 CNTL 대비, 전반적으로 혼합비가 증가하나 MUR에 비해 상층의 눈과 하층의 빗방울의 증가하는 양이 감소하는 것으로 나타난다.
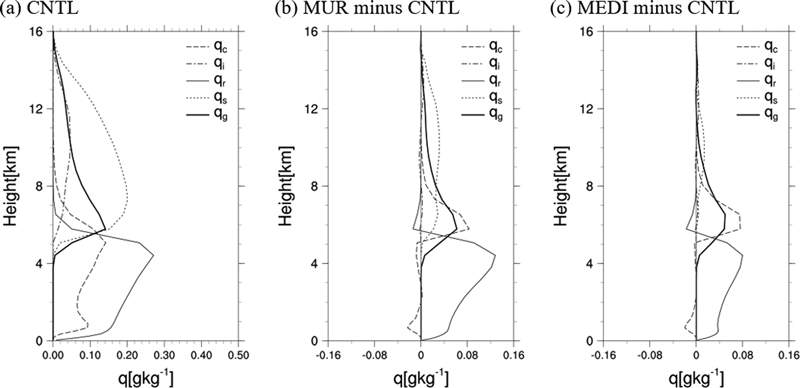
Vertical profiles of time- and domain-averaged mixing ratios of hydrometeors over the gray box in Fig. 2b obtained from (a) CNTL, and the difference between (b) MUR and CNTL (MUR minus CNTL), and (c) MEDI and CNTL (MEDI minus CNTL). q denotes the mixing ratio and the subscripts c, i, r, s, and g indicate cloud water, cloud ice, rain, snow, and graupel, respectively.
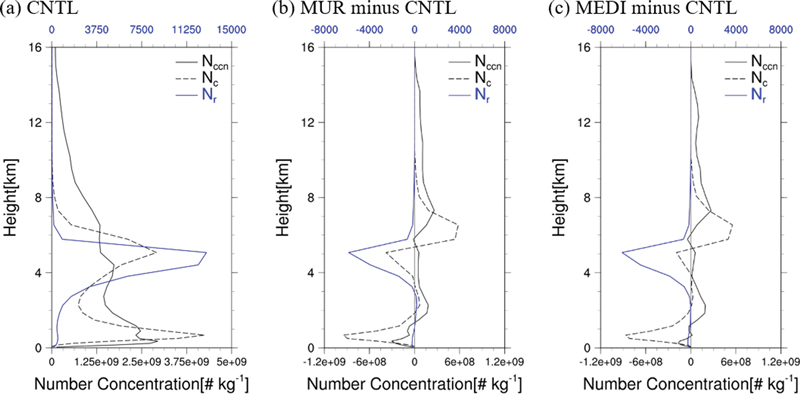
WDM6 방안에서는 구름 응결핵, 구름 방울, 그리고 빗방울의 수농도가 예단된다. 마찬가지로 매개변수의 처방이 이들에 미치는 영향을 살펴보고자 분석 기간-관심 영역 평균 수농도의 연직 분포를 Fig. 9에서 제시하였다. CNTL에서 구름 응결핵은 전 층에 걸쳐 분포하며 하층으로 가면서 증가하고, 구름 방울은 9 km 이하에 분포하며 5, 0.5 km에서 큰 값을 보인다. 그리고 빗방울의 수농도는 7 km 이하에 분포하며 4.5 km에서 최댓값이 나타난다. 이는 빗방울 혼합비의 최대 고도와 일치한다. MUR과 CNTL의 차이를 살펴보면, 구름 응결핵은 2 km 이하를 제외한 대부분의 층에서 증가하고, 구름 방울은 6 km에서 증가, 5, 0.5 km에서 크게 감소한다. 그리고 빗방울은 5 km를 기준으로 감소하는 특징을 보인다. MEDI의 경우, MUR과 CNTL의 차이와 비교했을 때 전반적인 분포는 유사하나, 구름 방울 수농도는 하층에서 더 적게 감소하고, 빗방울의 수농도는 5 km에서 더 크게 감소하였다. 두 민감도 실험이 CNTL과 보이는 차이가 유사함을 통해 VR - DR 관계를 정의하는 매개변수의 변화가 수농도에 미치는 영향이 상대적으로 적음을 알 수 있다. 또한 두 민감도 실험에서 하층 빗방울의 혼합비의 증가와 수농도의 감소가 나타났는데, 이는 두 민감도 실험에서 상대적으로 크기가 큰 빗방울이 생성될 수 있음을 의미하며 해당영역에서의 평균 강수 증가에 영향을 주었을 것으로 판단된다.
관측된 빗방울의 특성을 정의하는 매개변수의 처방이 관심 영역의 상세 미세물리과정에 미치는 영향을 살펴보고자 분석 기간 동안 나타난 빗방울 혼합비의 생성 및 소멸과 관련된 과정들의 연직 및 수평 평균 값을 비교하였다(Fig. 10). 총 14개 과정이 있으며, 각 과정에 대한 물리적 의미는 Table 5와 같다. CNTL에서 나타난 빗방울 혼합비의 주요 생성 과정은 PRAUT, PRACW, PREVP, PSMLT, PGMLT, 그리고 주요 소멸과정은 PGACR이며, 나머지 과정들의 정량적 크기는 작은 것으로 분석되었다. 빗방울 혼합비의 생성에 가장 큰 영향을 미치는 과정은 PRACW로, 해당 과정은 구름 방울과 빗방울의 충돌 병합과정이다. PSMLT와 PGMLT는 각각 눈, 싸라기가 0oC 이상에서 녹는 과정으로, 녹는점 근처인 4~6 km 고도에서 발생하고 이로 인해 눈과 싸라기가 급격히 감소하게 된다. MUR에서 주요 빗방울의 생성 과정들이 CNTL 보다 증가하고, 주요 소멸 과정인 PGACR은 감소하는 것으로 분석되었다. 빗방울의 소멸 과정인 PREVP_rc 과정이 증가하나, 다른 미세물리과정들에 의한 빗방울 혼합비를 증가시키는 방향으로의 변화가 더 큰 것을 알 수 있다. MEDI에서도 MUR과 유사하게 주요 빗방울의 생성 과정이 CNTL대비 증가하고 소멸 과정인 PGACR은 감소, PREVP_rc는 증가하지만, MEDI와 CNTL과의 차이는 MUR과 CNTL의 차이보다는 작은 것으로 나타났다. 두 민감도 실험이 보이는 차이를 통해 관측된 매개변수의 처방이 빗방울의 혼합비를 증가시키는 방향으로 상세 미세물리과정에 영향을 미쳤음을 알 수 있다. 여기서 지표 강수에 직접적으로 영향을 주는 하층 빗방울 혼합비의 증가는 PRACW와 PREVP의 증가로 인해 발생하는데, PRACW는 빗방울이 더 큰 직경을 가질 때 구름 방울과의 상호작용이 활발하게 이루어지고, PREVP는 빗방울의 직경에 비례하여 증가한다. 민감도 실험들은 CNTL 보다 더 큰 μR을 처방하는데, μR의 증가는 빗방울 수농도의 감소에 영향을 주고 동일한 조건에서 직경을 증가시킨다. 따라서 PRACW와 PREVP(수증기에서 빗방울로의 응결)가 두 민감도 실험에서 증가하고 하층 빗방울 혼합비가 증가한다.
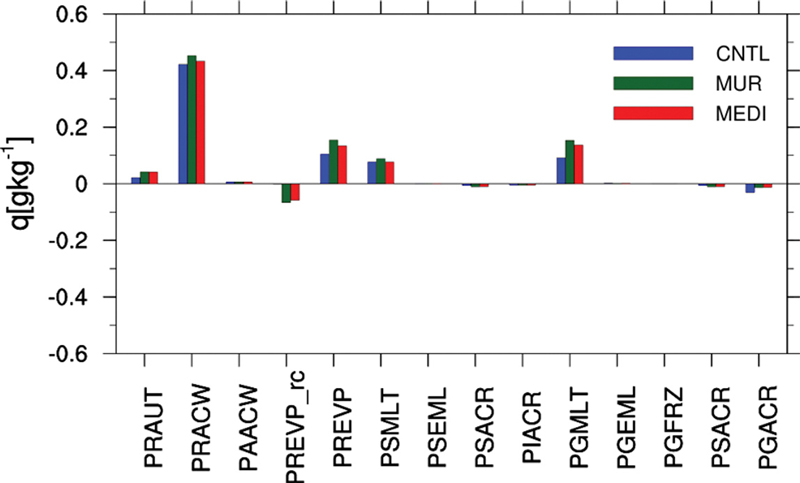
Vertically and horizontally-averaged microphysical processes over the gray box in Fig. 2b during the analysis period.
4. 요약 및 결론
구름미세물리 모수화 방안 내 대기 수상의 특성을 정의하는 매개변수는 강수 모의에 직접적으로 영향을 주며, 불확실성을 가지는 요소 중 하나이다. 본 연구에서는 한반도에서 관측된 빗방울의 특성을 정의하는 매개변수를 WDM6 구름미세물리 모수화 방안에 처방하고, 2022년 8월 8일에 있었던 중부지방 집중호우사례에 대한 민감도 실험을 통해 한반도 강수 모의성능에 미치는 영향을 살펴보았다.
2018~2019년 4~11월 동안 보성 표준기상관측소 2DVD로부터 관측된 빗방울의 특성인 VR - DR 관계와 NR - DR 분포의 형태를 정의하는 매개변수 μR을 WDM6 방안에 처방된 매개변수와 비교하였다. VR - DR 관계의 경우 기존 WDM6 방안에 규정된 관계는 VR이 DR에 따라 계속 증가하며 DR이 4 mm 이상 일때 10 m s-1 이상의 VR을 가지는 반면, 관측된 관계는 최대 9.04 m s-1를 가지고, μR은 WDM6 방안 내 처방 값 대비 관측 값이 큰 것으로 나타나면서 상당한 차이를 보였다. WRF 4.3을 활용해 기존 매개변수를 처방한 CNTL, μR을 50 백분위수 값으로 처방한 MUR, 그리고 μR 뿐만 아니라 VR - DR 관계의 aR, bR, 그리고 fR을 50 백분위수 값으로 처방한 MEDI를 관심 사례에 대해 수행하고 강수에 미치는 영향을 분석하였다. 두 민감도 실험 모두 CNTL에서 나타난 AWS관측 대비 분석 기간 누적 강수 공간 분포의 오차가개선되는 방향으로 차이를 보였다. 또한 정량적인 성능 비교를 한 결과, 두 민감도 실험에서 BIAS, POD, 그리고 ETS 통계 점수가 모두 향상되었다. 최대 강수 강도의 경우 감소하는 것으로 나타났는데, 이를 통해 관측된 매개변수의 처방이 강수 모의 성능을 향상시키나, 강한 강수의 발달을 저지하는 역할을 하였음을 알 수 있다.
분석 기간 동안 관심 영역의 강수에 주된 영향을 끼친 A, B 강수대가 CNTL에서는 거의 붙어서 나타나며, 경기, 강원 사이에 100 mm 이상의 강한 강수를 모의했다. 반면, 두 민감도 실험에서는 관측과 유사하게 각 강수대가 분리되어 나타나며, CNTL 대비 B 강수대의 강수를 강하게 모의하였다. 분석 기간-관심 영역 평균 대기 수상 혼합비와 수농도의 연직분포를 통해 두 민감도 실험에서 하층의 빗방울의 혼합비가 증가하고 수농도는 감소하는 것으로 분석되었다. 이는 상대적으로 크기가 큰 빗방울이 생성됨을 의미하며, 해당 영역에서 평균 강수의 증가에 영향을 주게 된다. 관측된 빗방울의 특성을 정의하는 매개변수의 처방은 빗방울의 혼합비를 증가시키는 방향으로 상세 미세물리과정에 영향을 주었으며, 특히 μR의 영향이 상대적으로 큰 것으로 나타났다.
이러한 결과는 구름미세물리 모수화 방안 내 빗방울의 특성을 정의하는 매개변수가 구름 발달 및 강수 예측 성능에 영향을 미치며, 관측된 매개변수를 활용해 강수 모의의 불확실성을 줄일 수 있음을 시사한다. 구름미세물리 모수화 방안 내에는 관측을 통해 조절할 수 있는 다양한 대기 수상의 특성이 있으나, 본 연구에서는 빗방울의 특성에 초점을 맞추어 이를 정의하는 매개변수만을 50 백분위수로 처방하고 특정 사례에 대해서만 분석한 한계가 있다. 향후 다양한 지역 및 강수 유형별로 관측자료에서 나타난 매개변수를 수집하고, 이것이 기상요소와 관계를 얻어 모수화 방안내에 구현한다면 이러한 대기 수상의 특성을 정의하는 매개변수의 불확실성을 최소화할 수 있을 것이다. 또한 지상 관측 자료로부터 빗방울 외에도 다양한 대기 수상의 특성을 정의하는 매개변수를 얻을 수 있으므로 향후 장기간 관측 자료를 활용하여 여러 대기 수상 특성의 매개변수가 강수 모의에 미치는 영향을 분석하는 것이 필요하다.
Acknowledgments
본 연구는 2023년도 정부(교육부)의 재원으로 한국연구재단의 지원을 받아 수행된 기초연구사업(RS-2023-00272424)과 기상청 국립기상과학원 수도권 위험기상 입체관측 및 예보활용 기술 개발(KMA2018-00125)의 지원으로 수행되었습니다. 논문 작성 과정에 도움을 주신 UTHSC 최효영 교수님께 감사드립니다.
REFERENCES
-
Atlas, D., R. C. Srivastava, and R. S. Sekhon, 1973: Doppler radar characteristics of precipitation at vertical incidence. Rev. Geophys., 11, 1-35.
[https://doi.org/10.1029/RG011i001p00001]

-
Bang, W., S. Kwon, and G. Lee, 2017: Characteristic of raindrop size distribution using two-dimensional video disdrometer data in Daegu, Korea. J. Korean Earth Sci. Soc., 38, 511-521 (in Korean with English abstract).
[https://doi.org/10.5467/JKESS.2017.38.7.511]

-
Cha, J. W., and S. S. Yum, 2021: Characteristics of precipitation particles measured by PARSIVEL disdrometer at a mountain and a coastal site in Korea. Asia-Pac. J. Atmos. Sci., 57, 261-276.
[https://doi.org/10.1007/s13143-020-00190-6]

-
Chen, F., and J. Dudhia, 2001: Coupling an advanced land surface-hydrology model with the Penn State-NCAR MM5 modeling system. Part I: model implementation and sensitivity. Mon. Wea. Rev., 129, 569-585.
[https://doi.org/10.1175/1520-0493(2001)129<0569:CAALSH>2.0.CO;2]

-
Cohard, J.-M., and J.-P. Pinty, 2000: A comprehensive two-moment warm microphysical bulk scheme. I: Description and tests. Quart. J. Roy. Meteor. Soc., 126, 1815-1842.
[https://doi.org/10.1002/qj.49712656613]

-
Gunn, R., and G. D. Kinzer, 1949: The terminal velocity of fall for water droplets in stagnant air. J. Atmos. Sci., 6, 243-248.
[https://doi.org/10.1175/1520-0469(1949)006<0243:TTVOFF>2.0.CO;2]

-
Hersbach, H., and Coauthors, 2020: The ERA5 global reanalysis. Quart. J. Roy. Meteor. Soc., 146, 1999-2049.
[https://doi.org/10.1002/qj.3803]

- Hong, S.-Y., and J.-O. J. Lim, 2006: The WRF single-moment 6-class microphysics scheme (WSM6). J. Korean Meteor. Soc., 42, 129-151.
-
Hong, S.-Y., Y. Noh, and J. Dudhia, 2006: A new vertical diffusion package with an explicit treatment of entrainment processes. Mon. Wea. Rev., 134, 2318-2341.
[https://doi.org/10.1175/MWR3199.1]

-
Iacono, M. J., J. S. Delamere, E. J. Mlawer, M. W. Shephard, S. A. Clough, and W. D. Collins, 2008: Radiative forcing by long‐lived greenhouse gases: calculations with the AER radiative transfer models. J. Geophys. Res. Atmos., 113.
[https://doi.org/10.1029/2008JD009944]

-
Jash, D., E. A. Resmi, C. K. Unnikrishnan, R. K. Sumesh, T. S. Sreekanth, N. Sukumar, and K. K. Ramachandran, 2019: Variation in rain drop size distribution and rain integral parameters during southwest monsoon over a tropical station: an inter-comparison of disdrometer and micro rain radar. Atmos. Res., 217, 24-36.
[https://doi.org/10.1016/j.atmosres.2018.10.014]

-
Jiménez, P. A., J. Dudhia, J. F. González-Rouco, J. Navarro, J. P. Montávez, and E. García-Bustamante, 2012: A revised scheme for the WRF surface layer formulation. Mon. Wea. Rev., 140, 898-918.
[https://doi.org/10.1175/MWR-D-11-00056.1]

-
Kain, J. S., and J. M. Fritsch, 1990: A one-dimensional entraining/detraining plume model and its application in convective parameterization. J. Atmos. Sci., 47, 2784-2802.
[https://doi.org/10.1175/1520-0469(1990)047<2784:AODEPM>2.0.CO;2]

-
Kain, J. S., 2004: The Kain–Fritsch convective parameterization: an update. J. Appl. Meteor. Climatol., 43, 170-181.
[https://doi.org/10.1175/1520-0450(2004)043<0170:TKCPAU>2.0.CO;2]

-
Kim, D.-S., K.-S. S. Lim, K. Kim, and G. W. Lee, 2020: Effects of the realistic description for the terminal fall velocity-diameter relationship of raindrops on the simulated summer precipitation over South Korea. Atmosphere, 30, 421-437 (in Korean with English abstract).
[https://doi.org/10.14191/Atmos.2020.30.4.421]

- KMA, 2023: 2022 Abnormal Climate Report. Korea Meteorological Administration, 26-27 pp (in Korean).
-
Lee, J., H.-G. Jin, and J.-J. Baik, 2023: Diagnostic relations for the intercept parameter of exponential raindrop size distribution according to rain types derived from disdrometer data and their impacts on precipitation prediction. Asia-Pac. J. Atmos. Sci., 59, 219-238.
[https://doi.org/10.1007/s13143-022-00306-0]

-
Lim, K.-S. S., and S.-Y. Hong, 2010: Development of an effective double-moment cloud microphysics scheme with prognostic cloud condensation nuclei (CCN) for weather and climate models. Mon. Wea. Rev., 138, 1587-1612.
[https://doi.org/10.1175/2009MWR2968.1]

-
Lim, K.-S. S., 2019: Bulk-type cloud microphysics parameterization in atmospheric models. Atmosphere, 29, 227-239 (in Korean with English abstract).
[https://doi.org/10.14191/Atmos.2019.29.2.227]

-
Lim, K.-S. S., 2020: Effects of the mass-size relationship for snow on the simulated surface precipitation. J. Korean Earth Sci. Soc., 41, 1-18 (in Korean with English abstract).
[https://doi.org/10.5467/JKESS.2020.41.1.1]

-
Liu, J. Y., and H. D. Orville, 1969: Numerical modeling of precipitation and cloud shadow effects on mountain-induced cumuli. J. Atmos. Sci., 26, 1283-1298.
[https://doi.org/10.1175/1520-0469(1969)026<1283:NMOPAC>2.0.CO;2]

-
Ma, Y., G. Ni, C. V. Chandra, F. Tian, and H. Chen, 2019: Statistical characteristics of raindrop size distribution during rainy seasons in the Beijing urban area and implications for radar rainfall estimation. Hydrol. Earth Syst. Sci., 23, 4153-4170.
[https://doi.org/10.5194/hess-23-4153-2019]

-
Mao, W., W. Zhang, and M. Kou, 2023: Statistical characteristics of raindrop size distribution during rainy seasons in complicated mountain terrain. Hydrol. Earth Syst. Sci., 27, 3895-3910.
[https://doi.org/10.5194/hess-27-3895-2023]

-
Marshall, J. S., and W. M. K. Palmer, 1948: The distribution of raindrops with size. J. Meteorol., 5, 165-166.
[https://doi.org/10.1175/1520-0469(1948)005<0165:TDORWS>2.0.CO;2]

-
Matsunobu, T., C. Keil, and C. Barthlott, 2022: The impact of microphysical uncertainty conditional on initial and boundary condition uncertainty under varying synoptic control. Weather Clim. Dynam., 3, 1273-1289.
[https://doi.org/10.5194/wcd-3-1273-2022]

-
Moon, J.-Y., D.-K. Kim, Y.-H. Kim, J.-C. Ha, and K.-Y. Chung, 2013: Analysis of summer rainfall case over southern coast using MRR and PARSIVEL disdrometer measurements in 2012. Atmosphere, 23, 265-273 (in Korean with English abstract).
[https://doi.org/10.14191/Atmos.2013.23.3.265]

-
Morcrette, J.-J., H. W. Barker, J. N. S. Cole, M. J. Iacono, and R. Pincus, 2008: Impact of a new radiation package, McRad, in the ECMWF integrated forecasting system. Mon. Wea. Rev., 136, 4773-4798.
[https://doi.org/10.1175/2008MWR2363.1]

-
Morrison, H., J. A. Curry, and V. I. Khvorostyanov, 2005: A new double-moment microphysics parameterization for application in cloud and climate models. Part I: description. J. Atmos. Sci., 62, 1665-1677.
[https://doi.org/10.1175/JAS3446.1]

-
Seela, B. K., and Coauthors, 2021: Raindrop size distributions of North Indian Ocean tropical cyclones observed at the coastal and inland stations in South India. Remote Sens., 13, 3178.
[https://doi.org/10.3390/rs13163178]

-
Skamarock, W. C., and Coauthors, 2021: A description of the advanced research WRF model version 4.3 (No. NCAR/TN-556+STR). 148 pp.
[https://doi.org/10.5065/1dfh-6p97]

- Stensrud, D. J., 2009: Parameterization schemes: keys to understanding numerical weather prediction models. Cambridge University Press, 261 pp.
-
Thompson, G., P. R. Field, R. M. Rasmussen, and W. D. Hall, 2008: Explicit forecasts of winter precipitation using an improved bulk microphysics scheme. Part II: implementation of a new snow parameterization. Mon. Wea. Rev., 136, 5095-5115.
[https://doi.org/10.1175/2008MWR2387.1]

-
van Lier-Walqui, M., T. Vukicevic, and D. J. Posselt, 2012: Quantification of cloud microphysical parameterization uncertainty using radar reflectivity. Mon. Wea. Rev., 140, 3442-3466.
[https://doi.org/10.1175/MWR-D-11-00216.1]

-
Wang, X., L. Zhang, and M. D. Moran, 2010: Uncertainty assessment of current size-resolved parameterizations for below-cloud particle scavenging by rain. Atmos. Chem. Phys., 10, 5685-5705.
[https://doi.org/10.5194/acp-10-5685-2010]

-
Zhang, A., C. Chen, and L. Wu, 2023: Regional variability of raindrop size distribution from a network of disdrometers over complex terrain in Southern China. Remote Sens., 15, 2678.
[https://doi.org/10.3390/rs15102678]

