Seasonal Prediction of Korean Surface Temperature in July and February Based on Arctic Sea Ice Reduction
Abstract
We examined potential seasonal prediction of the Korean surface temperature using the relationships between the Arctic Sea Ice Area (SIA) in autumn and the temperature in the following July and February at 850 hPa in East Asia (EA). The Surface Air Temperature (SAT) over Korea shows a similar relationship to that for EA. Since 2007, reduction of autumn SIA has been followed by warming in Korea in July. The regional distribution shows strong correlations in the southern and eastern coastal areas of Korea. The correlations in the sea surface temperature shows the maximum values in July around the Korean Peninsula, consistent with the coastal regions in which the maximum correlations in the Korean SAT are seen. In February, the response of the SAT to the SIA is the opposite of that for the July temperature. The autumn sea ice reduction is followed by cooling over Korea in February, although the magnitude is small. Cooling in the Korean Peninsula in February may be related to planetary wave-like features. Examining the autumn Arctic sea ice variation would be helpful for seasonal prediction of the Korean surface temperature, mostly in July and somewhat in February. Particularly in July, the regression line would be useful as supplementary information for seasonal temperature prediction.
Keywords:
Arctic sea ice, Korean surface temperature, Seasonal prediction1. Introduction
The sea ice in the Arctic Ocean and adjacent seas has significantly decreased over the last few decades with several record-breaking Sea Ice Area (SIA) minimums (Stroeve et al., 2012). The melting sea ice plays an important role in Arctic climate change, indicated by the strong positive ice–temperature feedback observed in the Arctic region (Screen and Simmonds, 2010; Polyakov et al., 2012). Considering the potential links between the Arctic and midlatitude weather induced by large-scale changes in circulation (Cohen et al., 2014), it is essential to examine the atmospheric responses related to the loss of Arctic sea ice to understand climate change and for seasonal forecasting.
Several studies have suggested relations between the recent reduction in Arctic sea ice and changes in atmospheric temperatures and circulations in the midlatitudes. These have included relation between early autumn sea ice and the wintertime Eurasian climate (Honda et al., 2009; Ding et al., 2021), between autumn Arctic sea ice and Eurasian spring air temperature (Chen and Wu, 2018), East Asian winter monsoon (Chen et al., 2014), and extreme cold events in winter over the Tibetan Plateau (Bi et al., 2022), between early winter sea ice and the mid-winter stratospheric polar vortex (Kim et al., 2014) and variation of the East Asian trough in late winter (Xu et al., 2021), and between Arctic sea ice loss and recent Eurasian winter cooling (Mori et al., 2014, 2019; Nakamura et al., 2015, Kim and Son, 2020). Several studies have addressed the potential links between sea ice decline and summer monsoon in Europe and EA (Zhao et al., 2004; Wu et al., 2009; Screen, 2013; Guo et al., 2014). The atmospheric responses to variation in Arctic sea ice are complex, and depend on the background atmospheric state and season (Kug et al., 2015; Overland et al., 2016).
Choi and Yook (2021), hereafter referred to as CY, showed that July 850 hPa temperature over EA and the Western North Pacific (WNP) after 2007 is significantly related to the SIA during September–October–November (SON) of the previous year. Marked reductions in SIA were observed in September 2007 in which the Arctic sea ice melted by record amount (Comiso et al., 2008; Stroeve et al., 2008). SON SIA was reduced below the level of 6.3 million km2 in 2007, and never recovered that level until now. This “regime shift” suggested by Ogi et al. (2016) was also associated with the Arctic marine system. Ogi et al. (2016) also reported that extensive field data shows a clear demarcation in 2007. Based on this shift, CY divided the whole data period into Pre and Post periods, with the Post period beginning after the large reduction of Arctic SIA in 2007. The same definition of the data period is used here. In terms of SIA, the Pre and Post periods correspond to 1979–2006 and 2007–2020, respectively. In terms of temperature, the Pre and Post periods correspond to 1980–2007 and 2008–2021.
In this study, we suggest the possibility of seasonal prediction of the Surface Air Temperature (SAT), particularly for July and February, over the Korean Peninsula based on the SIA during SON in the previous year. The datasets used in this study are described in Section 2. In Sections 3 and 4, the relations between the SON SIA and the Korean SAT are described for July and February, respectively. In Section 5, three cities are selected to show the temperature variation in July dependent on the SIA variation. Summary of our results and discussions are in Section 6.
2. Data and Methods
Air temperatures for the period 1979–2021 were obtained from the European Center for Medium-Range Weather Forecasts (ECMWF) ERA5 at 0.25° horizontal resolution (Hersbach et al., 2020). The SAT over Korea was obtained from the temperature observed at stations of the Korean Meteorological Administration. The daily mean SATs of 45 stations were used for the period 1979–2021. Sea ice concentration data for the period 1979–2020 were obtained at 0.25° resolution from the Sea Ice Index Version 3 provided by the National Snow and Ice Data Center (NSIDC) that was consolidated from passive microwave satellite observations (Fetterer et al., 2017). We calculated the SIA by summing the area covered by sea ice in the entire Northern Hemisphere, and the monthly mean SIA was averaged to obtain the SIA during the SON period. This average is henceforth referred to as SON SIA and was used for all calculations in this study.
For Sea Surface Temperature (SST) analysis, we used the NOAA (National Oceanic and Atmospheric Administration) optimum interpolated SST version 2 data set at 0.25° resolution for the period 1982–2021 (Reynolds et al., 2002). All regression analyses in this study were simple linear regression analyses. All data used to calculate correlation coefficients and the standard deviations were detrended. The standard two-tailed t-test was used to examine statistical significance in regression analyses, and the two-tailed F-test was applied to assess the statistical significance of differences observed in the standard deviation.
3. Surface Temperature in July
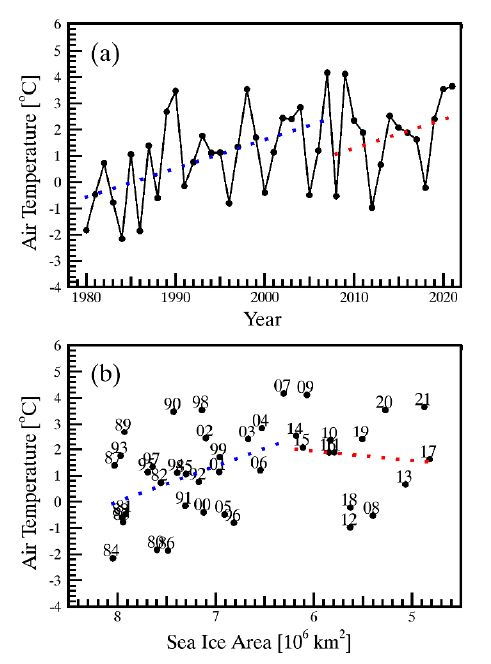
Figure 1a shows the time series of monthly mean SAT in July averaged over 45 stations in Korea. The linear trends in SAT are small for both the Pre and Post periods. In Fig. 1b, the SAT is plotted against the SON SIA calculated in the preceding year. The axis of SIA is inverted and thus the signs of both correlation and regression coefficients are reversed as done in CY. The regression coefficients for Pre and Post were 0.05 and 1.05K per million km2, respectively. The numbers in Fig. 1b represent year of temperature, so the number 08 represents July SAT in 2008 and corresponds to the SON SIA in 2007. The relationship between the SON SIA and July SAT shows a large difference between the Pre (r = –0.03) and Post (r = 0.46) periods.

(a) Monthly mean July surface air temperature over Korea with respect to time, and (b) scatter plot of SON SIA in the previous year versus July SAT over Korea. The horizontal axis is inverted. Numbers in (b) represent year of temperature. Blue and red dashed lines indicate temporal trends in (a) and regression lines in (b) during the Pre and the Post periods, respectively (as defined in the text). SON, September–October–November; SIA, Sea Ice Area; SAT, Surface Air Temperature.
CY suggested that the 850 hPa July temperature in the two regions of EA (30–45°N, 120–135°E) and WNP (40–50°N, 150–165°E) is significantly related to the SON SIA in the previous year. Although the relationship in the SAT shown in Fig. 1b is not as strong as that in the 850 hPa temperature in the WNP region reported by CY, the regression line for the Post period would beuseful for seasonal prediction of July temperatures over Korea. In Fig. 1b, 2020 is located far from the regression line. In 2020, an abnormally low July temperature was recorded with frequent cloudy and rainy days in July, which is reflected in this scatter plot. By excluding the two years of anomalous temperatures in 1994 and 2020, the standard deviations during the Pre and Post periods would be 0.98 K and 0.89 K from the time series and 0.97 and 0.61 from the scatter plot. As noted in CY, decrease of the standard deviation of air temperature from Pre to Post with respect to the linear regression line indicates that the portion of air-temperature variability explained by SON SIA has increased.
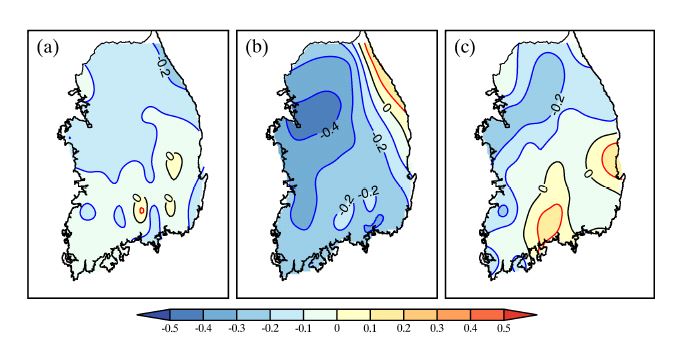
To determine the subseasonal variation in the SAT as well as its regional distribution over Korea, the correlation coefficients were calculated for June, July, and August at each station for monthly mean SAT with SON SIA during the Post period (Fig. 2). The sign of the coefficients is reversed as in Fig. 1b, and thus red color in Fig. 2b implies increasing SAT following the decrease of SIA. Correlation coefficients during the Pre period are small over the most area of Korea for the whole 3-month period (not shown). In July (Fig. 2b), the maximum value is 0.62 at Wando Island (34.4°N, 126.7°E), which is statistically significant at the 95% confidence level. The regions of strong positive correlations are mostly located over the southern and eastern parts of Korea, with larger values found closer to coastal areas. CY suggested that the July temperature in EA was related to the SST. The distribution of correlations in Fig. 2b agree with this suggestion, as the coastal area may be influenced more easily by the SST. In August, the correlation coefficient in southern Korea is larger than 0.3, while the magnitudes of correlations are small (< 0.2) over most other areas, and are therefore insignificant. The influence of SST seems to remain in August, although its magnitude is small. In June, the magnitude of the correlation coefficients is negligible over most of Korea.
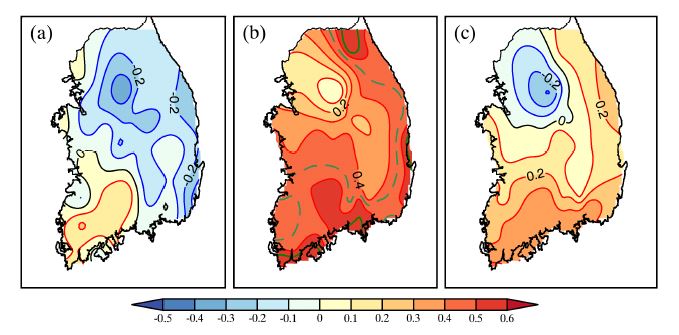
Correlation coefficients between the SAT over Korea and the SIA in the previous SON during the Post period for (a) June, (b) July, and (c) August during the Post period. The green solid and dashed lines represent the statistical significance at the 95% and 90% confidence levels, respectively. The signs of the coefficients are reversed. SAT, Surface Air Temperature; SIA, Sea Ice Area; SON, September–October–November.
To determine the influence of the SST in more detail, the correlation coefficients were calculated between the monthly mean SST and the SON SIA (Fig. 3). For the SST data, the Pre period started from 1982 due to the limited amount of data available. The sign of the correlations is also reversed. During the Pre period, the correlation coefficients are generally weak throughout all 3 months. During the Post period, however, the correlations are significant and mostly positive in the sea surrounding the Korean Peninsula. Particularly in July (Fig. 3e), strong positive correlations are found over a large area (30–35°N, 120–135°E) located to the south of the Korean Peninsula. Strong correlations are also seen in the East Sea. These correlations in SST variation are consistent with the strong correlations in the SAT close to the coastal region of Korea (Fig. 2b). In August, correlations are weaker than in July. The largest correlation coefficients remain to the south of the Korean Peninsula. In June, correlations are generally weaker than in August. The strongest correlations are found to the west of Kyushu Island, Japan, and the northern part of the East Sea. The general patterns of the correlation coefficients in Figs. 3d–f are consistent with those in Fig. 2.
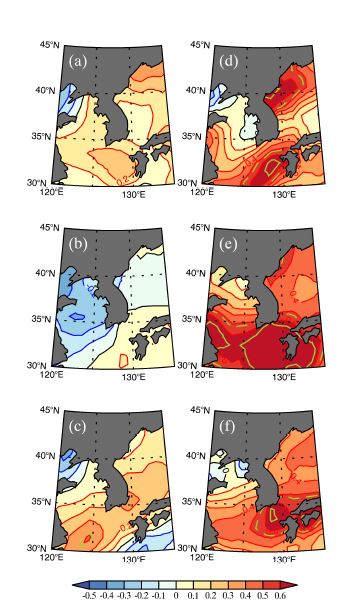
Correlation coefficients between the SST and the SIA in the previous SON period during the Pre (left panels) and the Post (right panels) periods. (a) and (d) June, (b) and (e) July, and (c) and (f) August. The green solid and dashed lines represent the statistical significance at the 99% and 95% confidence levels, respectively. The signs of the coefficients are reversed. SST, Sea Surface Temperature; SIA, Sea Ice Area; SON, September–October–November.
To investigate the features of the correlation coefficients with time, lag-correlation coefficients were calculated (Fig. 4). The SAT data consisted of the 31-day running mean of daily SAT over Korea starting from 1 September through 31 August of the following year. The signs of the correlations are reversed. During the Pre period, correlations are generally weak. During the Post period, the largest correlation coefficients with the SON SIA appear from late June to early July and are statistically significant at the 95% confidence level. The correlation increases rapidly during June and decreases slowly in August. This seems to agree with the monthly correlations shown in Figs. 2, 3, which show the maximum correlation in July, followed by August and June in that order.
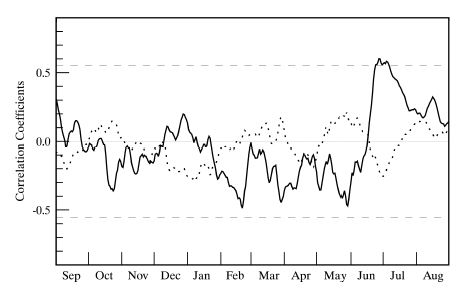
Lag correlation coefficients between the SON SIA and the 31-day running mean of the SAT over Korea from September through August the following year. The dotted and solid lines are for Pre and Post, respectively. The horizontal dashed lines represent the statistical significance at the 95% confidence level for the Post period. The signs of the coefficients are reversed. SON, September–October–November; SIA, Sea Ice Area; SAT, Surface Air Temperature.
Other strong correlations are observed during February, in late March, and in late May. It is not clear whether the relatively large correlations in March and May are correlated with the changes in sea ice. The results shown in Figs. 1–4 imply a significant correlation between the SON SIA and the SAT over Korea, and this relationship may be useful for seasonal prediction of July temperatures. Correlations in February are discussed in the next section.
4. Surface Temperature in February
Some relationships between the SAT over Korea and SON SIA also appear in February, as shown in Fig. 4. From the global distributions of the correlations between the 850 hPa temperature and the SON SIA (not shown), the influence of the sea ice reduction is stronger in January than in February. As no signal of the influence appeared in January over Korea, we focused on the February temperature, although the magnitude was not as large as that in July. Figure 5a shows the time series of monthly mean SAT in February averaged over 45 stations in Korea. Linear trends of temperature in both Pre and Post are similar (~1.1° per decade). This increase in temperature with time in February may correspond to global warming. No such increase is observed in July (Fig. 1a). Figure 5b shows a scatter plot of February SAT against SON SIA in the previous year. The relationship between the SAT and the SON SIA shows small correlations during the Pre (r = –0.05) and Post periods (r = –0.27). Although the correlations are weak, they are worth examining more closely because their signs are the opposite of those in July. The SAT decreases with decreasing SIA in Fig. 5b, in contrast to the increase in SAT in July with decreasing SON SIA (Fig. 1b).
To understand the correlations in February over Korea, the global distribution of correlations in January and February were examined. Figure 6 shows the longitudinal distributions of correlation coefficients between the monthly mean temperature at 850 hPa in January and February averaged over 30–50°N and SON SIA in the previous year. The signs of the correlations are reversed. In January, there are peaks of strong positive correlations located at approximately 170°W and 90°W, with a strong negative peak at 120°W during the Post period. The large correlations appearing globally in January suggest that the effect on 850 hPa temperature of the response from the SON SIA has a time lag of 3–4 months. Preliminary analyses (not shown) suggested that a significant reduction of sea ice may enhance the downward propagation of the planetary waves in January and February. Investigation of the detailed dynamical mechanisms behind the downward propagation of the planetary waves is beyond the scope of this paper. We just hypothesize that stronger-than usual planetary waves might propagate from the troposphere to the stratosphere in response to the decreased SON SIA, and the waves propagate downward again to the troposphere in 3–4 months. In February (Fig. 6b), the positive and negative peaks are maintained with smaller amplitudes. The strongest negative peak is located at approximately 160°E, and may have been related to the lower temperature over the Korean Peninsula.
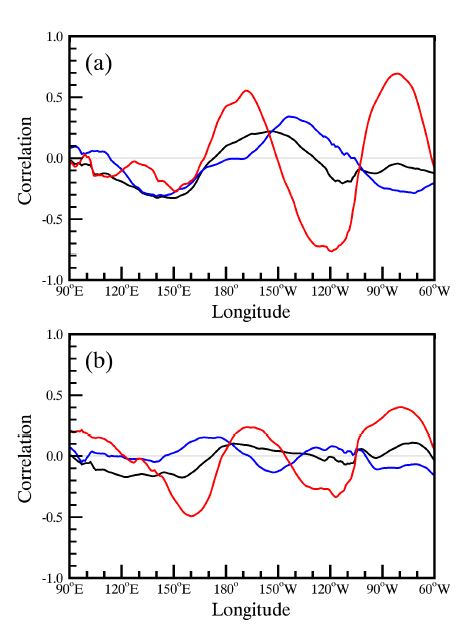
Correlation coefficients between temperature at 850 hPa averaged over 30–50°N and the SIA in the previous SON for (a) January and (b) February. Blue, red, and black lines represent the Pre, Post, and the whole period, respectively. The signs of the coefficients are reversed. SON, September–October–November.
Figure 7 shows the regional distributions of correlation coefficients between monthly mean SAT in January, February, and March calculated at each station over Korea and SON SIA in the previous year during the Post period. The signs of the correlations are reversed. In the Pre period, the correlations are weak over most areas in all three months (not shown). In February during the Post period (Fig. 7b), the correlation coefficients in some areas are large, with maximum magnitude of –0.42 at Suwon (37.3°N, 127.0°E), although the confidence level of the statistical significance is less than 90%. Strong negative correlations are found at the central-western area of the Korean Peninsula, including Seoul. In January and March, the magnitude of the correlations is less than 0.2 over most areas in Korea. Subseasonal variation is shown in Figs. 6, 7.
A particular case of subseasonal temperature reversal was reported for the East Asian surface temperature during the winter of 2014/2015 (Xu et al., 2018). Although Xu et al. (2018) investigated the Arctic sea ice (Laptev and East Siberian Sea), they considered the area of sea ice in autumn 2014 to be lower than normal compared to the 35-year climatological average. In the present study (Fig. 1), the SON SIA in 2014 is larger than normal during the Post period. The discrepancy between the results reported by Xu et al. (2018) and the present study is in the data period of the Arctic sea ice; the large SON SIA in 2014 during Post may correspond to the warm anomalies in January and February shown in Fig. 1 of Xu et al. (2018).
In contrast to July, we suspect that Korean surface temperature in February may be affected by downward planetary waves. If this were true, the response in SST would follow the response in SAT. Figure 8 shows the distributions of correlations between SST and SON SIA in the previous year for January, February, and March. The signs of the correlations are reversed. During the Pre period, negative correlations appear during the 3 months, and it is not clear whether this relation is significant. During the Post period, the correlations are generally weak. We focused on the correlations over the Yellow Sea, as this area is relatively small and may be more susceptible to downward forcing by planetary waves. Negative correlations are found at the northern tip of the Bohai Sea in January. The region of negative correlation becomes wider, occupying the West Korea Bay in February. Finally, the region of the negative correlations widens further in the Yellow Sea in March. Downward planetary waves in January and February would be in agreement with the widening of the negative correlations. The magnitudes of the correlations, however, are not large enough to allow definitive interpretation.
5. Temperature at 850 hPa over Other Cities
The previous sections discussed analysis of surface temperature over Korea. As the surface temperature is affected by factors other than the surrounding ocean, the temperatures at 850 hPa were analyzed to determine the influence of SST more clearly. A few cities in EA were selected, and the results in July from three cities are shown in Fig. 9. Yangpyeong (37.5°N, 127.5°E) in the middle of the Korean Peninsula was selected to represent Korea, while Dalian (38.9°N, 121.6°E) and Shanghai (31.2°N, 121.5°E) were selected to examine the influence of SST based on their locations adjacent to the sea. The signs of both correlation and regression coefficients are reversed. As shown in Figs. 9a–c, the temporal changes during Pre and Post do not show any significant trends at any city. During the Pre period, the correlation coefficients are also not significant at any city. The correlation coefficients during the Post period (0.53 at Yangpyeong, 0.44 at Dalian, and 0.7 at Shanghai) are larger than those during Pre. At Yangpyeong and Shanghai, the correlations are statistically significant at the 90% and 99% confidence levels, respectively. The strong correlation at Shanghai seems to be consistent with the pattern of the SST correlation shown in Fig. 3e.
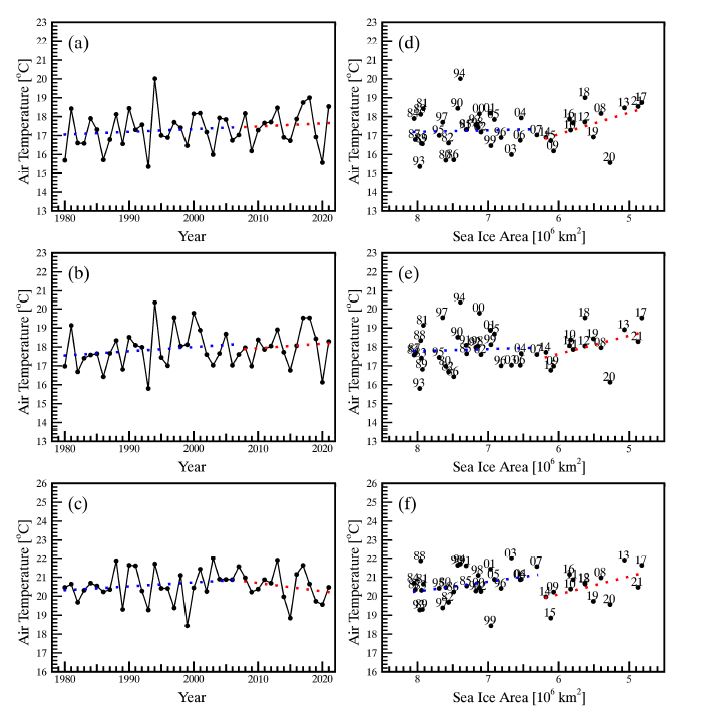
Same as in Fig. 1, but for temperature at 850 hPa. (a) and (d) Yangpyeong, (b) and (e) Dalian, and (c) and (f) Shanghai.
In addition to the above three cities, temperatures over Beijing and Tokyo were analyzed (not shown). At these two cities, there are no significant correlations during the Post period. The correlation coefficients at Beijing are –0.23 and 0.22 during Pre and Post, respectively. The influence of SST may not be strong enough to affect the temperature due to the location of this city. At Tokyo, the correlation coefficients are small and show negligible difference between Pre (r = –0.09) and Post (r = 0.04). Considering the correlations among the five cities described above (Fig. 9) and in the regions of Korea (Fig. 2b), closeness to the sea seems to be an important factor determining the local temperature in relation to the SON SIA. Tokyo is an exception.
6. Summary and Discussion
CY suggested that there were relations between the SON SIA and July temperature at 850 hPa in EA and WNP. We were interested in using this relationship for seasonal prediction of the surface temperature in Korea. The time series of the July SAT do not show any significant change between the Pre and Post periods (Fig. 1a). The scatter plot in Fig. 1b, however, shows a significant change from the Pre to Post period. Both the correlations and slopes of the regression lines during Post show different patterns from those during Pre (Fig. 1b). The scatter plot shows significant positive correlations for the station-averaged temperature over Korea at the 90% confidence level. As shown in Fig. 2, stronger positive correlations are observed at southern and eastern coastal areas in the regional distribution of the correlation coefficients. The regional distribution of correlations is consistent with the correlations of the SST with the SON SIA. The large correlation coefficients in the eastern and southern coastal regions in Fig. 2 agree with the distributions of correlations of SST in Fig. 3.
In addition to July, we are also interested in seasonal prediction for February. The response to sea ice reduction in February is the opposite of that in July, as shown in Fig. 4. As the SON SIA decreases, the July SAT increases, while the February SAT decreases (Fig. 5). Although the response of the Korean surface temperature to sea ice reduction seems to be marginal, the mechanism underlying the influences is still worth examining.
The correlations between 850 hPa temperature at midlatitudes and the SON SIA in the previous year show a wave train pattern (Fig. 6). The correlations appear strong in January in the eastern Pacific region, and with smaller values in February closer to Korea. The locations of the large correlation peaks are mostly maintained, but the amplitude changed from January to February. The correlation with a strong negative peak at 160°E may be related to the negative correlation in the SAT of the Korean Peninsula. The Arctic forcing in SON and the responses in January and February implies a time lag of 3–4 months, which suggests enhanced upward propagation of planetary waves by the sea ice reduction during SON followed by downward propagation in January and February.
As shown in Figs. 6, 7, there seems to be subseasonal variation in the SAT correlations with the SON SIA. In Korean SAT, the strongest correlations appear in February, and the downward propagation of the planetary waves seem to affect the SST in West Korea Bay in February and in the Yellow Sea in March.
The correlations between July 850 hPa air temperature and SON SIA in the previous year at selected cities in EA were calculated. For example, the correlation is significant at the 99% confidence level at Shanghai but there is no such relation in Tokyo. The results presented here show that observing the temperature variation dependent on the Post period is crucial for seasonal prediction. The regression lines would be useful as supplementary material for seasonal temperature prediction in July and February.
Acknowledgments
We greatly appreciate the help by Simchan Yook and Jungjin Kim in data analysis. This research is supported by National Research Foundation of Korea, Grant number: 2018R1A2B6003197.
References
-
Bi, M., Q. Li, S. Yang, D. Guo, X. Shen, and X. Sun, 2022: Effects of Arctic sea ice in autumn on extreme cold events over the Tibetan Plateau in the following winter: possible mechanisms. Clim. Dyn., 58, 2281-2292.
[https://doi.org/10.1007/s00382-021-06007-0]

-
Chen, S., and R. Wu, 2018: Impacts of early autumn Arctic sea ice concentration on subsequent spring Eurasian surface air temperature variations. Clim. Dyn., 51, 2523-2542.
[https://doi.org/10.1007/s00382-017-4026-x]

-
Chen, Z., R. Wu, and W. Chen, 2014: Impacts of autumn Arctic sea ice concentration changes on the East Asian winter monsoon variability. J. Clim., 27, 5433-5450.
[https://doi.org/10.1175/JCLI-D-13-00731.1]

-
Choi, W., and S. Yook, 2021: Relationship between Arctic sea ice in Autumn and subsequent July air temperature over East Asia and the Western North Pacific. Asia-Pac. J. Atmos. Sci., 58, 197-205.
[https://doi.org/10.1007/s13143-021-00249-y]

-
Cohen, J., and Coauthors, 2014: Recent Arctic amplification and extreme mid-latitude weather. Nat. Geosci., 7, 627-637.
[https://doi.org/10.1038/ngeo2234]

-
Comiso, J. C., C. L. Parkinson, R. Gersten, and L. Stock, 2008: Accelerated decline in the Arctic sea ice cover. Geophys. Res. Lett., 35, L01703.
[https://doi.org/10.1029/2007GL031972]

-
Ding, S., B. Wu, and W. Chen, 2021: Dominant characteristics of early autumn Arctic sea ice variability and its impact on winter Eurasian climate. J. Clim., 34, 1825-1846.
[https://doi.org/10.1175/JCLI-D-19-0834.1]

- Fetterer, F., K. Knowles, W. Meier, M. Savoie, and A. K. Windnagel, 2017: Updated Daily Sea Ice Index, Version 3. National Snow and Ice Data Center.
-
Guo, D., Y. Gao, I. Bethke, D. Gong, O. M. Johannessen, and H. Wang, 2014: Mechanism on how the spring Arctic sea ice impacts the East Asian summer monsoon. Theor. Appl. Climatol., 115, 107-119.
[https://doi.org/10.1007/s00704-013-0872-6]

-
Hersbach, H., and Coauthors, 2020: The ERA5 global reanalysis. Q. J. R. Meteorol. Soc., 146, 1999-2049.
[https://doi.org/10.1002/qj.3803]

-
Honda, M., J. Inoue, and S. Yamane, 2009: Influence of low Arctic sea-ice minima on anomalously cold Eurasian winters. Geophys. Res. Lett., 36, L08707.
[https://doi.org/10.1029/2008GL037079]

-
Kim, B. M., S. W. Son, S. K. Min, J. H. Jeong, S. J. Kim, X. Zhang, T. Shim, and J. H. Yoon, 2014: Weakening of the stratospheric polar vortex by Arctic sea-ice loss. Nat. Commun., 5, 5646.
[https://doi.org/10.1038/ncomms5646]

-
Kim, H. J., and S. W. Son, 2020: Eurasian winter temperature change in recent decades and its association with Arctic sea-ice loss. Polar Res., 39, 3363.
[https://doi.org/10.33265/polar.v39.3363]

-
Kug, J. S., J. H. Jeong, Y. S. Jang, B. M. Kim, C. K. Folland, S. K. Min, and S. W. Son, 2015: Two distinct influences of Arctic warming on cold winters over North America and East Asia. Nat. Geosci., 8, 759-762.
[https://doi.org/10.1038/ngeo2517]

-
Mori, M., M. Watanabe, H. Shiogama, J. Inoue, and M. Kimoto, 2014: Robust Arctic sea-ice influence on the frequent Eurasian cold winters in past decades. Nat. Geosci., 7, 869-873.
[https://doi.org/10.1038/ngeo2277]

-
Mori, M., Y. Kosaka, M. Watanabe, H. Nakamura, and M. Kimoto, 2019: A reconciled estimate of the influence of Arctic sea-ice loss on recent Eurasian cooling. Nat. Clim. Change, 9, 123-129.
[https://doi.org/10.1038/s41558-018-0379-3]

-
Nakamura, T., K. Yamazaki, K. Iwamoto, M. Honda, Y. Miyoshi, Y. Ogawa, and J. Ukita, 2015: A negative phase shift of the winter AO/NAO due to the recent Arctic sea-ice reduction in late autumn. J. Geophys. Res. Atmos., 120, 3209-3227.
[https://doi.org/10.1002/2014JD022848]

-
Ogi, M., S. Rysgaard, and D. G. Barber, 2016: Importance of combined winter and summer Arctic Oscillation (AO) on September sea ice extent. Environ. Res. Lett. 11, 034019.
[https://doi.org/10.1088/1748-9326/11/3/034019]

-
Overland, J. E., K. Dethloff, J. A. Francis, R. J. Hall, E. Hanna, S. J. Kim, J. A. Screen, T. G. Shepherd, and T. Vihma, 2016: Nonlinear response of mid-latitude weather to the changing Arctic. Nat. Clim. Change, 6, 992-999.
[https://doi.org/10.1038/nclimate3121]

-
Polyakov, I. V., J. E. Walsh, and R. Kwok, 2012: Recent changes of Arctic multiyear sea ice coverage and the likely causes. Bull. Am. Meteorol. Soc., 93, 145-151.
[https://doi.org/10.1175/BAMS-D-11-00070.1]

-
Reynolds, R. W., N. A. Rayner, T. M. Smith, D. C. Stokes, and W. Wang, 2002: An improved in situ and satellite SST analysis for climate. J. Clim., 15, 1609-1625.
[https://doi.org/10.1175/1520-0442(2002)015<1609:AIISAS>2.0.CO;2]

-
Screen, J. A., 2013: Influence of Arctic sea ice on European summer precipitation. Environ. Res. Lett., 8, 044015.
[https://doi.org/10.1088/1748-9326/8/4/044015]

-
Screen, J. A., and I. Simmonds, 2010: The central role of diminishing sea ice in recent Arctic temperature amplification. Nature, 464, 1334-1337.
[https://doi.org/10.1038/nature09051]

-
Stroeve, J., M. Serreze, M. Holland, J. E. Kay, J. Malanik, and A. P. Barrett, 2012: The Arctic’s rapidly shrinking sea ice cover: a research synthesis. Clim. Change, 110, 1005-1027.
[https://doi.org/10.1007/s10584-011-0101-1]

-
Stroeve, J., M. Serreze, S. Drobot, S. Gearheard, M. Holland, J. Maslanik, W. Meier, and T. Scambos, 2008: Arctic sea ice extent plummets in 2007. Eos, Trans. Am. Geophys. Union, 89, 13-14.
[https://doi.org/10.1029/2008EO020001]

-
Wu, B., R. Zhang, B. Wang, and R. D’Arrigo, 2009: On the association between spring Arctic sea ice concentration and Chinese summer rainfall. Geophys. Res. Lett., 36, L09501.
[https://doi.org/10.1029/2009GL037299]

-
Xu, M., W. Tian, J. Zhang, T. Wang, and K. Qie, 2021: Impact of sea ice reduction in the Barents and Kara seas on the variation of the East Asian trough in late winter. J. Clim., 34, 1081-1097.
[https://doi.org/10.1175/JCLI-D-20-0205.1]

-
Xu, X., F. Li, S. He, and H. Wang, 2018: Subseasonal reversal of East Asian surface temperature variability in winter 2014/15. Adv. Atmos. Sci., 35, 737-752.
[https://doi.org/10.1007/s00376-017-7059-5]

-
Zhao, P., X. Zhang, X. Zhou, M. Ikeda, and Y. Yin, 2004: The sea ice extent anomaly in the North pacific and its impact on the East Asian summer monsoon rainfall. J. Clim., 17, 3434-3447.
[https://doi.org/10.1175/1520-0442(2004)017<3434:TSIEAI>2.0.CO;2]

