
한국의 식물계절 장기 변화 분석(2009~2024)
Ⓒ 2025 Korean Meteorological Society
Abstract
Climate change has a pronounced impact on plant phenology, which is closely linked to ecosystem productivity, carbon cycling, and biodiversity. Analyzing phenological shifts using long-term monitoring data is therefore essential for understanding ecosystem responses to climate change. In this study, we quantitatively assessed four key phenophases (budburst, flowering onset, leaf unfolding onset, and 90~100% fall foliage) based on observations of 20 deciduous broadleaf species collected at 10 arboreta across South Korea from 2009 to 2024. Phenological records were further combined with climatic variables from the Automated Synoptic Observing System (ASOS) to evaluate correlations between phenological events and climate factors. The results showed that budburst (-0.94 d yr-1), flowering (-0.83 d yr-1), and leaf unfolding (-0.79 d yr-1) advanced consistently, while peak (90~100%) fall foliage was delayed (+0.33 d yr-1), leading to an extension of the average growing season by more than 17 days. A distinct seasonal transition point was also identified between fruit set and fruit maturity, where DOY (Day of year) values increased sharply. Regional analysis indicated consistent advancement of spring events across most regions, whereas fall foliage tended to be delayed. Correlation analysis revealed that spring phenophases advanced in response to winter-early spring air and surface temperatures, while fall foliage showed strong positive correlations with late-summer air temperature, surface temperature, and dew point temperature. Stepwise multiple-regression models further showed that leaf unfolding and flowering showed very high explanatory power from climatic predictors (Adjusted R2: 0.96 and 0.95, respectively), confirming them as the phases most sensitive to interannual climatic variability. This study integrated nationwide long-term phenological observations updated through 2024 to present species- and region-level recent changes, and applied rolling 2- to 3-month analysis windows to systematically identify, for each phenophase, the sensitive periods and the direction of climatic influences. Moving beyond a simple confirmation of growingseason extension, we quantified stage-specific meteorological influence and sensitivity windows, thereby enhancing the comparability and reproducibility of the results. Our findings can serve as a scientific basis for predicting ecosystem responses to climate change and informing the development of climate crisis adaptation strategies.
Keywords:
Plant phenology, Climate change, Deciduous broadleaf species, Long-term monitoring, Climatic factors1. 서 론
기후변화는 전 지구적 생태계 구조와 기능을 변화시키며 특히 식물계절(plant phenology)에 뚜렷한 영향을 미친다. 식물계절은 식물의 연간 생장 주기에서 반복적으로 나타나는 주요 단계들을 의미하며(Jeong et al., 2011; Piao et al., 2019) 이러한 계절적 시기의 변화는 생물다양성과 생태계 서비스 전반에 연쇄적인 영향을 유발할 수 있다(IPCC, 2022). 나아가 식물계절은 생태계 생산성, 탄소순환과 밀접히 연결되어 있어 기후변화의 민감한 지표로 활용된다(Körner and Basler, 2010; Wolkovich et al., 2013).
세계적으로 식물계절 연구는 국가 및 대륙 단위의 네트워크를 통해 체계적으로 진행되고 있다. 유럽의 Pan European Phenology Network, 미국의 USA National Phenology Network, 북미 전역의 PhenoCam Network 등은 대규모 공간에서 장기적 식물계절 변화를 모니터링할 수 있는 기반을 마련하고 있다(Richardson et al., 2018; Seyednasrollah et al., 2019). 이러한 노력은 단일 지역·단일 종의 한계를 넘어, 기후변화가 생태계 생산성과 탄소순환에 미치는 영향을 대규모로 평가하고, 기후·생태계 모델의 검증 및 개선에 활용할 수 있는 표준화된 데이터를 제공한다. 따라서 식물계절 장기 관측자료를 기상학적 맥락과 연계해 분석하는 것은 한 지역의 산림 생태계의 특성을 이해하는 데 그치지 않고 전 지구적 기후변화 연구에도 중요한 기여를 할 수 있다. 최근 연구들은 개엽, 개화, 단풍, 낙엽과 같은 주요 현상이 기온 상승과 강수 변화 등 기후 요인에 의해 빠르게 변하고 있음을 확인하였다(Wang et al., 2017; Vitasse et al., 2021).
국내에서는 기상청(Korea Meteorological Administration, KMA)과 국립수목원(Korea National Arboretum, KNA)을 중심으로 식물계절 관측이 이루어지고 있으며, 특히 국립수목원은 2009년 이후 전국 10개 수목원에서 256종을 대상으로 13개 단계의 체계적 관측을 수행하고 있다. 이를 활용한 최근 연구는 한국 낙엽활엽수의 봄철 식물계절이 약 -1 d yr-1 수준으로 빠르게 앞당겨지고 있으며, 가을철 현상은 연도별 변동성이 크게 나타나 불확실성이 존재함을 보고하였다(Kim et al., 2022). 동일한 국립수목원 관측자료를 이용하여 기계학습(Random Forest, RF)을 적용한 단풍시기 예측에서 봄철 개엽 시기와 여름 기온이 핵심 변수로 확인되었다(Lee et al., 2022).
이러한 선행연구를 바탕으로 본 연구는 2009년에서 2024년까지 국립수목원 장기 관측자료를 활용하여 한국 산림 낙엽활엽수 20종의 장기적 변화를 종합적으로 평가하였다. 특히 네 가지 주요 식물계절 단계인 잎눈파열, 개화시작, 개엽시작, 단풍 절정(90~100%)시기에 초점을 맞추어 종별·지역별 추세를 분석하고, 기상변수와의 상관성을 평가하였다. 이를 통해 한국 산림 생태계의 변화를 확인하고 식물계절의 기후민감성을 정량적으로 제시하여 향후 기후변화 대응 전략 수립을 위한 기초 자료를 제공하고자 한다.
2. 자료 및 방법
2.1 자료
본 연구에서는 2009~2024년 동안 국립수목원을 포함한 전국 10개 수목원에서 수집된 식물계절 모니터링 자료를 활용하였다(Fig. 1, Table 1). 관측은 국립수목원에서 마련한 통일된 지침에 따라 훈련된 관찰자가 7~21일 간격으로 직접 관측목이 위치한 지점에 방문하여 육안(visual observation)으로 수행하였다(KNA, 2021; Table 2). 자료는 잎눈파열, 꽃눈파열, 개엽, 개화, 결실, 단풍, 낙엽 등 총 13개 주요 단계(phenophases)를 포함한다. 각 값은 연도별·종별 상세 정보와 식물계절 단계의 발생일(Day of year, DOY) 기록으로 정리되었다. 본 연구에서는 낙엽활엽수 대표 20종인 개나리, 노각나무, 당단풍나무, 마가목, 미선나무, 백목련, 복자기, 산벚나무, 산수유, 산철쭉, 생강나무, 신갈나무, 아까시나무, 왕벚나무, 자귀나무, 졸참나무, 진달래, 철쭉, 함박꽃나무, 히어리(Fig. 2)의 주요 네 단계 잎눈파열(budburst), 개화시작(flowering), 개엽시작(leaf unfolding), 단풍 90~100% (90~100% fall foliage) 시기에 대한 목측 기록을 사용하였다.
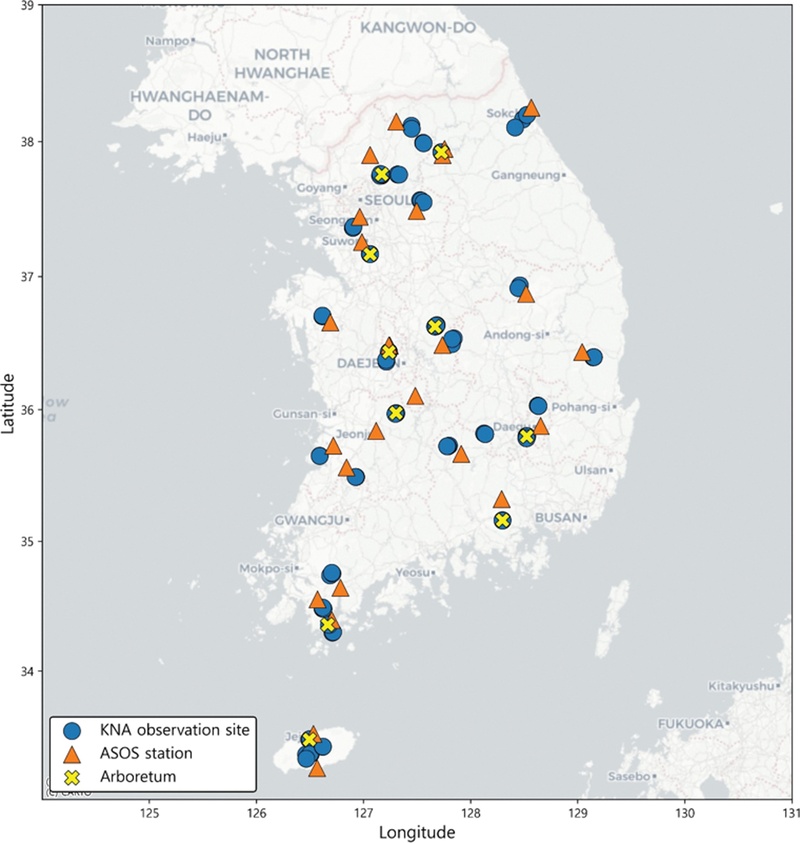
Locations of KNA observation sites (blue circles), arboreta in the KNA network (yellow cross markers), and the nearest ASOS meteorological stations (orange triangles) used in this study. ASOS stations were matched as the closest stations to each KNA observation site for climate-phenology analyses.

Geographic locations of the arboreta included in this study.
Observation guidelines for phenological stages established by the Korea National Arboretum.
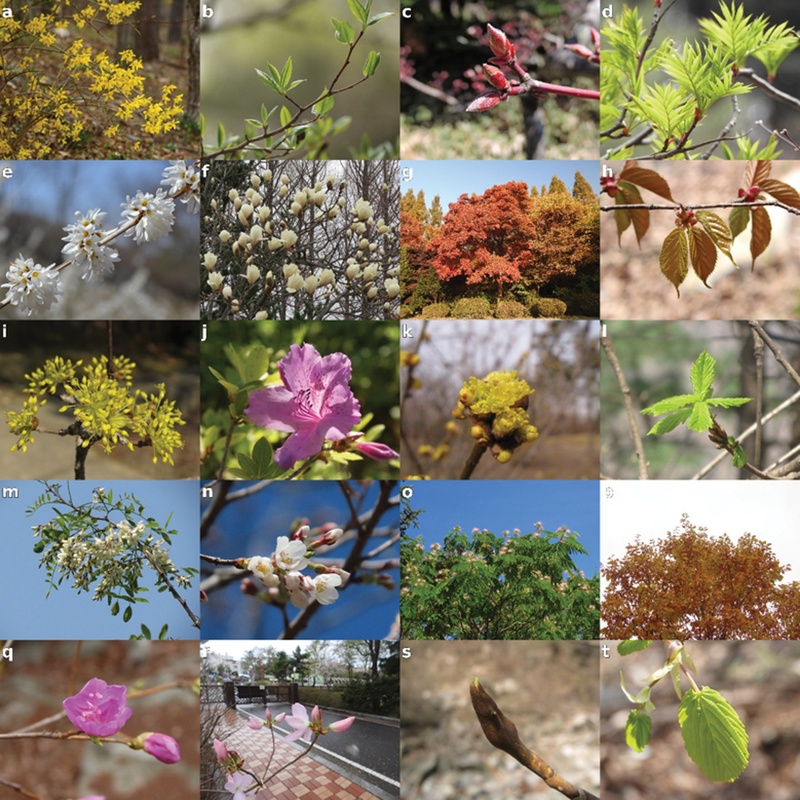
Photographs of 20 representative deciduous broadleaf tree species: (a) Forsythia koreana, (b) Stewartia pseudocamellia, (c) Acer pseudosieboldianum, (d) Sorbus commixta, (e) Abeliophyllum distichum, (f) Magnolia denudata, (g) Acer triflorum, (h) Prunus sargentii, (i) Cornus officinalis, (j) Rhododendron yedoense, (k) Lindera obtusiloba, (l) Quercus mongolica, (m) Robinia pseudoacacia, (n) Prunus yedoensis, (o) Albizia julibrissin, (p) Quercus serrata, (q) Rhododendron mucronulatum, (r) Rhododendron schlippenbachii, (s) Magnolia sieboldii, and (t) Corylopsis coreana. The Korean, full scientific English, and abbreviated names of these species are provided in Supplementary Table 1.
식물계절 변화와 기상 요인 간의 상관성을 평가하기 위하여 기상청 종관기상관측(Automated Synoptic Observing System, ASOS)의 시·일 단위 자료를 활용하였다. 분석에 사용한 기상변수는 기온(oC), 지면온도(°C), 이슬점온도(°C), 상대습도(%), 증기압(hPa), 강수량(mm), 일조시간(hr), 일사량(MJ m−2)이다. 각 변수는 단일 시점의 값이 아닌 누적 또는 평균된 기후 조건이 식물계절 현상에 영향을 줄 수 있음을 고려하여, 1월부터 12월까지 전 기간을 대상으로 2개월 및 3개월 단위의 평균값과 누적값을 산출하였다. 이렇게 산출된 기간별 기상변수와 식물계절 단계 간의 상관성을 비교하여 특정 시기의 특정 기후 요인이 식물계절 현상 발생에 미치는 상대적 영향을 평가하였다. 각 수목원의 관측 지점은 관측목의 위·경도 좌표를 기준으로 최근접 ASOS 지점과 매칭하였다(Fig. 1).
2.2 방법
자료의 특성과 활용 가능성을 파악하기 위하여 단계별 표본 수와 분포를 검토하였다. 이를 위해 각 종별·단계별 관측치의 수를 집계하고, 전체 분포를 시각화하였다(Fig. 3a). 또한 단계별 시기(DOY) 분포를 제시하고 중앙값과 변동성을 확인함으로써 각 단계의 발생 시기 특성과 불확실성을 파악하였다(Fig. 3b). 표본 수가 극히 적거나 결측이 발생한 단계는 이후 분석에서 해석 시 주의가 필요하다고 판단하였다.
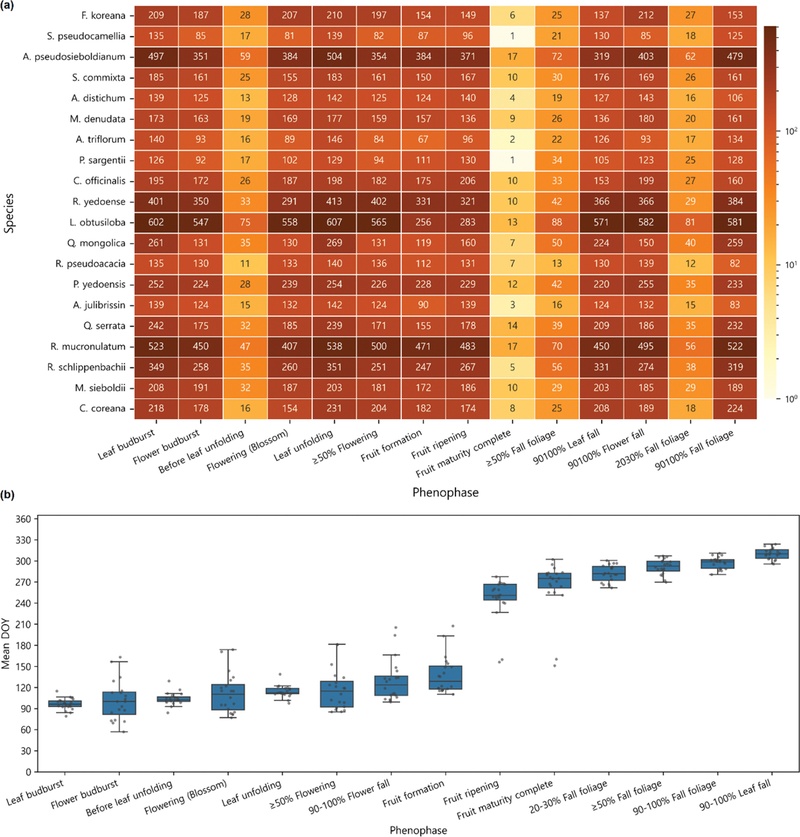
(a) Observation counts of each phenophase for 20 deciduous broadleaf species (log scale). (b) Distribution of mean day of year (DOY) for phenophases across 20 species, shown as boxplots with median order.
식물계절 변화를 정량적으로 평가하기 위하여 낙엽활엽수 대표 20종의 2009~2024년 기간 동안 연도별 잎눈파열, 개화시작, 개엽시작, 단풍 90~100% 단계 시기(DOY)의 평균값에 대해 선형회귀(linear regression)를 적용하여 장기변화 추세(d yr−1)를 산출하였다.
이때, Yt는 해당연도의 DOY, t는 연도, α는 절편, β는 기울기, εt는 오차항이다. β < 0 일 경우 조기화, β > 0일 경우 지연을 의미한다.
산출된 변화 추세(β)의 통계적 신뢰성을 확보하기 위해 p-value 기반의 유의성 검정을 수행하였다. 통계적 유의성은 p < 0.05(*), p < 0.01(**), p < 0.001(***) 수준에서 판단하였다.
장기 추세 분석과 같이 낙엽활엽수 대표 20종 각각에 대한 대표 단계의 연도별 DOY의 추세를 선형회귀 방법으로 산출하였다. 이를 통해 종별로 앞당겨지거나 지연되는 경향의 차이를 평가하였다. 또한 지역을 대표하는 수목원들의 관측 지점을 10개 권역(국립수목원, 강원, 경기, 충북, 충남, 전북, 전남, 경북, 경남, 제주)으로 구분하여 각 지역의 평균 DOY와 추세를 계산하였다. 이를 통해 동일한 식물종이라도 지역별 환경 조건에 따라 변화율이 달라지는지를 비교하고자 했다.
식물계절 변동과 기상요인 간의 관계를 파악하기 위해 잎눈파열, 개화시작, 개엽시작, 단풍 90~100% 시기를 대상으로 기온(°C), 지면온도(°C), 이슬점온도(°C), 상대습도(%), 증기압(hPa), 강수량(mm), 일조시간(hr), 일사량(MJ m−2)과의 상관성 및 영향력을 평가하였다.
2.2.4.1 상관성 분석 및 시기 분할
먼저 피어슨 상관계수(Pearson correlation coefficient)를 산출하여 기상 변수와의 단순 선형 상관성을 분석하고 주요 영향 요인을 탐색하였다. 상관계수 r은 다음과 같이 정의된다.
여기서, Xi는 기상변수 값, Yi는 해당 연도의 DOY, X와 Y는 각각 평균값, n은 표본 수를 의미한다. 유의성 검정은 0.05 수준에서 수행하였다.
그러나 이러한 방식은 특정 계절적 요인의 영향이 희석되거나 과도하게 반영될 수 있다는 분석적 한계를 가지고 있다. 따라서 추가적으로 식물계절 현상에 미치는 기상 요인의 영향을 보다 정밀하고 객관적으로 평가하고자 시기 분할을 도입한 상관성 분석 체계를 추가로 적용하였다. 모든 기상 변수를 1월부터 12월까지의 전 기간을 대상으로 2개월 및 3개월 단위로 시계열적 분할을 수행하여 해당 기간의 평균값 및 누적값을 산출하였다. 이러한 분할은 1월부터 2월, 2월부터 3월과 같이 연속적인 2개월 기간 조건과 1월부터 3월, 2월부터 4월과 같이 연속적인 3개월 기간 조건을 모두 반영하여 분석 범위를 확장하였다. 이를 통해 각 식물계절 현상(잎눈파열, 개화시작, 개엽시작, 단풍 90~100%)에 대해 가장 큰 영향을 미치는 시기와 주요 기상 요인을 도출하였다.
2.2.4.2 다중 선형 회귀 분석 및 최적 변수 선택
식물계절 현상(Y)과 기상 변수(X1, X2, …, Xp)간의 관계를 평가하기 위해 다중 선형 회귀 분석(Multiple Linear Regression)을 아래와 같이 적용하였다.
모델 구축에 앞서 설명 변수 간 다중공선성(Multicollinearity)을 점검하고 모형의 안정성을 확보하기 위해 분산 팽창 요인(Variance Inflation Factor, VIF)을 산출하였다. VIF < 5인 기상 변수만을 최종 모형 선택 과정에 포함하였으며, 이는 다중공선성을 진단할 때 널리 사용되는 비교적 보수적인 임계값으로 모형의 안정성과 회귀계수 추정의 신뢰성을 최대한 확보하기 위해 설정하였다. 이어 각 식물계절 단계(잎눈파열, 개화시작, 개엽시작, 단풍 90~100%)별로 최적의 설명 변수 조합을 찾기 위해 단계적 회귀 분석(Stepwise Regression) 기법을 적용하였다. 모델에 포함될 기상 변수 세트(최적 시기로 분할된 기상 변수 포함)는 Akaike Information Criterion (AIC)를 최소화하는 것을 기준으로 선택하였다. 이 과정으로 통계적으로 가장 효율적이며 예측력이 높은 모형을 구축하고자 했다.
2.2.4.3 모형 설명력 평가 및 검증
구축된 다중 선형 회귀 모형의 설명력 지표로는 결정계수(R2)가 설명변수 개수에 따라 과대 추정될 수 있는 문제를 보완하기 위해 조정된 결정계수(Adjusted R2)를 사용하였다. Adjusted R2는 표본 수(n)와 설명변수 개수(p)를 고려하여 다음과 같이 정의된다.
유의미한 변수가 추가될 때만 값이 증가하고 불필요한 변수가 포함되면 감소하는 지수의 특징을 이용하여, 변수 수가 다른 회귀모형 간 설명력을 보다 공정하게 비교하고자 하였다. 그 결과로 제시된 값은 단계적 회귀 분석을 통해 각 식물계절 단계별로 최적으로 선택된 기상 변수 세트를 사용하여 구축된 모형의 설명력을 나타낸다. 즉, 모든 모델에서 동일한 수의 기상 변수가 사용된 것이 아니라, 최적화된 변수 조합을 통해 도출된 결과이다.
또한, 모형의 신뢰도를 확보하고 과적합(Overfitting) 문제를 방지하기 위해 교차 검증(Cross-Validation) 기법을 적용하여 성능을 검토하였다. 본 연구의 샘플 수(n)가 상대적으로 적은 점을 고려하여, 모형의 예측 성능을 가장 객관적으로 평가할 수 있는 Leave-One-Out Cross-Validation (LOOCV) 검증 기법을 적용하였다. LOOCV는 n개의 표본 중 하나를 검증 세트로, 나머지 n - 1개를 훈련 세트로 사용하여 모형을 n번 구축 및 검증하는 방식으로 통계 모형의 일반화 성능(Generalization Performance)을 확보하는 데 활용된다. 분석 결과는 모형의 설명력(Adjusted R2)과 각 기상변수의 회귀계수로 요약하였으며, 기간별 변수와 식물계절 단계 간 상관관계는 히트맵으로 정리하였다.
3. 연구 결과
3.1 장기 추세 및 종·지역별 경향
국립수목원과 9개 지역별 수목원에서 2009~2024년 동안 수집된 낙엽활엽수 20종의 식물계절 관측 결과, 봄철 현상(잎눈파열, 개엽, 개화) 단계에서 수백 건의 자료가 확보되어 충분한 표본을 보였다. 반면 열매 성숙이나 단풍 초기(20~50%) 단계는 표본 수가 상대적으로 적어 여름철 이후 단계 해석에는 불확실성이 존재하였다. 일부 종에서는 연도별 변동성이 크게 나타나 통계적 유의성을 확보하기에 어려움이 있었다(Fig. 3a). 본 연구에서는 주요 네 단계를 분석하였으나, 전체 관측 순서는 식물계절 현상의 중앙값 기준으로 잎눈파열, 꽃눈파열, 개엽시작(전), 개화시작, 개엽시작, 개화 50% 이상, 낙화 90~100%, 열매 생성, 열매 성숙, 성숙 완료, 단풍(20~30%, 50%, 90~100%), 낙엽 90~100% 순으로 진행되었다. 시기적으로는 ‘열매 생성’에서 ‘열매 성숙’으로 이행하는 구간을 기점으로 이후 단계의 DOY가 급격히 증가하는 것으로 나타났다(Fig. 3b).
낙엽활엽수 20종을 종합해 분석한 결과, 봄철 현상(잎눈파열, 개화시작, 개엽시작)은 일관되게 조기화되었고, 가을철 현상인 단풍 90~100%은 지연되는 경향을 나타냈다(Fig. 4). 그 결과 지난 16년간 생장기는 평균적으로 17~20일 연장된 것으로 나타났다. 구체적으로 2009~2024년 동안 잎눈파열은 -0.94 d yr-1, 개화시작은 -0.83 d yr⁻¹, 개엽시작은 -0.79 d yr-1의 속도로 조기화되었으며, 단풍 90~100%은 +0.33 d yr-1의 속도로 지연되어 봄철 현상이 약 13~15일 조기화되고 가을철 단풍 90~100%은 약 5일 지연된 것으로 해석된다(Fig. 4).
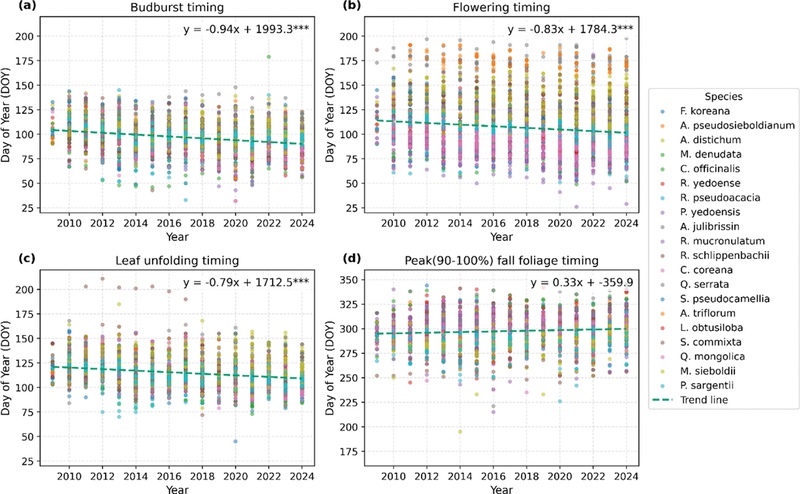
Long-term phenological trends for four key stages (Mean of 20 species DOYs): (a) Budburst, (b) Flowering, (c) Leaf unfolding, (d) Fall foliage (90~100%).
낙엽활엽수 20종의 식물계절 변화를 종별로 분석한 결과, 전반적으로 봄철 현상은 조기화되고 가을철 현상은 지연되는 경향을 보였다. 다만, 각 종별로 조기화 및 지연의 속도에는 차이가 존재하였다. 잎눈파열은 모든 종에서 조기화되었으며, 산수유(-1.39 d yr-1), 노각나무(-1.11 d yr-1), 자귀나무(-1.03 d yr-1)가 상대적으로 빠른 변화를 보였다. 반면 대부분의 종들은 완만한 속도로 앞당겨졌다. 개화시작은 모든 종에서 조기화되었다. 개엽시작은 산벚나무, 졸참나무, 히어리는 -1 d yr-1 이상의 빠른 조기화가 나타났고 대부분 -0.6에서 -0.9 d yr-1 사이의 뚜렷한 조기화가 확인되었다. 단풍 90~100%는 대부분의 종에서 지연되었으나, 지연 폭은 크지 않았다(Fig. 5, Table 3). 이러한 종별 변화 추이를 시각적으로 확인하기 위해 뚜렷한 경향을 보이는 4개 대표종으로 산수유(C. officinalis), 마가목(S. commixta), 개나리(F. koreana), 그리고 함박꽃나무(M. sieboldii)를 Fig. 5에 제시하였다. 나머지 16종의 결과는 Supplementary Fig. S1에 제시하였다.
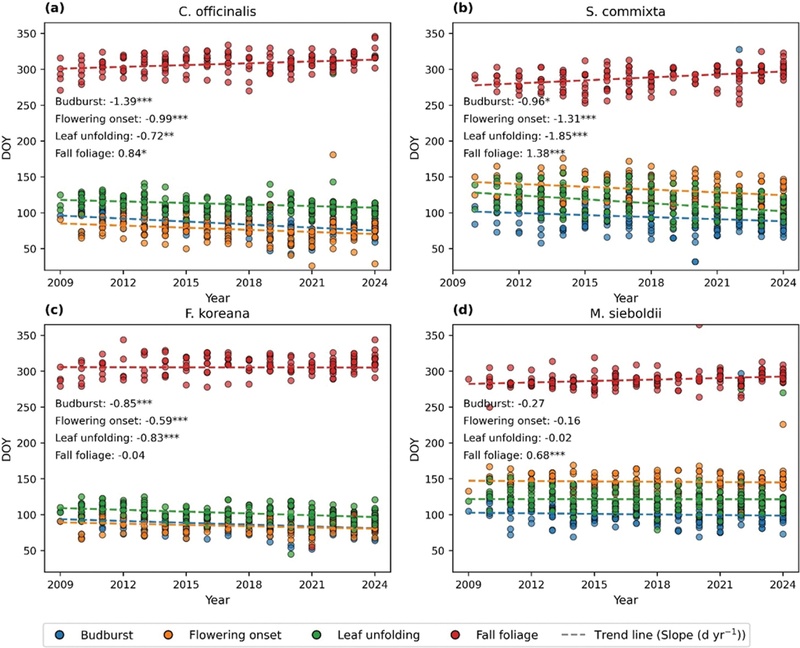
Phenological trends for four representative species of deciduous broadleaf trees (2009~2024). Panels (a) C. officinalis, (b) S. commixta, (c) F. koreana, and (d) M. sieboldii show the annual DOY observations and linear regression trend lines (dashed lines) for the Budburst, Flowering, Leaf unfolding, and 90~100% Fall foliage stages. The trends for the remaining 16 species are presented in Supplementary Fig. S1.
Species-specific phenological trends (d yr-1) for 20 deciduous broadleaf species (2009~2024). Linear regression was applied to the annual mean DOY data for each species and phenophase. Species names are listed in Supplementary Table 1.
지역별 분석 결과, 대부분의 권역에서 봄철 현상은 조기화되고 가을철 단풍은 지연되는 경향을 보였다. 봄철 현상의 경우, 전북(잎눈파열 -1.02 d yr-1)과 충북(개엽시작 -1.16 d yr-1) 지역에서 가장 빠른 조기화 속도가 확인되었으며 수목원중 가장 북단에 위치한 국립수목원 역시 개화시작 시기의 빠른 조기화(-0.92 d yr-1)를 나타냈다. 반면, 강원(잎눈파열 -0.02 d yr-1)과 제주(단풍 90~100% +0.02 d yr-1) 지역은 전반적으로 변화 폭이 가장 작아, 조기화 및 지연 경향이 크게 두드러지지 않았다. 이러한 결과는 동일한 식물종이라도 지역의 여러 환경적 조건에 따라 식물계절 변화의 속도와 방향이 상이하게 나타날 수 있음을 보여준다. 이러한 지역별 변화의 상이성을 명확히 제시하기 위해 최북단 수목원을 대표하는 국립수목원(KNA)과 최남단 지역이자 섬인 제주(HL)의 결과를 Fig. 6에 제시하였으며, 나머지 8개 권역의 결과는 Supplementary Fig. S2에 제시하였다.
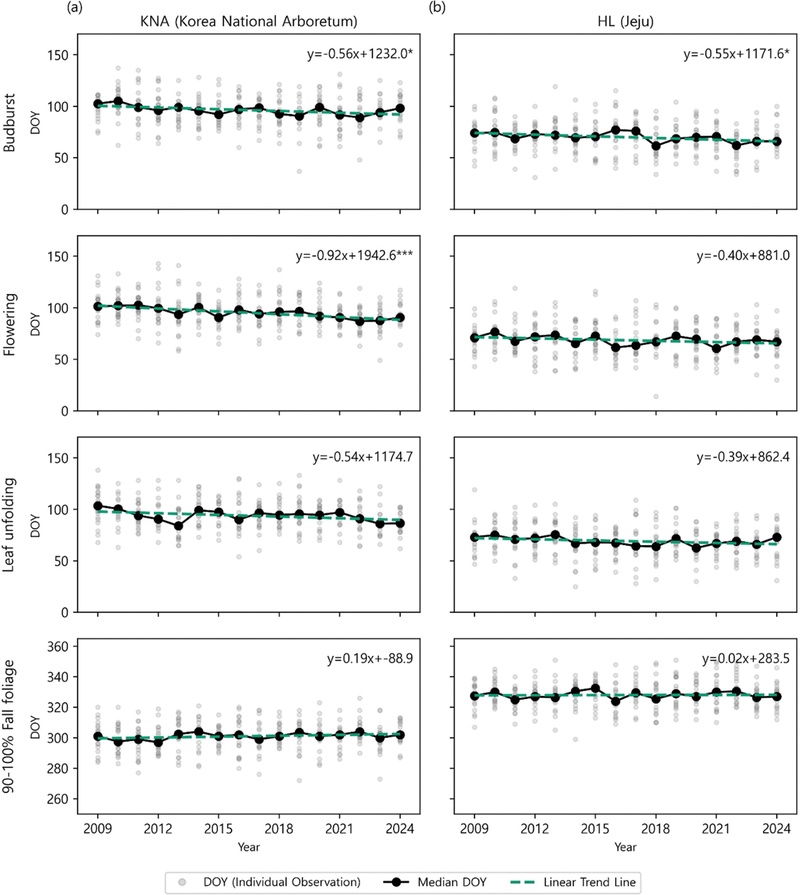
Phenological trends in two contrasting regions, KNA and HL (Jeju), for the 20 representative deciduous broadleaf species (2009~2024). The figure presents the annual DOY observations and trends for four key phenological phases: Budburst, Flowering, Leaf unfolding, and 90~100% Fall foliage. The slope of the trend line (d yr-1) is displayed as the linear equation; asterisks indicate statistical significance (*p < 0.05, **p < 0.01, ***p < 0.001). The trends for the remaining eight regions are provided in Supplementary Fig. S2.
3.2 기상변수의 영향 및 시기별 민감도
단계적 회귀 분석을 통해 최대 5개의 변수로 최적화되어 선택된 기상 요인 모델이 식물계절 현상에 미치는 설명력을 평가한 결과, 개엽시작에서 가장 높은 설명력이 확인되었다. 조정된 결정계수(Adjusted R2) 값은 개엽시작이 0.96으로 가장 높았으며, 개화시작(0.95), 잎눈파열(0.88), 단풍 90~100% (0.84) 순으로 나타났다(Table 4). 이는 5개의 주요 기상 변수만으로도 식물계절 변동의 83% 이상을 설명할 수 있음을 의미하며, 특히 봄철 단계의 설명력이 매우 높음을 정량적으로 보여준다(Fig. 7a).
Summary of optimal multiple regression models. Predictors were screened (VIF < 5) and selected via AIC-based backward stepwise regression; performance was evaluated by year-wise leave-one-out cross-validation (LOOCV; see Methods 2.2.4).
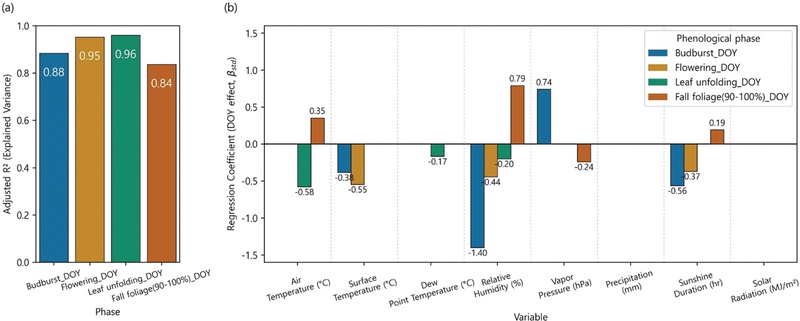
Effects of climatic variables on phenological events. (a) Adjusted R2 of the final multiple‐regression models for each phase. (b) Standardized coefficients (βstd) aggregated by variable group (negative = advancement; positive = delay). Vertical dashed lines mark group boundaries. See Methods 2.2.4 and Table 4 for model selection and validation.
모형의 신뢰도는 LOOCV 검증을 통해 확인되었다. LOOCV R2 값은 개엽시작(0.93)과 개화시작(0.92)에서 높게 나타났으며, 모든 모형의 예측 오차(RMSE)는 1.2일에서 2.5일 수준으로 모형의 높은 일반화 성능을 입증한다. 각 식물계절 현상에 대해 최적으로 선택된 변수들의 회귀계수와 그 영향력은 Table 4에 요약되었다. 각 단계별 최종 모형에서 선택된 기상요인의 영향 방향과 상대적 기여도는 표준화 회귀계수(βstd)로 비교하고 이를 기상요인 그룹별로 요약하였다(Fig. 7b). 음의 계수는 시기 조기화, 양의 계수는 시기 지연을 의미한다. 잎눈파열과 개화시작에서는 지면온도, 상대습도, 일조시간의 증가가 시기를 앞당기는 데 기여하였다. 개엽시작은 기온, 이슬점온도, 상대습도의 상승이 조기화 요인으로 나타났다. 단풍 90~100%는 기온, 상대습도, 일조시간의 증가에 따라 시기가 지연되는 경향을 보였다. 반대로 증기압의 상승은 잎눈파열을 지연시키고 단풍을 앞당기는 효과를 나타냈다.
식물계절 현상과 기상변수 간의 기간별 Pearson 상관분석 결과, 각 단계별로 뚜렷한 민감 시기가 구분되었다. 모든 상관계수는 p < 0.05 수준에서 통계적 유의성이 확인되었다. 잎눈파열은 주로 1~3월(기온 r=-0.75, 지면온도 r=-0.78)과 2~4월(기온 r=-0.73, 지면온도 r=-0.76)의 기온 및 지면온도와 강한 음의 상관을 보여 이 시기의 열 조건이 봄철 잎눈파열 시기에 결정적 영향을 미치는 것으로 나타났다(Fig. 8a). 개화시작 역시 유사한 패턴을 보였으며 특히 1~3월(지면온도 r=-0.80), 2~4월(-0.79), 3~5월(-0.77)의 지면온도와 가장 밀접한 음의 상관을 나타내 초봄 지면온도의 영향이 두드러졌다(Fig. 8b). 개엽시작은 2~4월(기온 r=-0.69, 지면온도 r=-0.71)과 3~5월(기온 r = -0.66, 지면온도 r=-0.70)에서 가장 높은 음의 상관을 보여 봄철 열 환경에 대한 민감성이 다시 한번 확인되었다(Fig. 8c). 반면 단풍 90~100%은 전혀 다른 시기의 영향을 받는 것으로 나타났다. 여름철인 7~8월(기온 r = 0.64, 지면온도 r = 0.64, 이슬점온도 r = 0.63)과 8~9월(기온 r = 0.69, 지면온도 r = 0.71, 이슬점온도 r = 0.62)에서 뚜렷한 양의 상관을 보였다. 이와 함께 같은 기간의 일조시간과 일사량도 r = 0.4~0.6 수준의 양의 상관을 보여 늦여름의 따뜻하고 습윤하며 광 조건이 가을철 단풍 지연을 유발하는 주요 요인으로 작용함을 시사하였다(Fig. 8d).
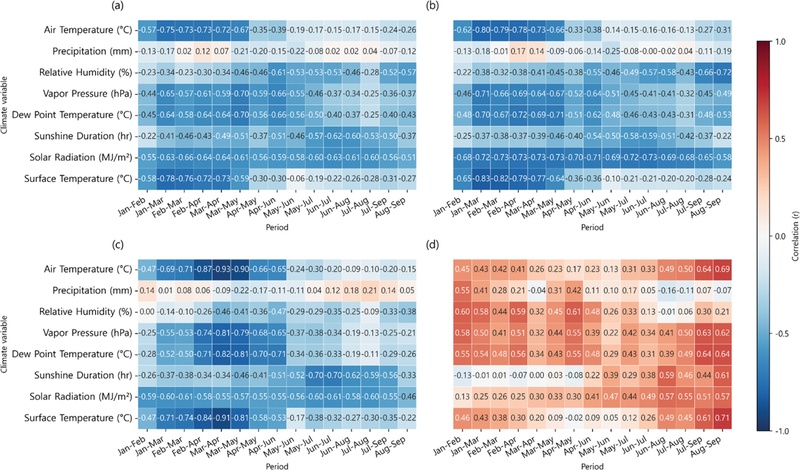
Correlations between phenological events and climatic variables across different periods. (a) Budburst, (b) Flowering, (c) Leaf unfolding, and (d) 90~100% Fall foliage. Values represent Pearson correlation coefficients (r).
4. 논의 및 결론
본 연구는 2009년부터 2024년까지 국립수목원의 장기 관측 자료를 활용하여 한국 낙엽활엽수 20종의 식물계절 변화를 정량적으로 분석하였다. 기후변화에 따른 장기적 변화 추세와 종별·지역별 반응 차이를 비교하고 주요 기상 요인과의 관계를 확인하고자 하였다.
분석 결과, 잎눈파열, 개화시작, 개엽시작과 같은 봄철 현상은 연평균 -0.94, -0.83, -0.79 d yr-1의 속도로 조기화된 반면, 단풍 90~100%은 +0.33 d yr-1 수준의 지연을 보였다. 그 결과 평균 생장기는 17일 이상 연장되었으며 이는 최근 16년간 기후변화에 따라 한국 산림 생태계가 뚜렷한 계절적 변화를 겪고 있음을 보여준다. 시기별 분석에서는 16년간 평균 DOY 분포를 통해 ‘열매 생성–열매 성숙’ 단계 사이 DOY가 급격히 증가하는 전환점(Fig. 3b)이 확인되었는데, 이는 생장기 후반에서 가을철 현상으로 넘어가는 뚜렷한 생리적 전환점을 반영하는 것으로 해석된다.
종별 분석에서는 산수유와 자귀나무가 빠른 조기화를, 참나무류가 완만한 조기화를 보였으며, 일부 종은 변화가 크지 않았다. 단풍 90~100%의 경우 당단풍나무와 산벚나무는 앞당겨진 반면, 노각나무와 백목련은 지연되어, 동일한 낙엽활엽수라 하더라도 종 특이적 생리·생태적 기작과 환경 적응 능력에 따라 기후민감도가 다르게 나타남을 확인하였다. 지역별로는 전국 대부분 권역에서 봄철 현상 조기화와 가을철 단풍지연 경향이 나타났으나 그 뚜렷한 정도는 현상별로 상이하였다. 반면 강원과 제주와 같이 고위도이거나 해양 영향이 큰 지역에서는 변화 폭이 상대적으로 작거나 통계적 유의성이 확보되지 않았다. 이는 지역별 환경 조건을 해당 지역의 식물계절 반응과 분리하여 해석하기 어렵다는 점을 보여준다.
기상요인과의 관계에서는 봄철 현상이 1~3월에서 3~5월의 기온·지면온도와 강한 음의 상관을, 가을철 단풍은 7~9월의 기온·지면온도·이슬점온도와 뚜렷한 양의 상관을 보였다. 특히 개화시작은 0.95의 조정된 설명력(Adjusted R2)을 나타내며 기상요인의 영향을 매우 민감하게 반영하였고, 단풍 90~100%은 0.84로 상대적으로 설명력이 낮아 다양한 요인의 복합적 영향을 시사하였다(Figs. 7, 8). 종합적으로 볼 때, 본 연구를 통해 봄철 식물계절 현상은 겨울-초봄의 열 조건에 의해 조기화 되고 가을철 단풍은 늦여름의 따뜻하고 습윤한 기후 조건에 의해 지연되는 경향이 정량적으로 확인되었다. 이는 기후 요인이 계절별로 상이하게 작용하며, 기후변화가 각 생리 과정에 차별적인 영향을 미칠 수 있음을 의미한다. 이러한 결과는 봄철 현상이 겨울–초봄의 열 조건에 민감하고, 가을철 단풍은 여름 후반의 열·수분 조건에 의해 지연된다는 기존 연구(Kim et al., 2022)와 일관된다. 본 연구는 장기 관측자료를 활용하여 이러한 관계를 재검증하고 종합적으로 보완했다는 점에서 의의가 있다.
이러한 생장기 연장 추세는 기후변화가 지속될 경우 한국 산림의 생장기 연장이 더욱 가속화되어 영양분 재분배, 수분 매개 곤충과의 상호작용, 탄소 순환 등 생태계 기능 전반에 연쇄적인 영향을 미칠 것으로 예상된다. 본 연구에서 사용된 식물계절 관측 자료는 육안 관측 및 7~21일 간격의 간헐적인 관측 빈도 특성상 내재적인 한계를 가진다. 특히 관찰자의 주관성이 데이터에 반영될 수 있으며 관측 빈도가 낮아 특정 현상(예: 열매 성숙, 단풍 초기)의 정확한 시점 포착 및 기록 확보에 불확실성이 존재한다. 그럼에도 이 자료는 국내에서 가장 장기적이며 지역 해상도가 높은 관측 기록이다.
본 연구의 장기적 정량 분석 결과는 국외 선행연구의 주요 결과와 일치하는 동시에 한국 산림 생태계에 고유한 활용 가치를 제시한다. 유럽과 북미 지역의 연구들은 봄철 식물계절 현상의 뚜렷한 조기화와 가을철 노화 시점 변화로 인한 생장기의 연장을 보고했다(Vitasse et al., 2021; Bloom et al., 2022; Zohner et al., 2023). 본 연구에서는 봄철 조기화와 가을철 지연 간의 비대칭적 변화를 국내 환경에서 명확히 확인했다. 특히 일관되게 빨라지는 봄철 현상 조기화는(연평균 약 -0.9 d yr-1) 한국 산림 역시 전 지구적인 기후변화에 매우 민감하게 반응하며 그 변화의 폭이 국제적인 추세와 비견될 만큼 심각함을 정량적으로 입증한다는 점에서 의미가 있다.
향후 연구에서는 원격 탐사, 영상, 시민 과학 등 다양한 자료를 통합하여 모니터링의 한계를 보완할 필요가 있다. 이러한 노력이 분석의 정확성과 해석의 정밀도를 높이는 중요한 기반이 될 것으로 기대된다.
Acknowledgments
본 연구는 산림청 국립수목원 「2025년 식물계절 관측 자료를 활용한 기후변화 영향 분석 및 예측」(과제번호: 0434-20250034)의 지원으로 수행되었습니다.
References
-
Bloom, T. D. S., D. S. O’Leary, and C. Riginos, 2022: Flowering time advances since the 1970s in a sagebrush steppe community: Implications for management and restoration. Ecol. Appl., 32, e2583.
[https://doi.org/10.1002/eap.2583]

-
IPCC, 2022: Climate change 2022: Impacts, adaptation and vulnerability. Contribution of Working Group II to the Sixth Assessment Report of the Intergovernmental Panel on Climate Change. Cambridge University Press.
[https://doi.org/10.1017/9781009325844]
-
Jeong, S.-J., C.-H. Ho, H.-J. Gim, and M. E. Brown, 2011: Phenology shifts at start vs. end of growing season in temperate vegetation over the Northern Hemisphere for the period 1982–2008. Global Change Biol., 17, 2385-2399.
[https://doi.org/10.1111/j.1365-2486.2011.02397.x]
-
Kim, J., S. Jeong, C.-E. Park, H. Park, S. Son, and S. Y. Kim, 2022: Regional and species variations in spring and autumn phenology of 25 temperate species in South Korea. Asia-Pac. J. Atmos. Sci., 58, 181-195.
[https://doi.org/10.1007/s13143-021-00247-0]
- KNA, 2021: Conservation and adaptation of climate-vulnerable forest plant species: Monitoring manual for phenological indicators of climate change. Korea National Arboretum, 176 pp.
-
Körner, C., and D. Basler, 2010: Phenology under global warming. Science, 327, 1461-1462.
[https://doi.org/10.1126/science.1186473]
-
Lee, S., S. Jeong, C.-E. Park, and J. Kim, 2022: A simple method of predicting autumn leaf coloring date using machine learning with spring leaf unfolding date. Asia-Pac. J. Atmos. Sci., 58, 219-226.
[https://doi.org/10.1007/s13143-021-00251-4]
-
Piao, S., and Coauthors, 2019: Plant phenology and global climate change: Current progresses and challenges. Global Change Biol., 25, 1922-1940.
[https://doi.org/10.1111/gcb.14619]
-
Richardson, A. D., and Coauthors, 2018: Tracking vegetation phenology across diverse North American biomes using PhenoCam imagery. Sci. Data, 5, 180028.
[https://doi.org/10.1038/sdata.2018.28]
-
Seyednasrollah, B., A. D. Richardson, K. Hufkens, T. Milliman, and A. D. Frolking, 2019: PhenoCam dataset v2.0: Vegetation phenology from digital camera imagery, 2000-2018. Sci. Data, 6, 222.
[https://doi.org/10.1038/s41597-019-0229-9]
-
Vitasse, Y., and Coauthors, 2021: Phenological and elevational shifts of plants, animals and fungi under climate change in the European Alps. Biol. Rev., 96, 1816-1835.
[https://doi.org/10.1111/brv.12727]
-
Wang, S., X. Wang, G. Chen, Q. Yang, B. Wang, Y. Ma, and M. Shen, 2017: Complex responses of spring alpine vegetation phenology to snow cover dynamics over the Tibetan Plateau, China. Sci. Total Environ., 593-594, 449-461.
[https://doi.org/10.1016/j.scitotenv.2017.03.187]
-
Wolkovich, E. M., B. I. Cook, and T. J. Davies, 2013: Progress towards an interdisciplinary science of plant phenology: Building predictions across space, time and species diversity. New Phytol., 201, 1156-1162.
[https://doi.org/10.1111/nph.12599]
-
Zohner, C. M., and Coauthors, 2023: Effect of climate warming on the timing of autumn leaf senescence reverses after the summer solstice. Science, 381.
[https://doi.org/10.1126/science.adf5098]
Appendix
SUPPLEMENTARY
Tree Species Names (Korean-English, abbreviated version).
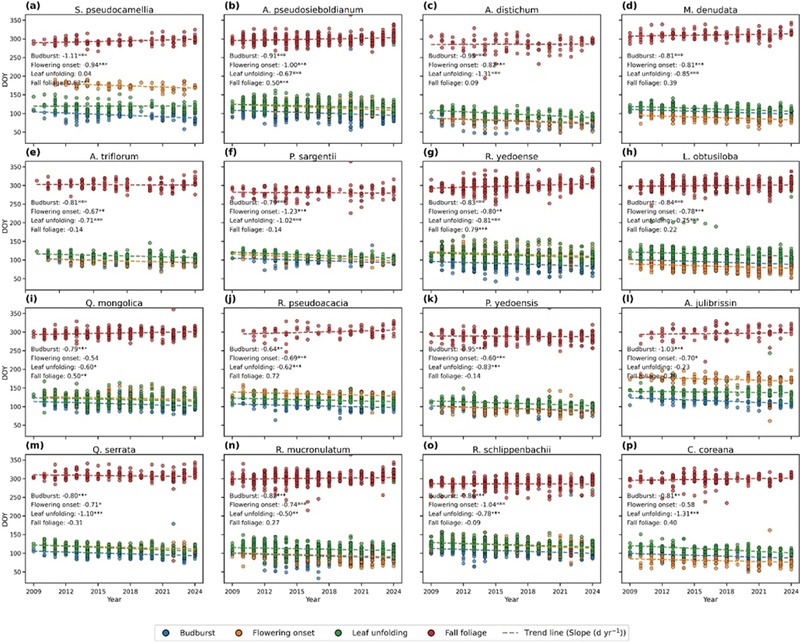
Phenological trends for the remaining 16 species of deciduous broadleaf trees (2009~2024). (a) through (p) show the annual DOY observations and linear regression trend lines (dashed lines) for the Budburst, Flowering, Leaf unfolding, and 90~100% Fall foliage stages for the species not included in Fig. 5. The statistical values for these species are included in Table 3.
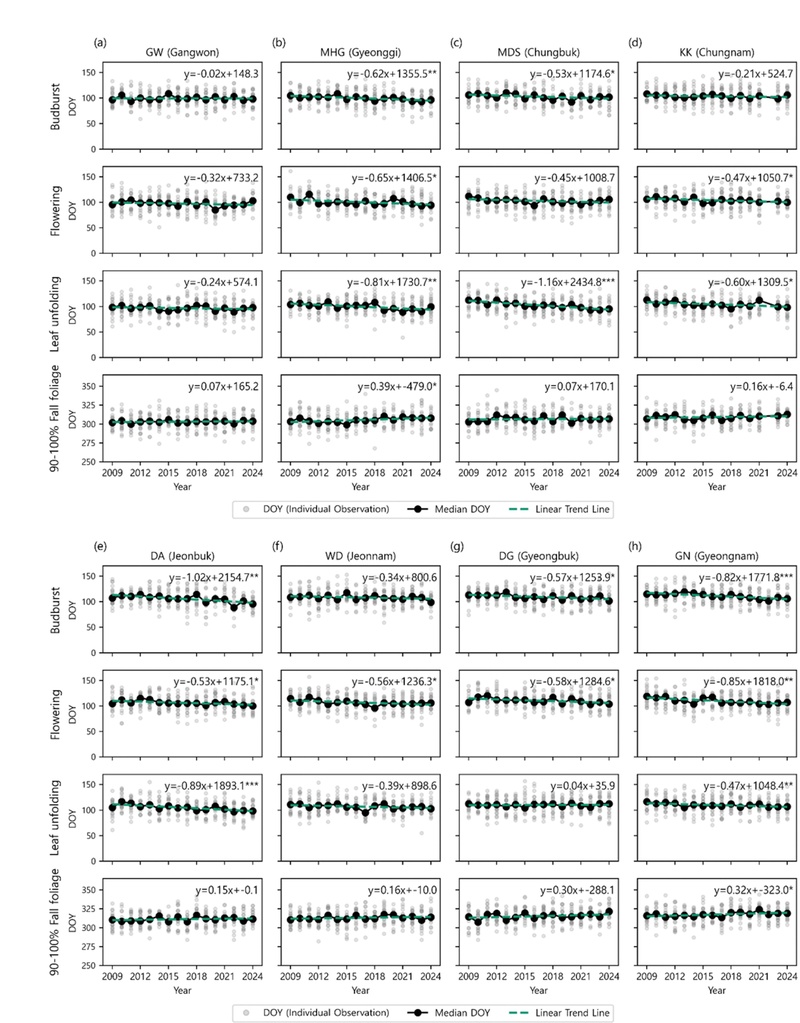
Regional phenological trends for the eight regions excluded from Fig. 6 (2009~2024). The figure presents the annual DOY observations and trends for four phenological phases (Budburst, Flowering, Leaf unfolding, and 90~100% Fall foliage) across the eight regions (Gangwon, Gyeonggi, Chungbuk, Chungnam, Jeonbuk, Jeonnam, Gyeongbuk, and Gyeongnam). The slope of the trend line (d yr-1) is displayed as the linear equation; asterisks indicate statistical significance (*p < 0.05, **p < 0.01, ***p < 0.001).