Hadley Circulation Strength Change in Response to Global Warming: Statistics of Good Models
Abstract
In this study, we examine future changes in the Hadley cell (HC) strength using CMIP5 climate change simulations. The current study is an extension of a previous study by Seo et al. that used all 30 available models. Here, we select 18-23 well-performing models based on their significant internal sensitivity of the interannual HC strength variation to the latitudinal temperature gradient variation. The model projections along with simple scaling analysis show that the inter-model variability in the HC strength change is a result of the inter-model spread in the meridional temperature gradient across the subtropics for both DJF and JJA, not by the tropopause height or gross static stability change. The HC strength is expected to weaken significantly during DJF, while little change is expected in the JJA HC strength. Compared to the calculations with all model members, selected model statistics increase the linear correlation between the changes in HC strength and meridional temperature gradient by 13~23%, confirming the robust sensitivity of the HC strength to the meridional temperature gradient. Two scaling equations for the selected models predict changes in HC strength better than all-member predictions. In particular, the prediction improvement in DJF is as high as 30%. The simple scaling relations successfully predict both the ensemble-mean changes and model-to-model variations in the HC strength for both seasons.
Keywords:
Hadley cell strength, global warming, CMIP5, meridional temperature gradient1. Introduction
The annually averaged Hadley circulation is predicted to weaken under future global warming (Held and Soden, 2006; Lu et al., 2007; Ma et al., 2012). The multimodel ensemble mean of Climate model simulations from both Coupled Model Intercomparison Project Phases 3 and 5 (CMIP3 and CMIP5) indicates an annual weakening of 1.1~1.2%/K with a range of −0.2~3.7% K−1. However, the future changes in the Hadley cell (HC) strength exhibit a seasonal contrast: a robust weakening during December-January-February (DJF) vs. a slight weakening during June-July-August (JJA) (Seo et al., 2014; SFS hereafter). While these ensemble-mean HC strength changes are different, both seasons show relatively large model-to-model variations. Under a nominal 2~3 K increase in the global surface temperature in a warming climate, the difference in the changes of HC strength among models amounts to 15~20%.
SFS demonstrated the potential mechanisms for future changes in the HC strength and model-to-model strength variations using simple scaling relations. The near-inviscid theory for axisymmetric circulation combined with a steady state and no vertical advection of momentum assumptions, where the angular momentum of poleward-moving upper air in the HC is assumed to be materially conserved (Held and Hou, 1980), provides the following scaling relation for the HC strength (Vallis, 2006): , where ψ is the zonally averaged meridional overturning streamfunction and H is the tropopause height. is the dry static stability of the tropical troposphere and is the tropospheric mean meridional potential temperature gradient across the subtropics divided by a hemispheric troposphere mean potential temperature of θ0. The second scaling theory is related to the argument that the width of the HC is fundamentally controlled by extratropical baroclinic eddies (Held, 2000) in a way that in steady state, the eddies leading to an eastward acceleration in the upper troposphere induce a counteracting westward Coriolis acceleration and thus an equatorward upper-level flow, which acts to terminate the HC. Thus, the HC edge is set as the poleward flank where the angular momentum conserving circulation regime is broken by subtropical baroclinically unstable shear (see also Lu et al., 2007; Kang and Lu, 2012) or determined equivalently by the equatorward edge of the midlatitude jets. The dependence of the HC width in this theory on earth’s radius, rotation rate, gravity and the HC height is weaker than that estimated from Held and Hou model and the two theories can be related to the following relationship (Held, 2000): , where φHH and φBC are the widths of the HC for the first and second scalings. However, still we need a Held and Hou scaling for the vertical velocity, so it is a hybrid relation, which can be expressed as (see SFS for the detailed derivation of this second scaling relation). These succinct scaling relations demonstrate that the HC strength is related to only three factors: the tropopause height, meridional potential temperature gradient, and gross static stability.
As shown in SFS, the inter-model spread of the HC strength change is attributed to the variations in the meridional potential temperature gradient among models. Changes in the HC strength are insensitive to the other two factors. The present study revisits SFS’s results that find boreal wintertime and summertime correlations between the changes in HC strength and meridional temperature gradient for 30 climate models. These correlations are found to be 0.59 and 0.67, respectively, and the estimated HC strength change correlations between the first scaling relation and the direct model data (Fig. 4 in SFS) are shown to be 0.55 and 0.72, respectively. Although statistically significant, the correlations can be improved by checking how sensitive HC strength is to the meridional temperature gradient for each model and excluding the poorly performing models for the interannual correlation between HC intensity and meridional temperature gradient. Thus, our purpose is to build on the SFS study by considering only well-performing models. By verifying robustness in the necessary relationships, we can increase confidence in the major controlling process on HC strength change. Data and methods are described in section 2. Section 3 presents correlations between the changes in HC strength and meridional temperature gradient for selected models, and correlations calculated from the scaling relations and from selected model data. Section 4 summarizes the results.
2. Datasets and Methods
Since the HC in the winter hemisphere is stronger, we only consider future changes in the HC strength for the Northern Hemisphere (NH) during DJF and for the Southern Hemisphere (SH) during JJA separately. As in SFS, the present climate is defined as the first twenty years (2001~2020) of the 21st century and the future climate as the last twenty years (2081~2100) of the century. For future climate, the simulation data from the representative concentration pathway (RCP) 8.5 scenario are used. Monthly mean data are converted into a 2.5o × 2.5o longitude-latitude grid. The following 30 models are analyzed (numbers in plots denote models in the following sequence): ACCESS1-0, ACCESS1-3, BCC-CSM1-1, BNU-ESM, CanESM2, CCSM4, CESM1-BGC, CESM1-CAM5, CMCC-CM, CNRM-CM5, CSIRO-Mk3-6-0, FGOALS-g2, FGOALS-s2, FIOESM, GFDL-CM3, GFDL-ESM2G, GFDL-ESM2M, HadGEM2-CC, HadGEM2-ES, INMCM4, IPSL-CM5ALR, IPSL-CM5A-MR, MIROC5, MIROC-ESM-CHEM, MIROC-ESM, MPI-ESM-LR, MPI-ESM-MR, MRICGCM3, NorESM1-ME, and NorESM1-M.
The HC is represented by the zonally averaged mass streamfunction (ψ) and its strength during DJF or JJA is defined respectively as the maximum or minimum ψ within the tropics around 500 hPa. As in SFS, the equator-to-higher latitude differences in potential temperature across the winter subtropics are estimated by for DJF and in JJA. Well-performing models are selected by calculating correlations between interannual changes in HC strength and meridional temperature gradient for each model using 100-year data from the 21st century. Models are selected if they have a statistically significant correlation at the 5% level estimated by the Student t-test. For DJF (JJA), 18 (23) models are selected as good models. DJF selections include all JJA models except two models of MIROC5 and MIROC-ESM.
3. Results
First, we provide a simple argument that the meridional temperature gradient is the most important factor in the two scaling equations by examining the characteristics of the gross static stability and tropopause height. These two variables were analyzed to be highly correlated in CMIP3 by Lu et al. (2007). Figure 1 shows the correlation between the interannual variations in static stability and tropopause height for 100-year data of the 21st century for each individual model for DJF and JJA. Individual model correlation for both seasons ranges from 0.80 to 0.99. The 30-model average correlations are 0.95 and 0.96 for DJF and JJA. This strong correlation is attributed to an enhanced warming in the tropical upper troposphere and subsequent increase in static stability and tropopause height (e.g., Figs. 2b, c and 3b, c) through the moist adiabatic adjustment in response to global warming. Then, replacing ΔV with H gives the following scaling relations: ψ∝(H3/2ΔH5/2) and ψ∝(H3/2ΔH2), which apparently indicate a larger exponent in ΔH than in H. So theoretically the HC strength is dominated by the meridional temperature gradient across the subtropics, provided that the HC strength variation is accounted for by the simple scaling relations.
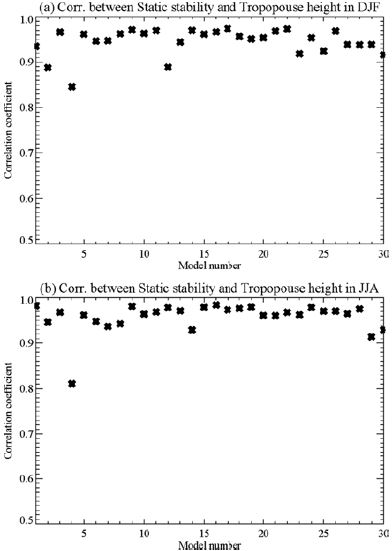
Interannual correlations between gross static stability and tropopause height for (a) DJF and (b) JJA for 30 individual models.
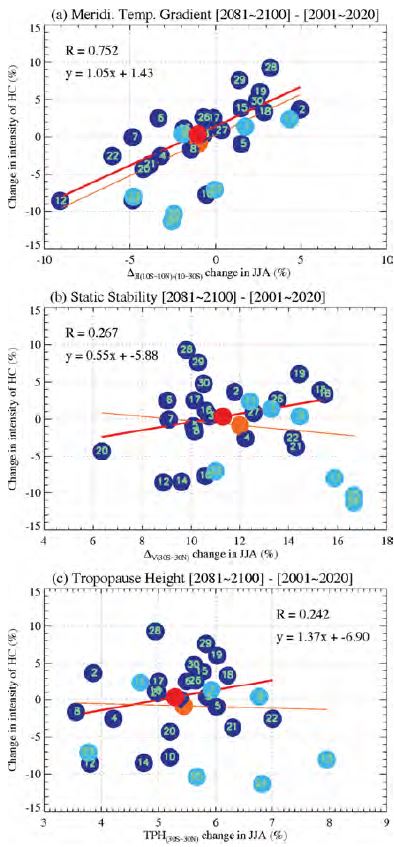
Figures 2 and 3 show changes in the HC strength for selected models (dark dots) and their relationships with the three factors in the scaling equations during DJF and JJA, respectively. In the figures, a sky blue dot denotes the poorly performing model and is excluded in the calculation of correlation. While the HC weakening is a robust feature in DJF, the ensemble-mean HC strength changes little in JJA (Figs. 2 and 3). The good model composite streamfunction plots (Fig. 4) clearly show this property with the statistically significant (dotted line in Fig. 4a) weakening in DJF and a negligible increase in the JJA strength (i.e., blue shading in Fig. 4b). These peak strength changes are related to changes in the meridional circulation strength in the ascending branch during both seasons (Tanaka et al., 2004). Interestingly, the tropical tropopause height in JJA appears to change greater than that in DJF. In fact, this can be seen in the average percentage tropopause height changes in Figs. 2c and 3c: 4.1% in DJF vs 5.3% in JJA.
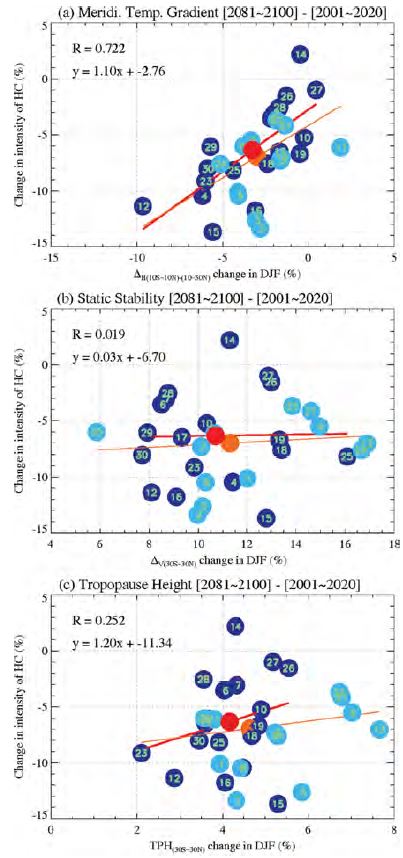
Changes in the HC strength (%) against changes in (a) meridional potential temperature gradient measured as ∆H=θ10S-10N-θ10N-50Nθ0 , (b) tropical static stability ΔV, and (c) subtropical tropopause height during DJF for good models (dark dots). Linear correlation coefficients and regression equations for good models are shown in the plot (i.e., sky blue dots are excluded in the calculation of the statistics). Red line shows a regression line for good models and orange line for all models.
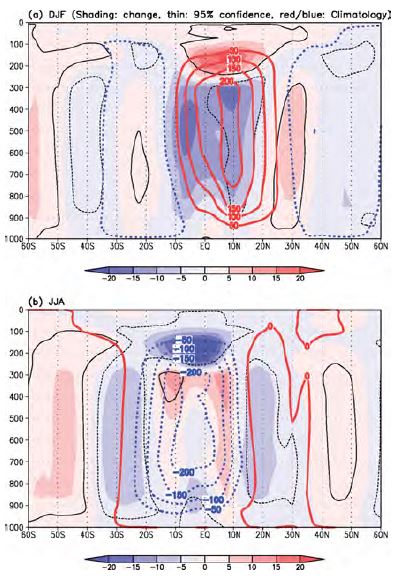
The 18- and 23-model ensemble-mean streamfunction change (color shading, 109 kg s−1) between the first and last twenty years of the 21st century during (a) DJF and (b) JJA, respectively. Thick contours denote the climatology of the present climate (i.e., the first twenty years of the 21st century). Thin lines represent the significant regions at the 95% confidence level based on the Student t-test. Positive streamfunction (thick red line) shows a clockwise circulation.
In Fig. 2, the DJF ensemble-mean HC strength change (−6.3%) estimated from the selected models is not varied much compared to the all-model ensemble mean change (−6.9%) (SFS). Yet, the JJA ensemble-mean HC strength change gets much close to zero (Fig. 3): 0.3% from the selected models vs. −0.8% from the all models, implying that the strength of the boreal summer HC is not expected to change much in response to climate change (Ma and Xie, 2013). In Figs. 2a and 3a, the HC strength change is significantly correlated with the change in the meridional temperature gradient across the subtropics for both seasons. The correlations using only good models increase to 0.72 from 0.59 for DJF and to 0.75 from 0.67 for JJA, corresponding to 23% and 13% improvement relative to the all-member statistics. The difference in correlation coefficient due to the reduction of the samples is calculated as 0.107~0.128 for DJF and 0.052~0.064 for JJA at the 5% significant level, depending on how the effective degree of freedom is calculated. The upper limit in this range is determined by considering that several models show different versions of the same model and their performance in simulating the three variables (meridional temperature gradient, tropical static stability and tropopause height) used in Figs. 2 and 3 is really similar. Therefore, the increases in the two linear correlation coefficients surpass these thresholds so the improvement in the regression can be assessed statistically significant. The improvement comes from the exclusion of poorly performing models: for example, 2, 5, and 11 in DJF and 23, 24, and 25 in JJA.
The positive correlation means that a more reduced meridional temperature gradient produces a greater weakening of the HC. The evident weakening in the DJF strength is caused by the reduced meridional temperature gradient for almost all selected models, whereas the variations in the JJA meridional temperature gradient cluster near zero. The reduced meridional temperature gradient shown in 14 models and the enhanced gradient in 9 models cancel each other significantly during JJA.
In contrast, changes in tropical static stability (Figs. 2b and 3b) or tropopause height (Figs. 2c and 3c) during both DJF and JJA are not significantly related to changes in the HC strength. Increases in static stability or tropopause height increase are known to be responsible for the poleward widening of the HC mainly because the baroclinically unstable region (so the edge of the HC) is forced to move poleward (e.g., Frierson et al., 2007; Lu et al., 2007; Kang and Lu, 2012). However, the present study shows that the inter-model spread in the meridional temperature gradient across the subtropics for both season is analyzed to determine the inter-model variability in future HC strength change.
The percentage changes in the multi-model ensemble-mean HC strength are also estimated through the two scaling relations as in SFS. The relevant percentage changes are shown as and , where δ denotes the future change. The two scaling relations using the three terms on the right hand side, as seen in Figs. 2 and 3, give −8.2% and −4.9% for DJF and −1.2% and 0.9% for JJA. The mean changes predicted directly from the model data are −6.3% for DJF and −0.3% for JJA, which are well within the range provided by the right sides of the equations, suggesting that the succinct scaling consideration shown above is effective for the estimation of the multi-model ensemble mean change.
Figures 5 and 6 show percentage changes in the HC strength during DJF and JJA for the two scaling equations. The HC strength changes calculated from the combination of the meridional temperature gradient, static stability and tropopause height are well aligned with the direct strength changes from the model data. By including only models with good sensitivity, correlations are greatly improved. Exclusion of bad models in DJF such as 2, 5, and 11 (with the greatest deviations from regression lines in Figs. 5a and 6a) greatly improves correlations in both scaling relations such that the use of 30 models gives a correlation of 0.55, whereas the current statistics produce 0.72, a statistically significant improvement by as much as 30%. The JJA regression fidelity improves by 7%. In this case, the models 23, 24, and 25 tend to deteriorate the correlation statistics (see Figs. 5b and 6b). The second scaling partly considers the effect of baroclinic eddies; so as in the Held (2000) theory which predicts a stronger Hadley cell than the first theory, the predicted values on the abscissa in Figs. 5 and 6 from the second scaling are larger than those from the first scaling. However, as in Levine and Schneider (2011), as the climate warms, the Hadley circulation shifts toward the angular momentum conserving regime and this is why the above two scaling approximations work effectively in our analysis because both scaling relations are associated with the HC theory based on the angular momentum conserving constraint.
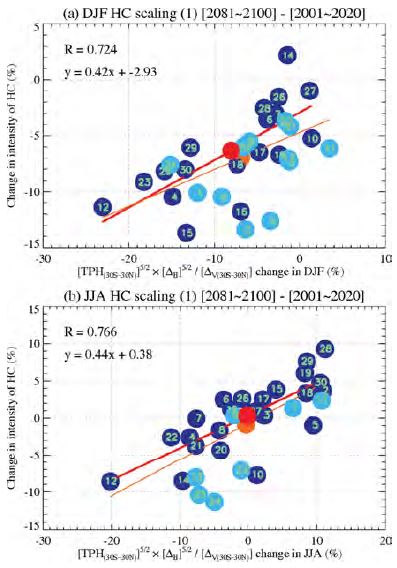
Changes in the HC strength (%) during (a) DJF and (b) JJA according to the first scaling relation. Sky blue dots are excluded in the calculation of the statistics. Red line shows a regression line for good models and orange line for all models.
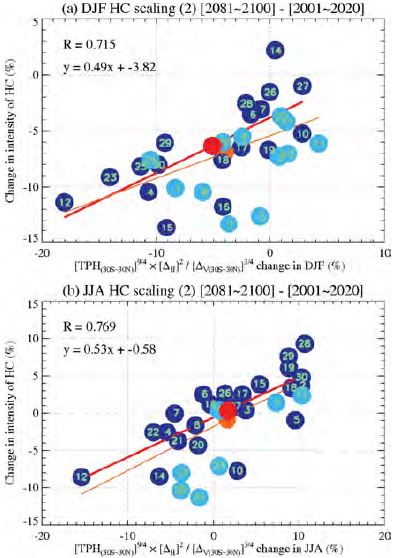
Changes in the HC strength (%) during (a) DJF and (b) JJA according to the second scaling relation. Sky blue dots are excluded in the calculation of the statistics. Red line shows a regression line for good models and orange line for all models.
Therefore, from our calculations that use only well-performing models to simulate the HC strength variation, we can more confidently conclude that the derived scaling relations predict the HC strength change fairly well. We also conclude that change in meridional temperature gradient across the subtropics in response to climate change plays a key role in changes to the ensemble-mean HC strength and its inter-model spread.
4. Summary
The Hadley circulation is the most important component of general circulation of the atmosphere over the globe. Here we examine the major processes controlling future changes in the Hadley cell (HC) strength from CMIP5 climate change simulations. The current study is an extension of a previous study by Seo et al. (2014) that used all 30 available models, but here we consider the model performance in simulating the HC strength variation on interannual time scales and select only well-performing models. We select the models that have greater internal sensitivity of the interannual HC strength variation to the latitudinal temperature gradient variation.
From the selection of good models and simple scaling analysis, we see that the inter-model variability in future HC strength change is mainly attributed to the intermodel spread in the meridional gradient in temperature across the subtropics for both DJF and JJA, not by the tropopause height or gross static stability changes. The HC strength is expected to weaken significantly during DJF, while little change is expected during JJA. The difference is because the reduction in the DJF meridional temperature gradient appears for most selected models, whereas the JJA gradient variations cluster around zero and cancel each other. However, poor models have larger inter-model diversity than good models in the future HC strength change (not shown). It can be conjectured by the increase of correlation and regression coefficient in good models selection from all 30 models.
The selected good model set increases statistically significantly the fidelity of the linear correlation between changes in HC strength and meridional temperature gradient by 13~23%, confirming the robust sensitivity of the HC strength change to the meridional temperature gradient change. During both DJF and JJA, the correlations between the prediction from the two scalings and the good model subset are all improved (and greater than 0.71). In particular, the prediction improvement in DJF is statistically significant and it increases by as high as 30%. However, these specific statistics can be changed by using other indices to determine the HC strength.
The scaling equations also work effectively for the estimation of the multi-model ensemble-mean change. Therefore, the two simple scaling relations successfully predict both the ensemble-mean changes and model-tomodel variations in the HC strength for both seasons.
Acknowledgements
This work was supported by a 2-Year Research Grant of Pusan National University. We acknowledge the World Climate Research Programme’s Working Group on Coupled Modeling, which is responsible for CMIP, and we thank the climate modeling groups for producing and making available their model output. The authors thank the two anonymous reviewers for their helpful comments.
References
-
Frierson, D. M. W., J. Lu, and G. Chen, (2007), Width of the Hadley cell in simple and comprehensive general circulation models, Geophys. Res. Lett., 34, -L18804.
[https://doi.org/10.1029/2007GL031115]

- Held, I. M., (2000), The general circulation of the atmosphere, Proc. Geophysical Fluid Dynamics Program, Woods Hole, MA, p1-70, [Available online at http://gfdl.noaa.gov/cms-filesystem-action/user_files/ih/lectures/woods_hole.pdf.].
-
______, and A. Y. Hou, (1980), Nonlinear axially symmetric circulations in a nearly inviscid atmosphere, J. Atmos. Sci., 37, p515-533.
[https://doi.org/10.1175/1520-0469(1980)037<0515:NASCIA>2.0.CO;2]

-
______, and B. J. Soden, (2006), Robust response of the hydrological cycle to global warming, J. Climate, 19, p5686-5699.
[https://doi.org/10.1175/JCLI3990.1]

-
Kang, S. M., and J. Lu, (2012), Expansion of the Hadley cell under global warming: winter versus summer, J. Climate, 25, p8387-8393.
[https://doi.org/10.1175/JCLI-D-12-00323.1]

-
Levine, X. J., and T. Schneider, (2011), Response of the Hadley circulation to climate change in an aquaplanet GCM to a simple representation of ocean heat transport, J. Atmos. Sci., 68, p769-783.
[https://doi.org/10.1175/2010JAS3553.1]

-
Lu, J., G. A. Vecchi, and T. Reichler, (2007), Expansion of the Hadley cell under global warming, Geophys. Res. Lett., 34, -L06805.
[https://doi.org/10.1029/2006GL028443]

-
Ma, J., and S.-P. Xie, (2013), Regional patterns of sea surface temperature change: a source of uncertainty in future projections of precipitation and atmospheric circulation, J. Climate, 26, p2482-2501.
[https://doi.org/10.1175/JCLI-D-12-00283.1]

-
______, ______, and Y. Kosaka, (2012), Mechanisms for tropical tropospheric circulation change in response to global warming, J. Climate, 25, p2979-2994.
[https://doi.org/10.1175/JCLI-D-11-00048.1]

-
Seo, K.-H., D. M. W. Frierson, and J.-H. Son, (2014), A mechanism for future changes in Hadley circulation strength in CMIP5 climate change simulations, Geophys. Res. Lett., 34, p5251-5258.
[https://doi.org/10.1002/2014GL060868]

-
Tanaka, H. L., N. Ishizaki, and A. Kitoh, (2004), Trend and interannual variability of Walker, monsoon and Hadley circulations defined by velocity potential in the upper troposphere., Tellus, 56, p250-269.
[https://doi.org/10.1111/j.1600-0870.2004.00049.x]

-
Vallis, G. K., (2006), Atmospheric and Oceanic Fluid Dynamics, Cambridge University Press, p745.
[https://doi.org/10.1017/CBO9780511790447]

