기상조절 실험용 드론의 설계·제작과 활용에 관한 연구
Abstract
Under the leadership of the National Institute of Meteorological Sciences (NIMS), the first domestic autonomous flight-type weather modification experimental drone for fog and lower-level cloud seeding was developed in 2021. This drone is designed based on a multi-copter configuration with a maximum takeoff weight of approximately 25 kg, enabling the installation of up to four burning flares for seeding materials and facilitating weather observations (temperature, pressure, humidity, and wind) as well as aerosol (PM10, PM2.5, and PM1.0) particle measurements. This research aims to introduce the construction of the drone and its recent applications over the past two years, providing insights into the experimental procedures, effectiveness verification, and improvement directions of the weather modification drone-based rain enhancement. In particular, partial confirmation of the experimental effects was obtained through the fog dissipation experiment on December 10, 2021, and the lower-level cloud seeding case study on October 5, 2022. To enhance the scope and rainfall amount of weather modification experiments using drones, various technological approaches, including adjustments to experimental altitude, seeding lines, seeding amount, and verification methods are necessary. Through this research, we aim to propose the development direction for weather modification drone technology, which will serve as foundational technology for practical application of domestic rain enhancement technology.
Keywords:
Weather modification experimental drone, Unmanned aerial vehicles, Cloud seeding technology, Fog dissipation1. 서론
인공강우란 과냉각 수적이 충분하게 존재하는 구름 또는 안개 속 내부에 구름씨앗(응결 또는 빙정핵)을 살포하여, 응결 또는 흡착 등의 과정에 의해 강수 또는 강설을 증가시키는 기술이다. 특히, 인공강우 기술의 효율성을 높이기 위해서는 응결, 침적 등 구름미세물리과정을 추정하는 기초기술이 지속적으로 연구되어져야 한다(Dolan et al., 2018; Cha et al., 2023). 이러한 기초연구 바탕으로 최근에는 산불, 가뭄, 도로안개 등 기상 재해 저감을 할 수 있는 기상조절기술에 대한 국민적 요구가 증가하고 있고(Lim et al., 2022), 최근 심각한 기후변화 현상(Wang et al., 2019)에 대한 기후공학적인 측면에서도 기상조절기술의 활용이 대두되고 있다. 미국, 중국, 러시아 등의 나라에서는 다양한 실험방법(기상항공기, 헬리콥터, 로켓, 드론 등)과 현업 운영을 통해 기상조절 기술을 축적해나가고 있는 반면에, 우리나라의 경우, 기상조절 기술분야가 기초연구 단계에 있어 현업화 또는 실용화 기술의 개발이 시급한 실정이다(Kim et al., 2020a, 2020b).
국내 기상조절을 위한 구름 씨 뿌리기(seeding, 시딩) 기술은 기상항공기, 지상연소기 등이 주로 활용되어 왔다(Cha et al., 2019). 최근 시딩 고도의 제한과 실험 접근성을 해소하기 위해 무인기(드론), 로켓 분야 기술을 활용하는 등 그 실험 방법이 다양해지고있다. 특히, 미국, 중국, 러시아 등 인공강우 주요국에서도 드론 기술을 하층운 대상 인공강우 및 안개저감실험 등에 주로 활용하고 있다. 이들 국가는 멀티콥터형의 비행 날개를 가진 회전익형 드론 뿐 아니라, 최신 수직이착륙기(vertical take-off and landing) 기술을 기상조절 실험에도 활용하는 추세다(Gil et al., 2020).
항공기와 비교하여 드론 기술을 활용한 기상조절 실험을 수행할 경우 장점 및 단점은 아래와 같다.
- 1) 장점
- • 무인기 드론을 이용할 경우 목표 구름에 시딩 물질을 살포하기 위한 비용이 기상항공기가 보다 상대적으로 많이 절약할 수 있다. 드론에 비해 항공기는 기본적인 경비인 유류비와 정비 및 유지관리 비용 등이 많이 필요하다.
- • 민간사업체에서 드론을 이용한 기상조절 실험을 할 경우 실험의 용의성이 높고, 드론은 접근성이 항공기보다 훨씬 좋아 누구나 간단한 자격증만 있으면 드론을 활용한 실험이 가능한 기상조절 플랫폼으로 활용할 수 있다.
- • 원하는 소규모 지역에 그 지역에 특화된 구름을 대상으로 지속적으로 기상조절 실험이 가능하다.
- • 기상조절용 드론 자체의 가격은 항공기와 비교가 되지 않을 정도로 저렴하며, 향후 드론의 군집 비행 등 많은 수의 드론을 동시 운영 할 수 있는 경우 보다 넓은 지역을 대상으로 항공기보다 저렴한 비용으로 기상조절 실험을 수행할 수 있다.
- 2) 단점
- • 항공기에 비해 대량의 기상조절용 구름씨 물질을 살포할 수 없고 지상에서 1 km 이상의 높은 구름을 대상으로 할 경우 항공기처럼 비행 공역 허가를 받아야 한다.
- • 드론 비행 중 시계가 확보되지 않을 경우 비행에 어려움이 있고, 항공기와 달리 비행 중 착빙이 발생할 경우 추락의 위험성이 있다.
- • 1대의 드론을 활용할 경우 넓은 범위를 대상으로 기상조절 실험을 수행하기 어렵고 기상 상황의 악화 시 항공기보다 기상조절 실험에 제약을 받는다.
위 사항들을 종합적으로 볼 때, 최근 전세계적으로 드론의 하드웨어 및 소프트웨어 기술의 급격한 발전으로 적절한 기상환경에서의 운영 조건과 여러 기 이상의 드론을 체계적으로 활용한다면 드론 기술은 저비용 고효율의 기상조절 플랫폼으로 활용될 가능성이 크다.
또한 드론 기반 시딩기술이 가능하기 위해서는 탑재 가능 중량이 매우 중요하며, 이에 대한 상세 설계와 제작이 뒷받침되어야 안정적인 구름씨 뿌리기 실험과 연직고도별 대기상태 관측에 활용할 수 있다. 우리나라의 경우 국립기상과학원에서 드론 기술을 이용한 기상조절 실험기술 개발 연구가 시도되고 있다(NIMS, 2020; NIMS, 2021; Jung et al., 2022). 2019년 항공우주연구원과 공동 연구로 추진한 유무인기 활용 기반 인공강우 실험(Jung et al., 2022) 연구를 시작으로 2020년부터 드론을 활용한 안개저감 및 강우증가에 관한 시딩기술 적용 가능성을 연구 중에 있다. 드론의 접근성을 고려하여 항공기의 접근이 어려운 1 km 고도 이하에서 지면에서 가까운 고도 범위에서 안개 또는 하층운이 주요 목표 구름이 된다. 주요 실험지역은 서해안에 위치한 경기도 화성지역과 강원도 태백산에 위치한 대관령 지역이다. 화성지역은 연간해무 또는 안개 일수가 40일 이상으로 해무에 의한 도로 안개 등 재해 위험도가 높은 지역이다(Cho, 2003; Heo and Ha, 2004; Kim et al., 2013). 또한 강원도 대관령 지역은 겨울-봄철 산불위험도가 높은 지역으로 산악에 의한 지형효과 등을 활용하여 기상조절 실험을 수행하기에 적합한 지역으로 활용되고 있다(Yang and Oh, 2005). 안개저감 및 하층운 대상 강우 증가실험은 중‧단기 예측자료를 기반으로 사전 모니터링이 이루어지며, 연간 10회 내외의 드론 기반 기상조절 실험이 이루어지고 있다. 그러나 아직까지 소규모 영역에 대해 연구목적으로 활용되고 있으므로 좀 더 넓은 범위와 시딩량의 변화를 고려한 다양한 연구와 기술 개발이 필요하다.
본 연구는 국립기상과학원에서 추진하는 기상조절용 실험 드론 개발과 운영방법, 그리고 그 활용 사례를 제시함으로써 향후 무인기 기반의 안개 저감 및 하층운 대상 기상조절 실험 기술에 대한 개선과 활용가능성을 제시하고자 한다.
2. 연구 방법
2.1 기상조절용 드론 설계·제작
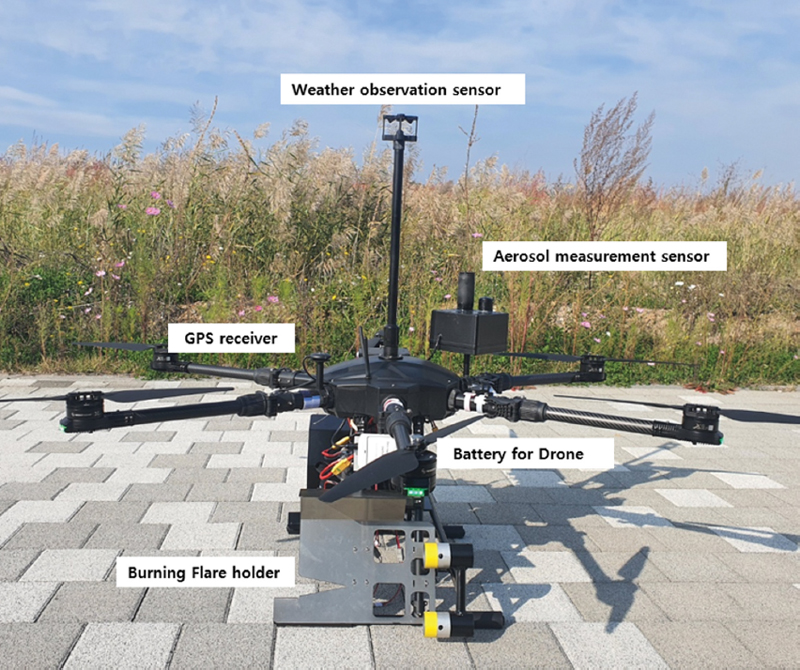
본 연구 실험에 사용된 드론은 1 km 고도 내외의 제한된 범위에서 비행이 가능하도록 자동비행 조종시스템 기반으로 개발되었으며, 비행 시 안정성을 고려하여 6개의 프로펠러를 가진 헥사 드론으로 구성되었다(Fig. 1). Table 1은 본 기체의 세부사양을 나타낸 것으로 자체 중량 15.6 kg(최대 이륙중량 24.25 kg)인 기체의 최고 운항속도는 50 km h-1, 최대 상승·하강속도 4~6 m s-1이며, 운영 반경은 약 10 km, 원격 조정거리는 3 km에 이른다. Figure 1은 개발이 완료된 기상조절용 실험 드론의 실제 모습이다. 이 연구에서 개발된 기상조절용 드론의 특징 중 하나가 자동비행 프로그램에 의해 드론을 운영할 수 있다는 것이다. 수동 조정기로도 가능하지만 드론 조종기와 자동비행 프로그램이 설치된 노트북 간 이동식 저장장치 케이블 연결을 통해 네트워크가 연결되고, 드론 비행경로 설정 후 비행 명령을 실행하면 조종기로 신호가 전달된다. 이 신호가 드론 본체의 비행 컨트롤러에 신호를 전달하여 드론이 자동으로 이륙 후 설정된 경로를 순서대로 비행하고 착륙지점으로 정확히 착륙하게 된다. 또한 이 기체는 기상조절을 목적으로 개발된 드론이므로 무인 시딩을 위한 랜딩스키드 고정용 연소탄 거치대가 추가적으로 장착되었으며(Fig. 1), 연소탄 거치대는 좌우 2발씩 최대 4발까지 연소탄 장착이 가능하고, 연소탄은 원격점화장치를 이용하여 원격으로 점화된다. 이러한 연소탄은 기상항공기에 사용한 연소탄을 기상조절용 드론에 그대로 사용할 수 있기에 드론용 연소탄을 다시 제조할 필요가 없어 경제적으로 추가적인 경비가 필요치 않다.

Specification of the weather modification drone using by the National Institute of Meteorological Sciences (NIMS).
기상조절용 드론의 원격점화장치는 Fig. 2a처럼 송신기와 수신기로 구성되고, 수신기는 드론의 본체 내부에 탑재되어 있으며, 송신기는 지상에서 실험운영자가 소지한다. 이런 원격점화장치는 기상조절용 드론을 위해 자체 제작한 장비이다. Figure 2a의 그림 내 1~4번호는 기상조절용 드론의 연소탄 4개를 개별로 점화할 수 있는 버튼이다. Figure 2b는 원격점화장치 송·수신기의 통신 회로도이고, 이 송·수신기는 447 Mhz 대역 주파수의 독립 4채널을 이용하여 무선 통신한다. 각 채널을 통해 그림과 같이 번호 별로 송·수신기가 연결되어 송신기의 번호를 누르면 연결된 해당 번호의 수신기와 연결된 연소탄이 점화되고, 여러번호를 동시에 누를 경우 여러 발이 동시에 점화되므로 실험운영자가 시딩량을 조절할 수 있다.
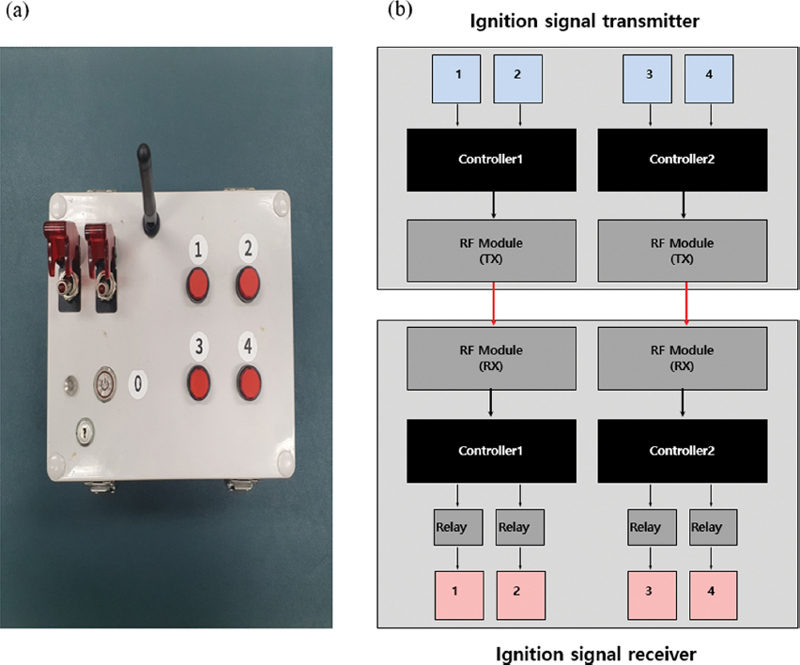
(a) A picture of the remote ignition transmitter and (b) a communication circuit diagram of the remote ignition device for weather modification experiment.
또한, 기상조절 실험과 기상 및 에어로졸 관측을 동시에 수행할 수 있도록 하기 위해 드론 전용 초경량 기상센서(무게: 50 g, 모델명: TriSonica mini Wind and Weather Sensor, 제작사: Anemoment, 제조국: 미국),에어로졸센서(무게: 280 g, PM1.0, PM2.5, PM10, 모델명: AQM 0615D, 제작사: (주)PINE, 제조국: 대한민국),자료수집기의 탑재형으로 설계하였다. Table 2와 Table 3은 이러한 기상관측 센서와 에어로졸관측센서에 대한 구체적인 규격을 나타낸 것이다. 드론에 탑재된 기상관측 센서는 드론 본체 중앙에 위치, 에어로졸 센서는 본체 옆 부분에 각각 설치하였으며, 프로펠러에 의한 기류의 영향을 최소화시켰다(Weber et al., 2017; Hedworth et al., 2021). 대기 관측센서 및 데이터 수집기는 방수 케이스로 구성되었으며 리튬전지(3.7 V, 6000 mA)가 장착되어 데이터 수집기 및 관측 센서에도 전원 공급이 가능하다. 또한 기온변화에 민감한 리튬전지의 항온 유지와 전지 전압 모니터링을 통해 드론의 장시간 비행이 가능하도록 고려하였다. 본 기체의 설계와 제작에 활용한 모든 부품은 한국안전기술원의 성능검사 시험을 통하여 검증 완료되었으며, 드론의 자동 비행과 운영에 관한 프로그램은 펌웨어형 소프트웨어를 활용하여 연구의 목적에 맞게 수정되었다.

Specification of the weather sensor in the weather modification drone using by National Institute of Meteorological Sciences (NIMS).
2.2 기상조절용 드론을 이용한 실험 절차 및 운영
드론을 이용한 기상조절 실험 절차는 항공기를 이용한 실험절차와 유사하다. 왜냐하면 목표로 하는 구름의 특성에 따라 시딩 물질을 동일하게 사용하기 때문이다. Figure 3은 이러한 드론을 이용한 기상조절 실험은 국립기상과학원에서 보유중인 다양한 기술 중 하나로써 역할을 하는 보여주는 그림이다. 즉, 이 그림은 국립기상과학원에서 다양한 방법으로 기상조절 실험을 위한 실험절차가 있음을 보여주고 있다. 1차적으로 구름이 연속적으로 발생하면서 온도와 노점온도 차(습수온도)가 4oC 이하이고 상승속도가 존재하는 지역에 실험허가가 있어야 한다. 이런 실험허가 조건하에서 구름 생성이 2시간 이하이면 단독 실험을 체계를 가져가고, 2시간 이상일 경우 연계 실험 체계를 가져간다. 특히 드론을 채택할 경우 운량이 9/10이상, 구름두께가 약 1 km 이상 목표지역 상승속도가 1 cm s-1 이상, 운저고도가 1 km 이하일 경우 실험을 수행하는 것을 목표로 한다.
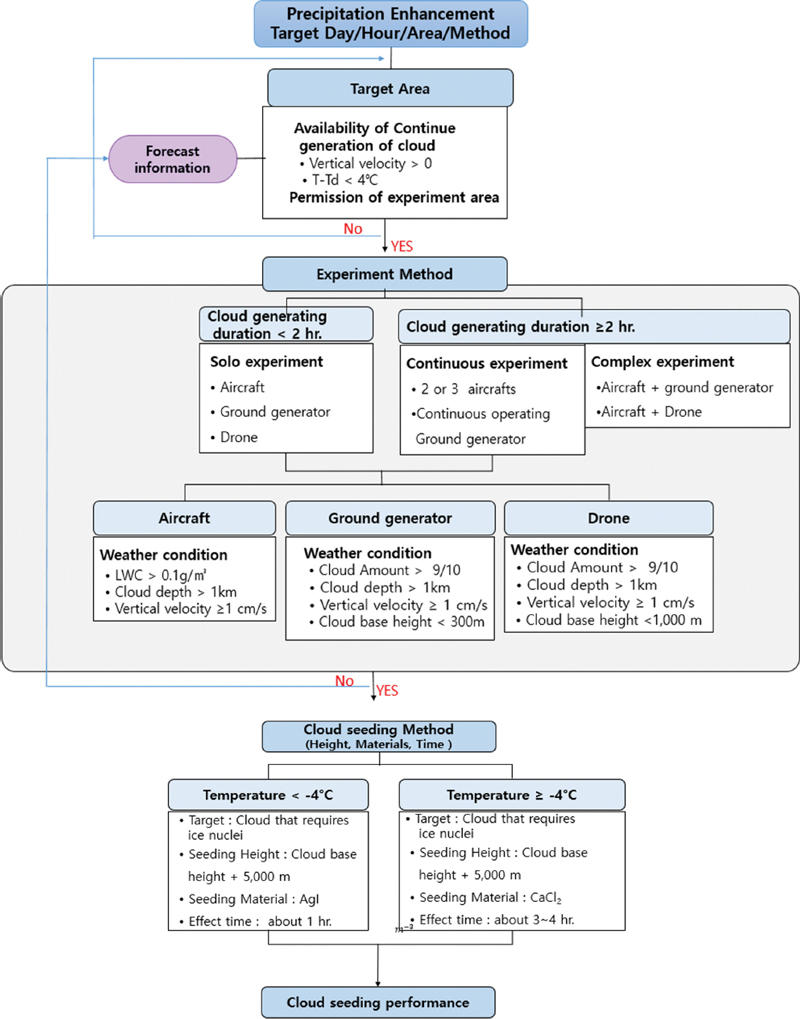
Flowchart of the experimental process for precipitation enhancement using various cloud seeding methods.
본 연구 실험에 사용된 드론 운영을 현장에서 적용하는 구체적인 절차는 Fig. 4와 같다. 이 그림에서 보는 바와 같이 기상조절용 드론 실험을 위해서는 상황반(operating team)과 실험반(in-situ team)으로 수행되고 상황반은 실험 시작 전 기상정보를 이용하여 실험지역, 실험고도, 실험범위 등을 검토하여 실험반에게 전달한다. 실험반은 이를 기반으로 현장에서 드론 운영 및 실험수행, 관련기관에 실험현황 보고 등이 이루어진다. 그리고 기상조절용 드론 실험을 하기 위해서는 주변 환경(인명 및 위험상황 등)에 대한 안전성이 확보되었는지 실험반이 실험 전 상황반에 보고한 후 상황반과 협의하여 실험을 수행한다.
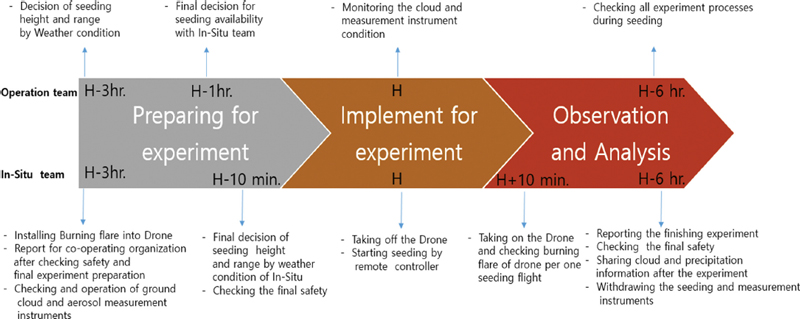
Processes and activities of an operation and in-situ team for a weather modification drone experiment.
실험을 시작할 경우 사전 예측에 의해 결정된 실험내용을 Fig. 5와 같이 기상조절용 드론이 절차에 따라 현장에서 드론 운영자가 드론 실험 수행하게 된다. Figure 5a는 인공강우 실험을 위해 드론에 연소탄을 장착한 모습을 보여주고 있다. 연소탄을 정착한 드론은 Fig. 5b와 같은 지정된 자동비행 경로구간을 설정한 후에 Fig. 5c와 같이 그 자동비행 구간을 비행하는 모습이고, 실험하고자 하는 고도에 드론이 도착하게 되면 Fig. 5d처럼 원격 점화장치에서 1~4번의 버튼을 눌러 연소탄 점화를 할 수 있다. Figure 5e는 원격 점화장치에서 연소탄 점화 버튼을 누른 후에 기상조절용 드론에서 연소탄이 점화되어 인공강우용 구름씨 물질이 살포되는 장면이다.
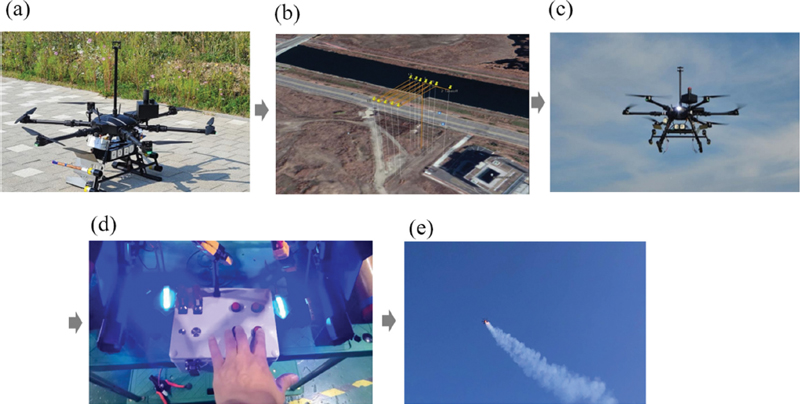
Operational stages of the weather modification drone. Explanation for (a)-(e): (a) payload installation and takeoff preparations, (b) automatic flight and seeding path setting, (c) takeoff and pre-seeding observation, (d) remote initiation of seeding materials, (e) seeding experiment and post-seeding observation.
이런 Fig. 5의 드론 실험 절차를 요약하면, 사전 예측에 의해 실험 내용이 결정되면 연소탄 탑재 및 이륙 준비를 완료한다. 자동비행경로 구간과 호버링 관측고도, 시딩 고도 등을 결정하여 프로그램에 반영하여 설정한다. 그리고 드론 이륙 및 특정 고도에 대한 대기 상태 관측을 실시하게 되며, 시딩 고도에 도달 후 원격 격발 장치를 이용하여 시딩 물질을 살포한다. 시딩 물질의 살포는 주풍향과 직각으로 교차 시딩을 수행한다. 시딩 실험이 완료되면 시딩 후 효과 예상지점에서의 대기 상태를 최종 관측하여 이착륙 지점으로 돌아오는 과정을 거치게 된다.
이 때 상황반에서는 수치모델정보(시정정보, 운량정보), 위성정보(운량의 공간적 분포), 레이더반사도 등을 이용하여 안개 지속시간 또는 강수구름 활성도를 판단하여 실험반에 관련 정보를 제공하고, 실험반에서는 이를 고려하여 시딩 물질의 양을 증감하여 운영한다. 개발된 회전익형 드론용 리튬 전지의 운항가능시간이 평균적으로 약 30분 정도임을 고려하여, 보조전지를 활용한 시딩 및 관측비행을 반복하여 수행한다. 이때 기상조절용 연소탄은 실험반에서 원격으로 점화하여 목표로 하는 구름에 정확히 시딩을 할 수 있게 한다. 상황반은 목표지역 구름과 강수 시스템의 변화를 모니터링 하다가 예상했던 기상예보와 다른 기상상황이 발생할 가능성이 있으면 실험반에 즉각 전달한다. 실험반은 드론의 매 1회 비행 후 착륙시켜 드론 본체 점검과 연소탄의 정상적인 발화 여부 등을 드론 실험 비행 후 실시하여 실험의 안전성을 확보한다.
실험 후 상황반은 전체적인 실험에 대한 진행상황을 체크하여 실험 후 6시간 이내 특이사항 등을 정리한다. 실험반은 실험 후 실험종결에 대한 최종보고를 상황반에 6시간 이내 수행한다. 그리고 실험에 사용된 장비 및 구름/에어로졸 관측장비 등을 점검하고 현장에서 철수한다.
이와 같이 기상조절 실험을 위한 드론 운영은 기본적으로 항공기를 이용한 기상조절 실험 절차와 유사하다. 그러나 구체적인 시행방법에서는 항공기 운영보다 편이성이나 경제성이 월등히 뛰어나다. 예를 들어 편의성을 보았을 때 항공기를 이용할 경우 조종사 2명, 정비사 3명, 항공기 관측 장비 관련 2명 등 많은 인력이 필요하고, 항상 항공기 공역 허가 조율 등 많은 시간이 필요하는 등 많은 일정과 인력을 조율해야 실험이 가능하지만, 드론을 이용할 경우 목표지역들에 대한 사전 허가 신청을 매월 하면 1 km 이하의 고도에서 언제든 가능 하며, 그 이상의 고도일 경우는 실험 전 허가를 받으면 된다. 인력 측면에서도 개발된 기상조절용 드론은 자동비행이 가능하기에 드론운영 인력 1~2명과 실험수행 인력 1~2명만 있으면 언제든 기상조절 실험이 가능하다. 경제성을 보았을 때 예를 들어 시딩 물질이 있는 연소탄을 구름 내 시딩을 할 경우 기상조절용 드론 경우 충전한 건전지를 이용하기에 드론 비행을 위한 유류비가 거의 들지 않지만, 항공기인 경우 비행거리에 따라 달라지지만 유류비만 대략 수백만 원이 필요하다. 즉 항공기처럼 넓은 지역을 목표로 하지 않고 소규모의 특정지역만을 목표할 경우 기상조절용 드론 실험의 경제성은 월등히 뛰어나다.
3. 연구 결과
3.1 기상조절용 드론 실험 설계 및 효과검증 방법
이 연구에서는 무인기 기반 드론 기술을 기상조절 실험에 적용하기 위해 Fig. 6과 같이 실험 설계 방안을 고려하여, 안개 및 지상부근 하층운 구름을 대상으로 기상조절 실험 및 검증관측 방안을 제시하고자 하였다. 드론을 활용한 실험은 1 km 고도 이내의 제한된 범위에서 이착륙이 유리하고 자동비행과 원격 점화가 가능한 회전익형 드론 운영 시스템을 고안하였으며, 풍상측 바람 및 공기의 이동과 확산속도, 기온, 수액량 정보 등을 고려하여 시딩 물질 종류와 시딩 지점, 시딩 고도, 시딩 경로 등을 결정할 수 있다. 이 연구에서 고안한 드론 비행체는 자동비행 경로 설정을 통해 비행 및 원격 점화가 가능하며, 관측센서 및 에어로졸 센서탑재를 통해 연직 대기상태 관측이 동시에 가능하다. 또한 실험 전 풍상측 고도별 대기상태 관측, 시딩 물질 연소, 시딩 후 시딩 물질의 확산 및 반응시간을 고려한 대기 상태 관측 방안을 제시하고자 하였다. 서해상 등 해무가 발달하는 지역의 경우 Figs. 6a, c와 같이 기상조절 실험과 관측에 관해 설계할 수 있다. 해무 예측 시 실시간 기상정보와 수치모델링에 의한 구름 수액량, 기류흐름 조건에 기반하여 안개소산 가능 영향지역을 설정하고, 실험조건이 만족되면 지표 및 연직에서 대기상태 관측과 시딩 물질을 살포한다. 이후 반응시간을 고려하여 영향지점의 증우량 또는 시정 개선도를 확인하는 과정을 거친다. Figures 6b, d는 산악 지형에서 지형효과에 의해 상승류의 유도로 지표 부근 하층운이 발달하는 경우에 대한 실험 및 관측 설계 방안을 보여준다. 산악 방향으로 유입되는 기류에 의해 산악지역 전면에서 단열팽창 냉각과정 및 상승기류 유도 효과에 의해 하층운 구름이 발달하는 경우 드론을 활용한 실험을 수행한다. 안개실험 관측과 마찬가지로 시딩 지점과 주요 영향 예상지점에서 지면 및 연직 대기 특성을 관측 및 수치 모의하여 그 변화 및 실험 효과를 확인한다.
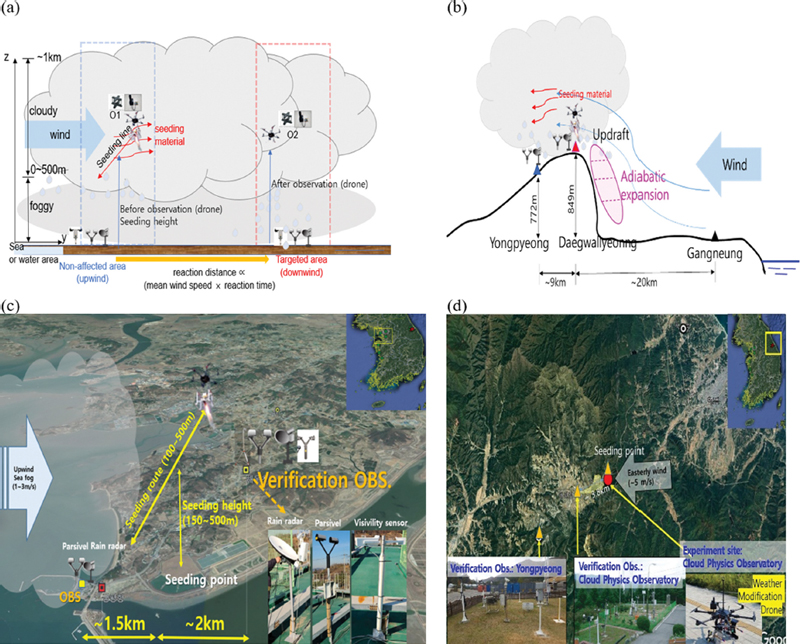
Layout of observational instrument in the conditions of a fog case [(a) the weather modification experimental conception and (c) the in-situ experimental method at Gungpyeong harbor in Gyeonggi province for the fog case] and a low-level cloud case [(b) the weather modification experimental conception and (d) the in-situ experimental method at Daegwallyeong in Gangwon province for the low-level cloud case] based-on the weather modification drone system; “OBS.” in (c) and “obs.” in (d) mean the observation for the experimental verification.
안개저감 및 하층운 대상 기상조절 효과 검증의 일반적인 방법은 안개인 경우 시정 개선과 하층운인 경우 인공증우(설)량으로 한다. 예를 들어 안개 내 시딩 물질을 살포할 경우 안개입자가 강수입자로 성장하면서 시딩 지역에 시정개선이 발생하여 안개저감효과를 발생한다. 하층운에 대해서는 기상조절을 위한 시딩 물질은 살포하여 이 시딩 물질의 영향에 의해 발생하는 인공증우(설)량으로 실험효과를 검증한다. 이러한 기상조절용 드론 실험의 효과 검증을 위해 국립기상과학원에서는 주로 구름물리 관측과 수치모델링 기법을 활용한다.
이 연구에서 기본적인 기상조절용 드론 실험의 효과를 확인하는 첫 번째 방법은 현장에서 시딩 물질을 살포 후 강수를 관측하여 실험의 효과를 확인할 수 있다. 둘째로는 수치모델의 시딩 물질 확산장 내에서 강수가 관측이 되고 시딩 물질이 살포되지 않은 경우와 살포한 경우를 비교하여 차이가 발생하면 실험 효과를 확인하는 방법이 있다. 국립기상과학원에서는 기상조절용 드론 실험 후 이러한 직접적인 현장에서 확인과 수치모델의 실험 효과 확인이 동시에 발생한 경우만을 실험 효과가 있었다고 간주한다. 특히 현장 관측을 통한 실험 효과 확인은 드론에 탑재된 기상관측 장비와 지상의 풍상측과 주요 효과 예상지점인 풍하측에 설치한 구름물리 관측을 활용하는 방안이 있다. 이 연구에 사용된 드론 탑재형 주요 관측장비는 기온, 습도, 풍향, 풍속 관측이 가능한 기상센서(초음파 풍향/풍속 및 기상센서)와 에어로졸(PM10, PM2.5, PM1.0)센서를 활용하는 방법이 있다. 수치모델링을 통한 효과 확인은 실험 전‧후 시딩 물질의 확산 및 영향 가능 지역을 예측하고, 이에 따른 수치모의 전‧후 강우량 차이를 계산하여 증우영역의 변화도 추정 및 실제 관측 값과 비교 평가하는 과정을 거쳐 이루어진다.
실험에 사용된 인공강우용 수치모델은 Weather Research and Forecasting Model v4.3 (WRF v4.3)을 기반으로 하며, 미세구름물리과정 내 인공강우 실험물질의 작용과정을 모수화하였다(Chae et al., 2018). 실험물질은 기온 조건에 따라 선정될 수 있다. 찬 구름(구름온도 -4oC 이하 시) 상태 시 빙정핵으로 작용하는 요오드화 은(AgI)이 주로 사용되며, 따뜻한 구름(구름온도 -4oC 초과 시) 상태 시 응결핵으로 작용하는 흡습성의 염화칼슘(CaCl2) 또는 염화나트륨(NaCl)이 주로 사용된다. Table 4에서 수치모의를 통한 주요 실험 사례의 상세 내용을 제시하였다. 예를 들어 기상조절용 드론 실험 후 시딩 물질의 농도변화 및 효과 검증은 수치모델상으로 시딩 물질의 확산에 의한 농도분석을 하고, 시딩 물질의 확산 지역에 대한 인공증우 효과를 분석하게 된다. 이 때 기상조절용 드론 실험의 영향 가능 지역 또는 목표지역에 시정계에 의한 시정 관측, 강우량계에 의한 강우 관측, 광학우적계에 의한 강우의 입경별 수농도 관측 등의 관측이 이루어져 인공강우 실험 효과를 검증하게 된다.
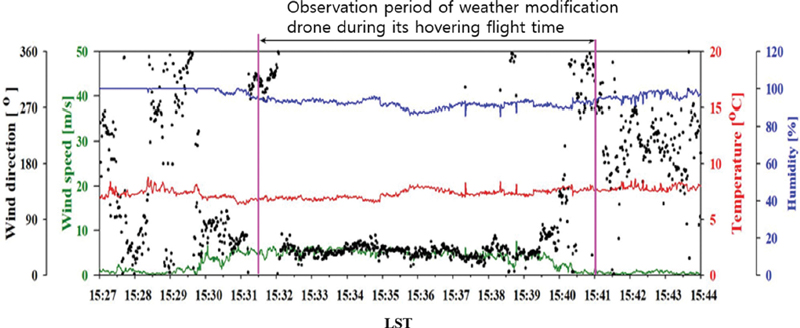
또한 드론 관측의 신뢰도를 향상시키기 위한 방안으로 고도별 호버링을 통해 기상자료가 관측 및 수집되며, 자료수집장치에 저장된다(Fig. 7). Figure 7에서는 호버링 기간 동안 고도 50 m에서 관측된 기상정보인 풍향, 풍속, 기온, 습도의 관측한 예를 보여주고있다. 특히 풍향은 호버링 전에는 풍향의 변화가 매우 심하게 나타나지만 호버링 기간 동안에는 풍향이 일정하게 유지됨을 알 수 있었다. 다른 기상요소인 기온, 습도, 풍속 등도 드론의 호버링 기간 동안에는 큰 변화가 없음을 확인하였다. Figure 7에서 보는 바와 같이 기본적으로 드론에 의한 기상요소 관측은 항공기관측에 비해 저고도(약 1 km 이하)에서 지속적으로 관측 할 수 있고, 저비용으로 할 수 있는 장점이 있다. 하지만 드론에 의한 기상관측 시 풍향 풍속 등이 드론의 움직임에 의해 실제 값을 관측할 수 없는 경우가 많이 발생한다. 그래서 이번 연구에서는 드론을 이용한 인공강우 실험 후 일정 기간에 일정 고도에서 호버링을 통해 이러한 기상관측의 오류를 수정하고자하였다. 향후 이런 드론의 호버링 관측에 의한 기상관측요소의 정확도 향상에 대한 연구는 지속적으로 이루어질 예정이다.
3.2 안개저감 및 인공증설(우) 기상조절용 드론 활용 실험 최근 3년 결과
2020년부터 추진되고 있는 안개 및 하층운 대상의 드론 활용 지상 실험은 강원지역과 서해안 일부 지역을 대상으로 2020~2022년 기간 동안 총 24차례 수행 및 시도되었다. 본 연구에서 개발된 기상조절용 실험드론은 최초 개발 연도인 2021년부터 약 15회 지상실험에 활용되었다. Table 5는 2021~2022년 기간 동안 관측 및 수치모의 등을 통해 실험 효과가 확인된 대표사례(6개 사례)를 보여준다. 제시된 사례는 하층운을 대상으로 한 실험 사례로서 2021년 1개 사례, 2022년 5개 사례의 실험 결과이다. 이런 효과 확인에 방법에 대해서는 3.1.2절에서 선택한 지상관측자료와 수치모델상의 실험효과 확인 방법을 걸쳐서 검증된 결과이다. 이 경우 드론 활용 관측실험 당시, 기상조건, 시딩 물질, 예상 효과지역, 증우량 등은 드론 및 지상관측과 수치모의를 통해 종합적으로 비교되었다. 특히, 2022년 10월 5일 오후 시간대(14:48~16:40 LST)강원도 대관령 지역을 대상으로 한 동풍형 하층운 사례 실험(염화칼슘 연소탄 활용)에서는 지상강수 및 수치 모의를 고려한 최대 증우량 추정값이 약 3.43 mm에 이른다. 이 논문에서 최대 증우량 추정값은 현장 강수 입자크기의 증가, 레이더 반사도 증가, 지상 강수 관측 분석을 통해 객관적으로 설명하고자 하였으며, 각 요소별로 실험 전‧후 변화에 대한 유의미한 결과를 보여주었다. 이 논문에서는 Table 5에서 제시한 결과 중 실험효과[증우(설)량 확인, 시정개선 등]가 뚜렷한 두 실험사례에 대하여 다음 절에서 상세하게 기술하고자 한다.
3.3 기상조절용 드론을 이용한 경기도 화성시 사례 연구(2021년 12월 10일)
안개 및 해무 저감을 위해 경기도 서해안 화성지역 하층운을 대상으로 2021년 12월 10일 약 26분간(12:16~12:41 LST) 드론 실험을 수행하였다. Figure 8a는 실험 직전(2021. 12. 10. 12:00 LST) 종관 일기(기상청 지표면 일기도)이고, Fig. 8b는 위성영상(천리안 합성영상 자료)이며, 우리나라는 기압골의 영향으로 서해안 지역과 경기북부 지역에 안개 및 하층운이 발생한 모습을 확인할 수 있다. 당시 궁평항 인근 자동기상관측소(Automatic Weather Station, AWS) 중 전곡항의 기상 상태는 지상 10 m 고도에서 풍속 2.9 m s-1의 남남동풍, 지상 2 m 고도에서 기온 9.1oC, 층적운, 운고 700 m, 상대습도 96%를 나타내었다(Table 5). 안개발생 예측 수치자료에 기반하여 사전 실험 계획이 수립되었으나, 당일 기상상태 변화에 따른 실험 지점의 안개 미발생으로 인하여 하층운을 대상으로 실험이 진행되었다. 드론 시딩 경로는 시딩 고도에서 남서풍 계열의 바람과 수직한 방향의 직선 교차 시딩 방식으로 설계되었다. 시딩 물질 연소탄은 2발씩 총 4발(0oC 이상 조건 시 흡습성 물질 연소탄 사용)이 탑재되었으며, 2발씩 연속으로 점화되었다. 실험 당시 1회당 시딩 고도는 약 300 m, 비행속도는 5.0 m s-1, 총 시딩거리는 200 m 간격의 7개 수평 구간에서 이루어졌으며, 각 연소탄의 연소시간은 약 4분 20초를 기록하였다. 이 때 기상조절용 실험 드론은 실험 임무 자동비행 설정 프로그램에 따라 안정적 이착륙과 비행 업무를 수행할 수 있도록 운영되었다.
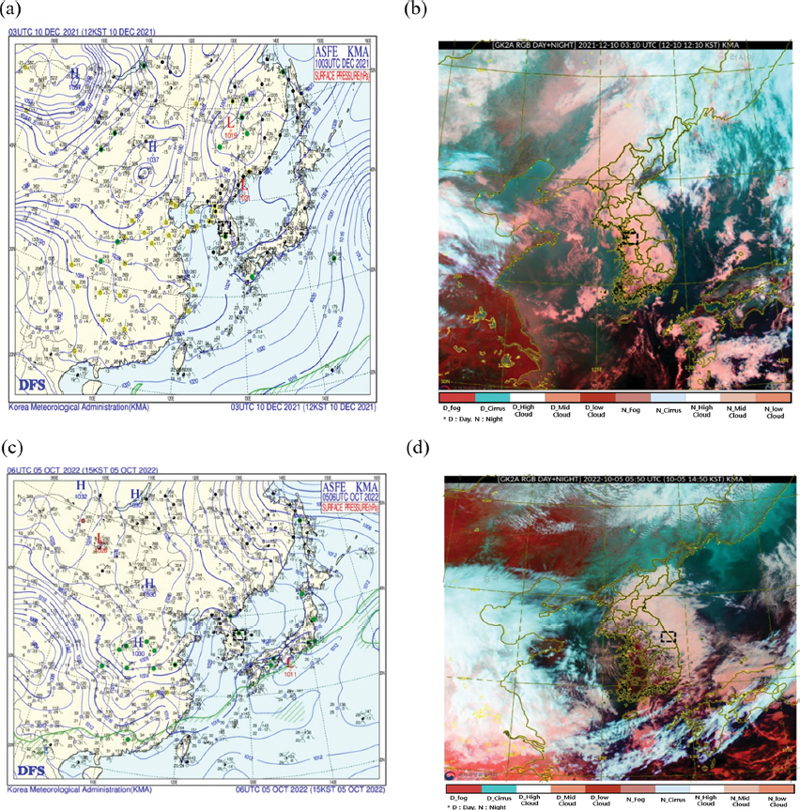
Synoptic weather charts [(a) 2021.12.10. 12:00 LST and (c) 2022.10.5. 15:00 LST] and satellite images [(b) 2021.12.10. 12:00 LST and (d) 2022.10.5. 15:00 LST] of the two experimental cases. Black dashed rectangles show each experimental region; Color indexes in bottom of (b) and (d) mean cloud classes.
또한 안개저감 효과에 대한 기상조절 실험 효과에 대한 실험에서 하층운 유입 시 목표 지역의 실험 전·후 시정의 변화를 관측하였다. Figure 9는 실험지역에서 북동쪽 방향으로 약 3 km 거리에 위치한 해운초등학교 옥상에서 관측된 시딩 실험 전-중-후 단계별 1분 평균 시정자료의 변화를 나타낸다. 하층운을 대상으로 한 실험이어서 안개 발생 시 시정 값 보다는 높은 시정 값이 관측되었다. 하지만 전반적으로 하층운이 유입되면서 약간의 시정감소가 있었지만 드론실험 후 약 18%의 시정 개선율(실험 전 평균 7,556 m → 실험 후 평균 8,927 m)을 확인할 수 있다.
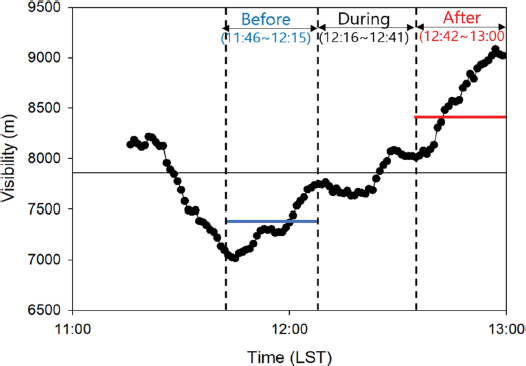
Variations in 1-minute averaged visibility at Gungpyeong harbor in Gyeonggi province during the period of 11:00~13:00 LST on December 10, 2021.
Figure 10은 2021년 12월 10일 12:00~17:00 LST 기간 동안 1시간 간격으로 연직 누적한 시딩 물질의 확산분포, AWS 강수분포를 보여준다. 시딩 물질은 경기 남부내륙으로 점차 확산하여 충청 북부지역까지도 확산되는 경향을 보였다. AWS에서 관측된 강수는 주로 경기 북부지역과 충남 내륙지역에서 0.1~1.0 mm 미만의 분포를 나타내었다. 시딩 후 1시간 후인 13:00~14:00 LST에 시딩 물질이 확산된 영역 내 일부 관측(경기도 의왕 오전동 AWS, 0.5 mm)되어, 일부 시딩 효과 가능성을 확인할 수 있다.
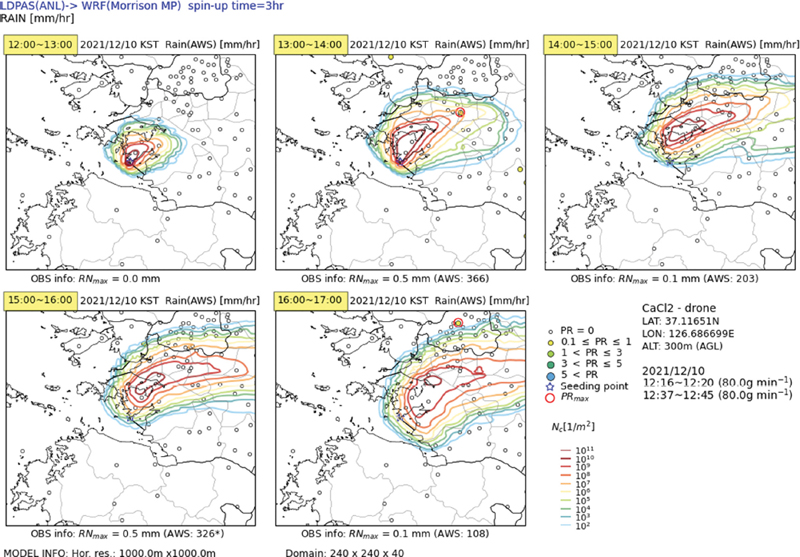
Hourly changes in number concentration (m–2) of vertically integrated CaCl2 in SEED numerical simulations (color dashed lines), accumulated precipitation observed AWS sites (color-filled circles) from 12:00~17:00 LST on December 10, 2021 [OBS: Observation, RN max: Maximum rain amount (mm) of AWS in numerical dispersion model domain and PR: Precipitation amount (mm) in AWS. Nc: Number concentration of CaCl2 particles (m-2)].
Figure 11은 시딩 물질 주요 효과 시간대로 정의한 5시간(12:00~17:00 LST) 동안의 시딩-비시딩 수치모의에 의해 연직으로 적분된 누적 확산장, 추정 인공증우량, 그리고 AWS 누적 관측값을 나타낸다. 전체 시딩 물질의 누적확산장은 서풍계열의 바람에 의해 경기남부에서 충북, 그리고 강원 일부 지역까지도 확산된 분포를 보여준다. 이때 확산 범위 내에서 관측된 강수량의 최댓값은 풍하 지역인 강원도 원주시 신림면 AWS (2939) 지점에서 약 2.0 mm를 기록되었다. 이 그림에서 수치모의상 빨간색 계열의 색칠된 곳은 증우된 지역이고, 파란색 계열의 색칠된 곳이 감우된 지역을 나타낸다. 이 수치모델 도메인 내에서 증우된 지역은 약 217.0 km2이고 감우된 지역은 918.0 km2으로 나타났다. 그리고 총면적 대비 증우량에서 감우량을 뺀 최종 증우량은 1856.28톤(t)으로 수치모의 되었다. 이번 인공강우실험 사례에서 평균적인 실험효과 효율을 계산 한기 위한 인공강우 증우율[P (%) = 1 - (시딩 증우량(SEED) - 비시딩강우량(NOSEED)/시딩 증우량(SEED) × 100)]을 계산하였다. 이 사례에서는 약 2.96%의 증우율이 계산되어, 이 P 값을 최대 관측지점인 AWS (2939)의 강우량이 2.0 mm에 곱해보면 약 0.03 mm의 최대 증우량인 계산되었다. 이렇게 수치 모의 도메인 내 관측된 강우량 값에 인공강우 증우율을 곱해보면, 실험지역에 평균적으로 0.022 mm 증우량이 발생한 것으로 계산하였다.
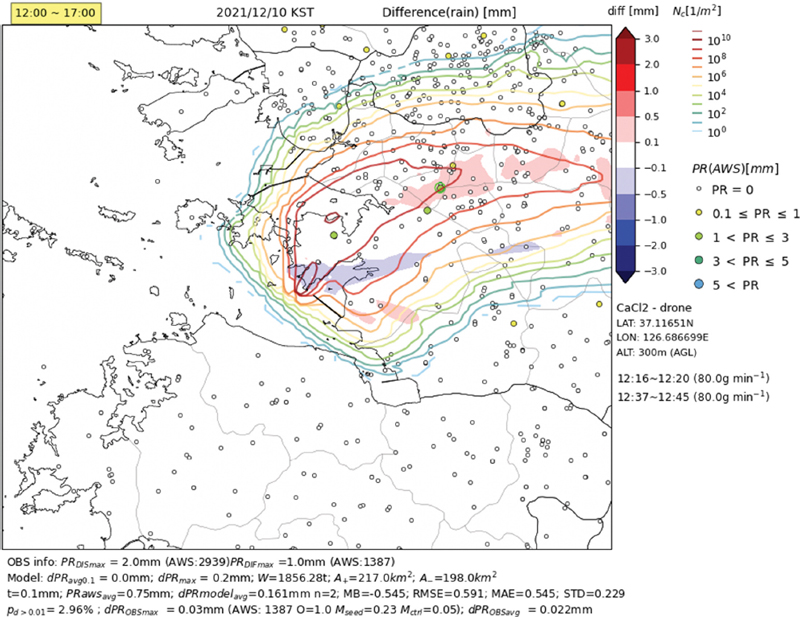
Five-hourly (12:00~17:00) accumulated precipitation change (shaded, SEED-NOSEED numerical simulation) due to cloud seeding and observed accumulated precipitation of AWS sites (color-filled circles) during the analysis time in case of December 10, 2021. Dashed line is the concentration (m–2) of vertically integrated seeding material averaged from the start to end of seeding ranging from 100 to 106 at intervals of 101. [OBS: Observation, PR: Precipitation amount (mm) in AWS. Nc: Number concentration of CaCl2 particles (m–2), PRDISmax: Maximum PR in numerical dispersion range of CaCl2 particles, PRDIFmax: Maximum PR in difference range of SEED and NOSEED numerical precipitation simulation of CaCl2 particles, W/A+/A–: Total precipitation enhancement amount (ton (t))/Areas of precipitation increment (km2)/Areas of precipitation decrement (km2) in the numerical domain, t: Minimum value for calculating a difference precipitation amount of SEED – NOSEED numerical precipitation simulation, PRawsavg/dPRmodelavg: Mean PR /Mean numerical calculated PR in difference range of SEED and NOSEED numerical simulation, MB/RMSE/MAE/STD: Mean bias Error/Root mean square error/Mean absolute error/Standard deviation of SEED – NOSEED numerical simulation, Pd>0.01: Ratio of SEED - NOSEEDSEED ×100% in numerical simulation more than 0.01 mm, dPROBSmax/dPROBSavg: Maximum/Mean of precipitation enhancement (= OⅹPd>0.01), and AWS O/Mseed/Mctl: Precipitation amount at each site/Precipitation amount of SEED/Precipitation amount of NOSEED in numerical simulation].
그러나 본 사례는 운저고도 700 m 조건에서 시딩을 운저고도 300 m 고도에 이루어진 실험으로서 구름 속에서 직접 시딩이 이루어지진 못하였다. 이로 인해 구름 속 직접 시딩에 의한 구름 응결에 의한 입자크기 강화 등에 영향을 수치모의 한 것만큼 영향을 주지 못한 것으로 평가된다. 초기 개발된 드론의 운영 기술 특성상 전지 운용 시간과 드론 공역 제한(500 m 이하 비행 승인)에 따른 한계로 인해 고고도 비행을 하지 못하였으나, 현재는 기능적 측면에서 지속 보완중이라 향후 수치모델의 유사한 인공증우 효과를 볼 수 있을 것으로 예상된다.
3.4 기상조절용 드론을 이용한 강원도 대관령 사례 연구(2022년 10월 5일)
강원도 대관령 지역에 발생한 하층운을 대상으로 2022년 10월 5일 약 52분간(15:48~16:40 LST) 드론 활용 실험을 수행하였다. Figure 8c는 실험 직전(2022. 10. 5. 15:00 LST) 종관 일기(기상청 지표면 일기도)이고, Fig. 8d는 위성영상(천리안 합성영상 자료)이며, 우리나라는 대륙의 찬 고기압의 영향으로 강원 지역 및 동해안 지역을 중심으로 하층운이 발생한 것을 확인할 수 있다. 당시 대관령 AWS 지점의 기상 상태는 지상 2 m 고도에서 풍속 2.0 m s-1의 동풍, 기온 9.3oC, 적운, 운고 0 m, 상대습도 100%를 나타내었다(Table 5). 드론 시딩 경로는 시딩 고도에서 동풍 계열의 바람과 수직한 방향의 직선 교차 시딩 방식으로 설계되었다. 시딩 물질 연소탄은 2발씩 총 12발(0oC 이상 조건 시 흡습성물질 연소탄 사용)이 사용되었으며, 2발씩 연속으로 점화되었다. 실험 당시 1회당 시딩 고도는 약 50 m, 비행속도는 5.0 m s-1, 총 시딩 거리는 20 m 간격의 20개 수평 구간에서 이루어졌으며, 각 연소탄의 연소시간은 평균 약 5분을 기록하였다.
실험 전‧후 강수입자의 수농도 및 강수량 증가에 대한 이해를 위해 Fig. 12에서 광학우적계[PARSIVEL(PARticle SIze and VELocity) disdrometer]에서 측정된 1분 평균 강수입자수농도, 강수량, 그리고 평균 입자 직경 변화를 나타내었다. 실험 현장의 경우, 앞서 제시한 연직레이더 반사도의 결과와 유사하게 구름입자의 수농도와 강수 입자의 크기 변화를 확인할 수 있다. 입자 수농도는 시딩 중 37.42 L-1에서 점점 증가하여 시딩 후 41.12 L-1까지 변화하고 있다. 입자크기 변화는 시딩 중 0.4 mm에서 시딩 후 0.5 mm 내외로 일부 증가한 경향을 보인다. 그러나 시딩 후 강수 기간에도 점차 크기가 감소한 것을 알 수 있다. 용평지점의 경우 실험 전·후 입자의 수농도와 입자크기 변화가 뚜렷하게 나타난 것을 확인할 수 있다. 평균입자 크기는 시딩 전 0.4 mm 내외에서 시딩 후 0.6 mm까지 크기가 증가한다. 입자의 수농도는 시딩 중에는 강수가 증가하나 시딩 후에는 감소하여 거의 나타나지 않는 것을 알 수 있다. 이는 동해안 쪽에 발달한 하층운이 건조한 강원 내륙 산악지역까지 깊게 파고들지는 못하는 것으로 사료된다. 즉 실험효과에 의해 입자의 크기가 일부 증가하였으나, 실제 해당 용평지점의 대기 중 수분함유량이 적어 시딩 물질 확산에 따른 풍하지역에서의 강수발달이 크게는 이어지진 못한 것으로 해석된다. 하지만 시딩을 수행한 대관령지에서 가까운 용평에서 시딩을 효과를 추정할 수 있는 효과가 나타난 것에 대해서는 긍정적인 자료인 것으로 생각된다.

Variations of 1-minute averaged number concentration, rain intensity (mm hr-1), and diameter of cloud particles at the experimental site (Daegwallyeong Cloud Physics Observatory, a) and diffusion site (Yongpyeong Observatory, b) from 15:00 to 20:00 LST on October 5, 2022.
Figure 13은 2022년 10월 5일 15:00~20:00 LST 기간 동안 1시간 간격으로 연직 누적한 시딩 물질의 확산분포와 AWS 강수분포를 보여준다. 시딩 물질은 강원 내륙 전역으로 점차 확산되는 경향을 보인다. AWS에서 관측된 강수는 주로 강원 동해안 지역을 따라 0.1 mm에서 5.0 mm 내외의 분포를 나타내고 있다. 시딩 물질이 확산된 영역 내에서 강수가 관측되는 것을 확인할 수 있으며, 시딩 후 1시간 후인 16:00~17:00 LST에 최대 0.9 mm(북강릉 지점)의 강수가 관측되어, 일부 시딩 효과 가능성을 예상할 수 있다. Figure 14는 주요 영향시간대인 15:00~18:00 LST(3시간) 동안 시딩-비시딩 수치모의에 의해 연직으로 적분된 누적 확산장, 추정 인공증우량, 그리고 AWS 누적 관측값을 나타낸다. 전체 시딩 물질의 누적 확산장은 동풍계열의 바람에 의해 강원내륙 및 충남 일부 지역까지도 확산된 분포를 보여준다. 이때 확산 범위 내에서 동일 시간대에 관측된 강수량의 최댓값은 실험 현장에 근접한 강원 대관령 횡계 지점(초록색 원으로 표시)에서 18.0 mm를 기록하였다. 한편, 수치모의에 의한 시딩-비시딩 강수량의 최대 변화는 횡계 지점에서 약 3.43 mm를 나타내어 관측값이 최대가 나타난 지점과도 일치한 경향을 보였다. 이 수치모델 도메인 내에서 증우된 지역은 약 318.0 km2이고 감우된 지역은 157.0 km2으로 증우된 지역인 감우된 지역 보다 약 2배로 크게 나타났다. 그리고 총면적 대비 증우량에서 감우량을 뺀 최종 증우량은 62,076.36톤(t)으로 수치모의 되었다. 이번 인공강우실험 사례에서 인공강우증우율[P(%)]은 약 19.6%의 증우율이 계산되었다. 이는 3.3절의 경기도 화성시 사례 보다 약 6배 높은 인공강우 증우효율이 나타났다. 즉 대관령 산악지역의 구름 및 기상환경이 인공강우실험에 보다 적합했다는 것을 객관적으로 나타내고 있다. 이 P 값을 최대 관측지점인 AWS (2821)의 강우량이 18.0 mm에 곱해보면 약 3.341 mm의 최대 증우량이 계산된다. 이렇게 수치모의 도메인 내 관측값에 인공강우 증우율을 곱해보면, 실험지역에 평균적으로 1.216 mm 증우량이 발생한 것으로 계산되었다. 이 결과는 인공강우 실험에 따른 시딩 물질의 효과 가능성을 보여주는 좋은 사례로 사료된다. 다만, 구름물리변수 특성에서 확인한 바와 같이 확산 및 주요 영향지역에서 충분한 수 액량이 공급되지는 못하여 제한적인 실험 효과를 보여주었다. 그러나 향후 수분공급이 충분한 대기상태에서 더 많은 지점과 넓은 구간의 시딩 경로를 설계한 동시 드론 실험이 이루어진다면 더 넓은 지역에서 시딩 효과를 확인할 수 있을 것으로 보인다.
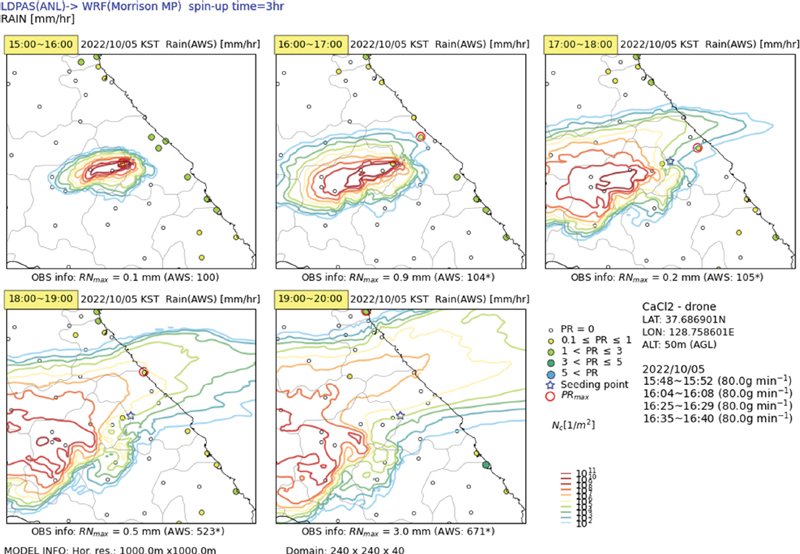
Hourly changes in number concentration (m-2) of vertically integrated CaCl2 in SEED numerical simulations (color dashed lines), accumulated precipitation observed AWS sites (color-filled circles) from 15:00~20:00 LST on October 5, 2022 [OBS: Observation, RN max: Maximum rain amount (mm) of AWS in numerical model domain and PR: Precipitation amount (mm) in AWS. Nc: Number concentration of CaCl2 particles (m-2)].
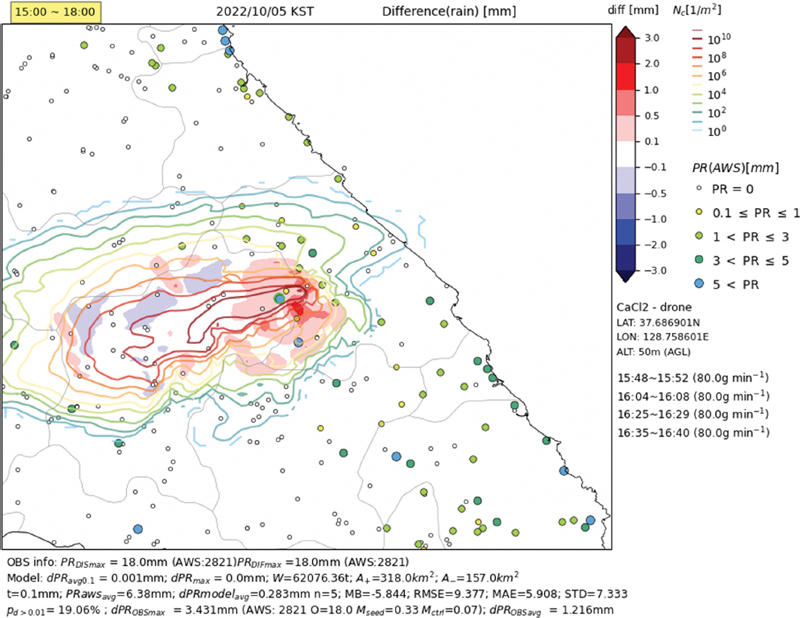
Three-hourly (15:00~18:00) accumulated precipitation change (shaded, SEED – NOSEED numerical simulation) due to cloud seeding and observed accumulated precipitation of AWS sites (color-filled circles) during the analysis time in case of October 5, 2022. Dashed line is the concentration (m–2) of vertically integrated seeding material averaged from the start to end of seeding ranging from 100 to 1010 at intervals of 102. [OBS: Observation, PR: Precipitation amount (mm) in AWS. Nc: Number concentration of CaCl2 particles (m–2), PRDISmax: Maximum PR in numerical dispersion range of CaCl2 particles, PRDIFmax: Maximum PR in difference range of SEED and NOSEED numerical precipitation simulation of CaCl2 particles, W/A+/A–: Total precipitation enhancement amount (ton (t))/Areas of precipitation increment (km2)/Areas of precipitation decrement (km2) in the numerical domain, t: Minimum value for calculating a difference precipitation amount of SEED – NOSEED numerical precipitation simulation, PRawsavg/dPRmodelavg: Mean PR/Mean numerical calculated PR in difference range of SEED and NOSEED numerical simulation, MB/RMSE/MAE/STD: Mean bias Error/Root mean square error/Mean absolute error/Standard deviation of SEED – NOSEED numerical simulation, Pd>0.01: Ratio of SEED - NOSEEDSEED ×100% in numerical simulation more than 0.01 mm, dPROBSmax/dPROBSavg: Maximum/Mean of precipitation enhancement (= OⅹPd>0.01), and AWS O/Mseed/Mctl: Precipitation amount at each site/Precipitation amount of SEED/Precipitation amount of NOSEED in numerical simulation].
4. 요약 및 결론
본 연구에서는 안개 또는 하층운 등을 대상으로 한 기상조절 실험에 활용하기 위한 자동비행형 드론이 국내 처음으로 개발되었다. 실제 실험 사례 적용을 통해 운영 절차 방안과 증우효과 확인 및 그 활용 가능성을 기술적으로 확인하였다. 특히 2021년부터 2022년 기간 드론을 활용한 기상조절 실험효과 확인 사례를 통해 실험의 개선과 운영 기술 개선방향에 대해 이해할 수 있었다.
드론을 기반으로 한 기상조절 실험은 가시권 밖에서의 1 km 이상 고고도 비행 및 공역 허가 제약 조건 등에 의해 실험적 제약을 크게 받는다. 가장 범용적으로 많이 활용되는 회전익 드론의 경우 비행시간이 짧다는 단점이 있다. 그리고 안개 실험의 경우, 실험을 위한 사전 검토 기간이 짧고 안개 발생 예측 확률이 상대적으로 강수예보에 비해 낮으므로 드론을 활용한 실험에 적극적으로 활용하기에 한계가 있다. 이런 드론 활용 기반 안개 및 하층운 대상 기상조절실험의 한계를 극복하기 위해서는 1 km 이하 고도의 제한적 조건에서 실험 고도, 실험 경로, 시딩 물질의 양과 시딩 지속시간을 연장하는 기초실험연구 등을 통해 기상조절 실험 효과 증대를 위한 연구가 필요할 것으로 판단된다.
현재, 국립기상과학원은 자동으로 수직형 이착륙이 가능한 드론 기술 개발과 운영 기술을 개발 진행 중이다. 향후, 복수 드론을 활용한 운영기술 확보와 실험 효과 증대를 위한 기초 실험연구를 통해 국내 기상조절 실용화를 이루는데 한 단계 더 도약할 계획이다. 또한 기상조절용 드론 활용 기술은 항공기 접근이 어려운 지역 및 지상연소기의 효율적 운영이 어려운 지역을 대상으로 안개뿐 만 아니라, 하층운을 대상으로 한 증우 및 증설 등 기상조절 기술 분야의 활용도를 크게 넓힐 수 있을 것이다.
Acknowledgments
본 연구는 기상청 국립기상과학원 “기상조절 및 구름물리연구”(KMA2018-00224)의 지원으로 수행되었습니다.
REFERENCES
-
Cha, J. W., and Coauthors, 2019: Analysis of results and technics about precipitation enhancement by aircraft seeding in Korea. Atmosphere, 29, 481-499.
[https://doi.org/10.14191/Atmos.2019.29.4.481]

-
Cha, J. W., H. J. Koo, B.-Y. Kim, B. Miloslav, H. J. Hwang, M. H. Kim, K.-H. Chang, and Y. H. Lee, 2023: Analysis of rain drop size distribution to elucidate the precipitation process using a cloud microphysics conceptual model and in situ measurement. Asia-Pac. J. Atmos. Sci., 59, 257-269.
[https://doi.org/10.1007/s13143-022-00299-w]

-
Chae, S., K.-H. Chang, S. Seo, J.-Y. Jeong, B.-J. Kim, C. K. Kim, S. S. Yum, and J. Kim, 2018: Numerical simulations of airborne glaciogenic cloud seeding using the WRF model with the modified morrison scheme over the Pyeongchang region in the winter of 2016. Adv. Meteor., 2018, 1-15.
[https://doi.org/10.1155/2018/8453460]

-
Chen, F., and J. Dudhia, 2001: Coupling an advanced land surface-hydrology model with the Penn State-NCAR MM5 modeling system. Part I: Model implementation and sensitivity. Mon. Wea. Rev., 129, 569-585.
[https://doi.org/10.1175/1520-0493(2001)129<0569:CAALSH>2.0.CO;2]

- Cho, H. J., 2003: Analysis of hazardous fog and index development in Korea. J. Korean Geogr. Soc., 38, 478-489.
-
Dolan, B., B. Fuchs, S. A. Rutledge, E. A. Barnes, and E. J. Thompson, 2018: Primary modes of global drop size distributions. J. Atmos. Sci., 75, 1453-1476.
[https://doi.org/10.1175/JAS-D-17-0242.1]

-
Gil, G., M. Yoo, and J. Park, 2020: A study on the development of airworthiness standards for VTOL UAS. J. Aeros. Syst. Eng., 14, 44-53.
[https://doi.org/10.20910/JASE.2020.14.1.44]

-
Hedworth, H. A., T. Sayahi, K. E. Kelly, and T. Saad, 2021: The effectiveness of drones in measuring particulate matter. J. Aerosol. Sci., 152, 105702.
[https://doi.org/10.1016/j.jaerosci.2020.105702]

- Heo, K.-Y., and K.-J. Ha, 2004: Classification of synoptic pattern associated with coastal fog around the Korean peninsula. J. Korean Meteorol. Soc., 40, 541-556.
-
Iacono, M. J., J. S. Delamere, E. J. Mlawer, M. W. Shephard, S. A. Clough, and W. D. Collins, 2008: Radiative forcing by long-lived greenhouse gases: Calculations with the AER radiative transfer models. J. Geophys. Res. Atmospheres, 113, 1-8.
[https://doi.org/10.1029/2008JD009944]

-
Jung, W., and Coauthors, 2022: Progressive and prospective technology for cloud seeding experiment by unmanned aerial vehicle and atmospheric research aircraft in Korea. Adv. Meteor., 2022, 1-14.
[https://doi.org/10.1155/2022/3128657]

-
Kim, B.-Y., J. W. Cha, A.-R. Ko, W. Jung, and J.-C. Ha, 2020a: Analysis of the occurrence frequency of seedable clouds on the Korean Peninsula for precipitation enhancement experiments. Remote Sens., 12, 1487.
[https://doi.org/10.3390/rs12091487]

-
Kim, B.-Y., J. W. Cha, W. Jung, and A.-R. Ko, 2020b: Precipitation enhancement experiments in catchment areas of Dams: Evaluation of water resource augmentation and economic benefits. Remote Sens., 12, 3730.
[https://doi.org/10.3390/rs12223730]

-
Kim, J.-S., J. H. Kim, S.-H. Park, and Y.-C. Kim, 2013: The study of characteristics of Korea Fog and Forecast Guidance. J. Korean Soc. Aviation Aeronautics, 21, 68-73.
[https://doi.org/10.12985/ksaa.2013.21.1.068]

-
Lim, Y.-K., B.-Y. Kim, K. H. Chang, J. W. Cha, and Y. H. Lee, 2022: Analysis of PM10 reduction effects artificial rain enhancement using numerical models. Atmosphere, 32, 341-351.
[https://doi.org/10.14191/Atmos.2022.32.4.341]

-
Nakanishi, M., and H. Niino, 2006: An improved Meller-Yamada level-3 model: Its numerical stability and application to a regional prediction of advection fog. Bound.-Layer Meteor., 119, 397-407.
[https://doi.org/10.1007/s10546-005-9030-8]

- NIMS, 2020: Development of application technology on atmospheric research aircraft (IV). National Institute of Meteorological Sciences. Press, 139 pp.
- NIMS, 2021: Development off application technology on atmospheric research aircraft (V). National Institute of Meteorological Sciences Press, 122 pp.
-
Wang, N., T. Yao, B. Xu, A. A. Chen, and W. Wang, 2019: Spatiotemporal pattern, trend, and influence of glacier change in tibetan plateau and surroundings under global warming. Bull. Chin. Acad. Sci., 34, 1220-1232.
[https://doi.org/10.16418/j.issn.1000-3045.2019.11.005]

- Weber, K., G. Heweling, C. Fischer, and M. Lange, 2017: The use of and octocopter UAV for the determination of air pollution-a case study of the traffic induced pollution plume around a river bridge in duesseldorf, Germany. Int. J. Education, 2, 63-66.
- Yang, H.-Y., and S.-N. Oh, 2005: Investigation on cloud properties for fog modification at Daegwallyeong Mountains. J. Korean Soc. Hazard Mitigation, 5, 45-56.
