기후예측시스템(GloSea5) 열대성저기압 계절예측 특성
Abstract
Seasonal predictability and variability of tropical storms (TCs) simulated in the Global Seasonal Forecast System version 5 (GloSea5) of the Korea Meteorological Administration (KMA) is assessed in Northern Hemisphere in 1996~2009. In the KMA, the GloSea5-Global Atmosphere version 3.0 (GloSea5-GA3) that was previously operated was switched to the GloSea5-Global Coupled version 2.0 (GloSea5-GC2) with data assimilation system since May 2016. In this study, frequency, track, duration, and strength of the TCs in the North Indian Ocean, Western Pacific, Eastern Pacific, and North Atlantic regions derived from the GloSea5-GC2 and GloSea5-GA3 are examined against the best track data during the research period. In general, the GloSea5 shows a good skill for the prediction of seasonally averaged number of the TCs in the Eastern and Western Pacific regions, but underestimation of those in the North Atlantic region. Both the GloSea5-GA3 and GC2 are not able to predict the recurvature of the TCs in the North Western Pacific Ocean (NWPO), which implies that there is no skill for the prediction of landfalls in the Korean peninsula. The GloSea5-GC2 has higher skills for predictability and variability of the TCs than the GloSea5-GA3, although continuous improvements in the operational system for seasonal forecast are still necessary to simulate TCs more realistically in the future.
Keywords:
Tropical storm, GloSea5, seasonal forecast1. 서 론
많은 양의 강수와 강한 바람을 동반하는 열대성 저기압은 단시간에 막대한 재산 및 인명 피해를 유발하여 사회·경제에 미치는 영향이 매우 크다(Southern, 1979; Pielke and Pielke, 1997; Camp et al., 2015). 반면에 우리나라와 같이 여름철에 강수가 집중되는 지역에서 열대성 저기압은 수자원의 주요 공급원으로 저수지와 댐의 수자원 보유량을 증가시키고 가뭄과 물부족을 해소하는 역할을 한다(Byun, 2009). 따라서 열대성 저기압 활동의 계절 예측 정보는 사회경제적 리스크를 관리하고 수자원 정책을 수립하는 정책결정자에게 매우 중요한 정보이다(Pan et al., 2015).
열대성 저기압 활동에 관한 계절 예측 노력은 1970년대 후반부터 시작되었다. 처음에는 통계-경험적 방법에 의한 접근법을 이용하였으며(Nicholls, 1979; Gray, 1984; Chan et al., 1998, 2001) 이후 상대적으로 새로운 방법인 기후-역학 모델을 이용하였다. 계절시간규모에서 역학적 예측은 대기-해양 결합모델을 이용하거나(Vitart et al., 2007; Molteni et al., 2011; MacLachlan et al., 2014; Vecchi et al., 2014; Camp et al., 2015) 해수면 온도가 처방된 대기 단일모델을 이용한다(LaRow et al., 2010; Zhao et al., 2010). 또한 통계적 방법과 함께 역학적 모델 결과를 결합한 하이브리드 방법을 이용하기도 한다(Vecchi et al., 2011; Kim et al., 2012; Ho et al., 2013; Villarini and Vecchi, 2013).
최근 세계기상기구 Subseasonal to Seasonal (S2S) 프로젝트의 활성화로 S2S 자료를 이용한 기후변동성에 관한 연구가 활발히 수행되고 있다. S2S Database는 11개 기관에서 참여하고 있으며 준실시간 예측자료(3주 지연)와 과거기후 모의자료를 제공하고 있다. S2S database 활성화를 통해 Madden and Julian Oscillation (MJO) 지수와 열대성 저기압 활동 관계를 규명하거나(Vitart and Robertson, 2018) 북서태평양 지역 열대성 저기압 발생에 관한 앙상블 예측 성능 검증(Yamaguchi et al., 2016), 2주~2개월 기간 열대성 저기압 발생의 확률적 예측 성능을 검증하는 연구(Lee et al., 2018) 등 열대성 저기압 활동에 관한 연구가 다양하게 수행되고 있다.
계절내 규모뿐만 아니라 계절 규모에서 열대성 저기압의 활동과 연관된 예측성능은 El Niño-Southern Oscillation (Camargo et al., 2010; Bell et al., 2014; Shaevitz et al., 2014; Wang et al., 2014) 및 MJO와 연관성이 크며(Finan et al., 2017), 다양한 equatorial wave (Wheeler and Kiladis, 1999; Schreck et al., 2012; Janiga et al., 2018)와 Rossby wave breaking (Zhang et al., 2017; Wang et al., 2018; Zhang and Wang, 2019)과도 관련되는 것으로 알려져 있다. 그러나 열대성 저기압의 중심 기압과 최대 풍속은 모델의 해상도에 따라 모의될 수 있는 최대 값이 한정적이어서 실제 관측 값에 비해 과소모의되어 강한 열대성 저기압을 모의하기에는 제한적이다(Williams et al., 2015). 이러한 한계를 극복하기 위해서는 대기-해양 결합 모델을 고해상도화하거나 열대성 저기압을 위한 특화된 모델의 개발이 필요하다.
한편, 한국 기상청(국립기상과학원)은 한영 공동기후예측시스템을 운영 중에 있으며 이를 이용하여 1~3개월 예보를 생산하고 대국민을 대상으로 계절예보를 서비스 중에 있다. 강수와 온도 변수를 이용하여 1개월(3~6주)예보와 3개월 예보를 수행 하고 있으며 추가적으로 다른 변수에 대한 예측이 가능한지 지속적으로 검토 중에 있다. 영국기상청의 경우 Camp et al. (2015) 연구에서 GloSea4 버전과 GloSea5 버전에 대한 열대성 저기압 활동에 관한 계절예측 성능 검증을 수행하였으며 기후예측시스템의 버전 업그레이드 때마다 주기적으로 예측성능을 검증하고 있다.
그러나 한국기상청 기후예측시스템의 열대성 저기압 예측 성능은 아직까지 연구되지 못한 상황이다. 본 연구에서는 N216(약 60 km) 해상도를 가지는 대기-해양 결합 모델인 현업 기후예측시스템(GloSea5)를 이용하여 과거기후 모의 자료를 이용하여 북반구에서 발생 가능한 열대성 저기압 활동의 예측 특성을 분석하였다. 또한 기상청 현재 현업 기후예측시스템 버전인 GloSea5-GC2와 이전 현업 버전인 GloSea5-GA3 성능을 비교하였다.
제 2장에서는 모델자료과 관측자료 및 열대성 저기압 탐지방법과 분석 방법을 서술하였으며, 3장에서는 해역별 계절 평균 발생 수와 발생지점 및 이동진로 예측성능 분석 결과를 제시하였고 4장에서는 열대성 저기압 발생 수의 연, 월 변동성과 발생일에 따른 지속기간 및 중심기압과 최대풍속을 이용한 강도에 대해 분석하였다.
2. 자료 및 분석방법
2.1 기후예측시스템 과거기후 모의자료
한국기상청 기후예측시스템(GloSea5)은 대기, 해양, 지면, 해빙 모델이 CERFACS (Valcke, 2006)에서 개발된 커플러(OASIS)로 하나의 시스템으로 결합되어있다. 대기모델은 Met Office의 Unified Model (UM; Davies et al., 2005)을 이용하고, 지표면 모델은 Joint UK Land Environment Simulator (JULES; Best et al., 2011)가 결합되어 있다. 해양모델은 Nucleus for European Modelling of the Ocean (NEMO; Madec, 2008)이 사용되고 있다. 또한 해빙 모델은 Los Alamos sea ice model (CICE; Hunke and Lipscomb, 2010)이 결합되어 있다. 해상도는 대기모델의 경우 N216 (0.83 × 0.55)으로 약 60 km이며, 해양(NEMO)은 ORCA 0.25로 약 25 km이다.
본 연구에서는 열대성 저기압 예측성과 변동성 분석 및 비교를 위해 한국기상청 기후예측시스템(GloSea5)의 2014년 버전인 Global Atmosphere configuration 3.0 (GA3)와 2016년 버전인 Global Coupled configuration 2.0 (GC2) 버전을 이용하였다. GC2 버전은 Global Atmosphere 6.0과 Global Land 6.0 (GA6.0 and GL6.0; Walters et al., 2017), Global Ocean 5.0 (GO5.0; Megann et al., 2014), Global Sea Ice 6.0 (GSI6.0; Rae et al., 2015)으로 구성된다. 두 모델의 자세한 구성은 Table 1과 같다.
과거기후 모의자료의 공통된 기간은 14년(1996~2009)이며 Hindcast 5월 1일 초기장 3개의 앙상블 멤버를 이용하였다. 기후예측시스템 과거기후 모의자료는 매월 4개의 초기시간(1, 9, 17, 25일)을 가지며 예측기간은 245일이고, 본 연구에서는 열대성 저기압 계절 예측성 분석을 위해 5월 1일 초기시간의 앙상블 평균된 열대성 저기압 예측장을 이용하였다.
2.2 열대성저기압 관측자료
열대성 저기압 예측성과 변동성 검증을 위해 1996년부터 2009년까지의 관측 기반 재분석된 자료를 이용하였다. 북아틀란타와 동태평양 해역 관측 자료는 National Oceanic and Atmospheric Administration (NOAA) National Hurricane Center’s best-track Hurricane Database (HURDAT2; Landsea and Franklin, 2013) 자료를 이용하였으며 서태평양의 경우 일본기상청 도쿄지역특별기상센터(Regional Specialized Meteorological Center, RSMC) 자료, 북인도양은 인도기상청 뉴델리 지역특별기상센터 자료를 이용하였다. 본 연구에서 열대성 저기압은 34 knots (39 mph; 17.5 m s-1) 이상의 풍속을 가지는 시스템으로 정의하였으며 중위도에서 발생하는 아열대 저기압은 제외하였다.
2.3 열대성저기압 탐지 및 분석방법
본 연구에서는 열대성 저기압 탐지 알고리즘인 TRACK (Hodges, 1995, 1996, 1999; Bengtsson et al., 2007)을 이용하여 검증을 수행하였다. TRACK 알고리즘은 해상도에 관계없이 표준 탐지 기준을 모든 해상과 모델에 적용하여 탐지하는 알고리즘으로 다른 해상도를 가지는 결과와의 직접적인 비교가 가능하다. 850 hPa 상대와도가 3.5 e-5 s-1 이상, 풍속 17m s-1 이상이 2일 이상 연속될 때를 기준으로 북반구 4개 영역의 열대성 저기압 활동에 대해 검증을 수행하였다. 4개 영역은 Fig. 1과 같이 북반구 4개 영역인 북아틀란타해역(North Atlantic, NA), 동태평양해역(Eastern Pacific, EP), 서태평양해역(Western Pacific, WP), 북인도양해역(North Indian Ocean, NI)으로 구분하였다. 열대성 저기압 발생지점과 이동경로의 밀도 분석을 위해 격자 4o × 4o 기준으로 분석을 수행하였으며 앙상블 수와 분석기간으로 나누어 표준화하여 관측자료와 비교가 가능하다.
3. 열대성저기압 발생 및 이동 특성
1996년부터 2009년까지 14년 동안 GloSea5-GA3, GloSea5-GC2, 관측자료를 이용하여 열대성 저기압의 예측 특성을 비교하였다. 평가를 위해 5~11월 예측된 열대성 저기압의 계절 평균 발생 수, 발생지점, 이동진로와 발생에 따른 지속기간을 평가하였다.
3.1 열대성저기압 계절 평균 발생 수와 발생지점 분포 특성
GloSea5-GA3, GloSea5-GC2, 관측자료에 따른 해역별 열대성 저기압의 계절평균 예측 발생 수와 발생지점의 밀도 분포를 각각 Fig. 2와 Fig. 3에 나타내었다. 관측자료의 경우 해역별 발생 수는 서태평양 해역이 가장 많은 발생 수를 보이고, 그 다음으로 동태평양 해역, 북아틀란타 해역, 북인도양 해역 순으로 발생하는 분포를 보인다. 두 모델 별로 비교해 보면 서태평양 해역의 경우 관측에 비해 다소 과대모의하는 경향을 보이며 GloSea5-GA3가 GloSea5-GC2보다 발생 수의 변동 폭은 큰 경향을 보인다. 동태평양 해역은 GloSea5-GC2가 관측에 유사한 발생 수를 예측하였으며 북아틀란타 해역은 두 모델 모두 과소모의 경향이 뚜렷하고 이러한 결과는 이전 연구 결과에서도 일치한다(e.g. Bengtsson et al., 2007; Strachan et al., 2013; Camargo, 2013; Kim et al., 2014; Vecchi et al., 2014). 북인도양 해역은 다소 과대모의 경향을 보인다.
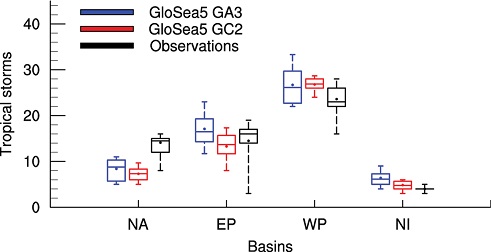
Seasonal average numbers of tropical storms in GloSea5-GA3 (blue), GloSea5-GC2 (red) and observations (black) for individual ocean basin during the period 1996~2009.
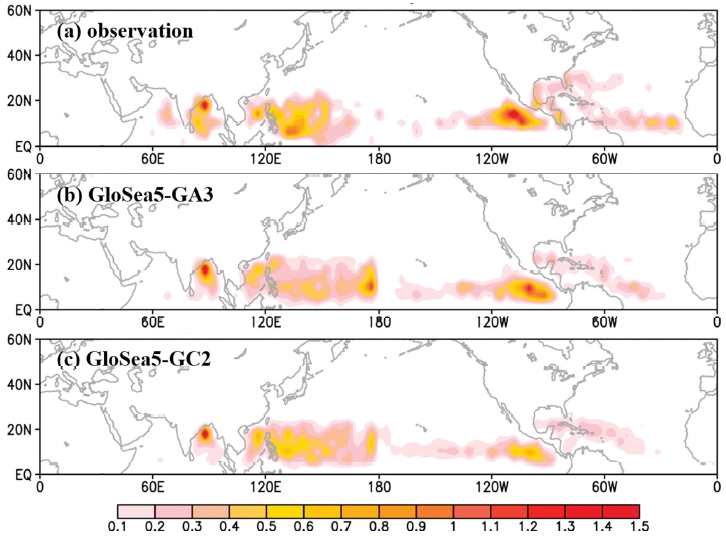
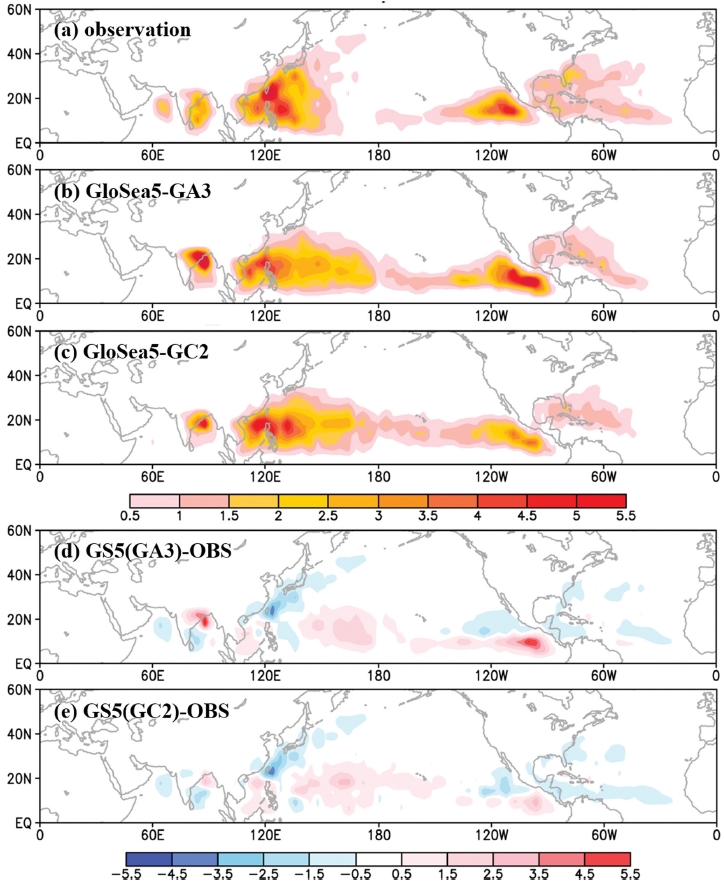
Seasonal mean tropical storm occurrence frequency density for (a) observations, (b) GloSea5-GA3, and (c) GloSea5-GC2 during the period 1996~2009.
열대성 저기압의 발생지점 밀도 분포의 경우 동태평양 해역은 발생지점이 매우 유사하여 좁은 해역에서 밀도가 높게 나타나는 특징을 보이며 서태평양은 동태평양보다 더 넓은 해역에서 발생하는 분포를 보인다. 북아틀란타 해역은 다른 해역에 비해 높은 위도대(20oN 이상)에서 발생하는 경우도 보인다. GloSea5-GA3와 GloSea5-GC2의 경우 전반적으로 발생지점의 분포를 유사하나 GloSea5-GA3의 경우 중태평양에서 발생 수가 높은 특징이 나타난다. 관측과 비교하면 두 모델 모두 중태평양 해역에서 상대적으로 높은 발생수를 보이고, 동태평양 해역에서는 멕시코 해안을 따라 발생하는 관측 분포와 유사하지만 좀 더 남쪽으로 치우쳐 발생하는 특징을 보인다. 또한 북아틀란타해 높은 위도에서 발생하는 열대성 저기압을 모델에서는 모의하지 못하는 특징이 나타난다.
3.2 이동진로 분포
Figure 3의 열대성 저기압 발생지점에서 이동경로에 대한 밀도 분포를 Fig. 4에 나타내었다. 관측의 경우 서태평양 해역 열대성저기압의 고위도 이동이 잘 나타나며 중태평양 해역은 열대성 저기압 활동이 거의 없는 분포를 보인다. 북아틀란타 해역은 동태평양에 비해 열대성 저기압 활동이 적으며 동태평양 해역에서 발생한 열대성 저기압은 중태평양쪽으로 이동이 적은 특징을 보인다.
GloSea5-GA3와 GloSea5-GC2 모델 모의 특징의 경우 서태평양 해역은 관측에 비해 중위도로 북상하는 열대성 저기압을 과소모의하는 경향이 뚜렷하다. 또한 중태평양 해역의 밀도는 높은 분포를 보인다(Figs. 4b, c). 이러한 분포는 관측대비 모델의 이동경도 밀도편차 그림에서도 중위도로 이동하는 열대성 저기압의 밀도가 낮게 나타나며, 중 태평양으로 이동하는 밀도가 큰 값을 가지는 것에서도 확인 가능하다(Figs. 4d, e). 이것은 열대성 저기압이 발생 후 남북 이동보다는 동서 이동이 뚜렷함을 나타낸다. 그럼에도 불구하고 관측에서 나타난 필리핀 해역에서 밀도가 높은 분포를 두 모델 모두 잘 모의한다. 이러한 결과는 Camp et al. (2015) 결과와 잘 일치한다. 동태평양 해역 열대성 저기압 이동경로의 경우 관측에서는 발생한 지점에서 이동이 적으나 두 모델의 경우 발생한 지점에서 중태평양 해역으로 이동하는 분포가 나타난다(Figs. 4b, c). 또한 이동경로 밀도편차에서 관측에 비해 모델은 더 낮은 위도에서 밀도가 높은 분포를 보이고(Figs. 4d, e), GloSea5-GC2에서 이러한 크기는 다소 적은 향상된 모의 결과가 나타난다(Fig. 4e). 북인도양 해역의 경우 관측에서는 벵갈만과 아라비아해에서 열대성 저기압의 활동이 모두 관측되지만 모델에서는 벵갈만에서만 모의가 되는 특징을 보인다. 벵갈만의 경우 GloSea5-GA3에서 양의 밀도편차가 강하게 나타나며 GloSea5-GC2에서 약화되어 향상된 결과를 보인다.
3.3 발생일과 지속기간 관계
해역 별로 열대성 저기압의 발생일에 따른 지속기간 분포 특성을 분석하였다. Figure 5는 4개 해역 관측, GloSea5-GA3, GloSea5-GC2에서 열대성 저기압의 발생일에 따른 지속기간을 나타내는 그림으로 원 둘레와 반지름이 각각 발생일과 지속기간을 의미한다.
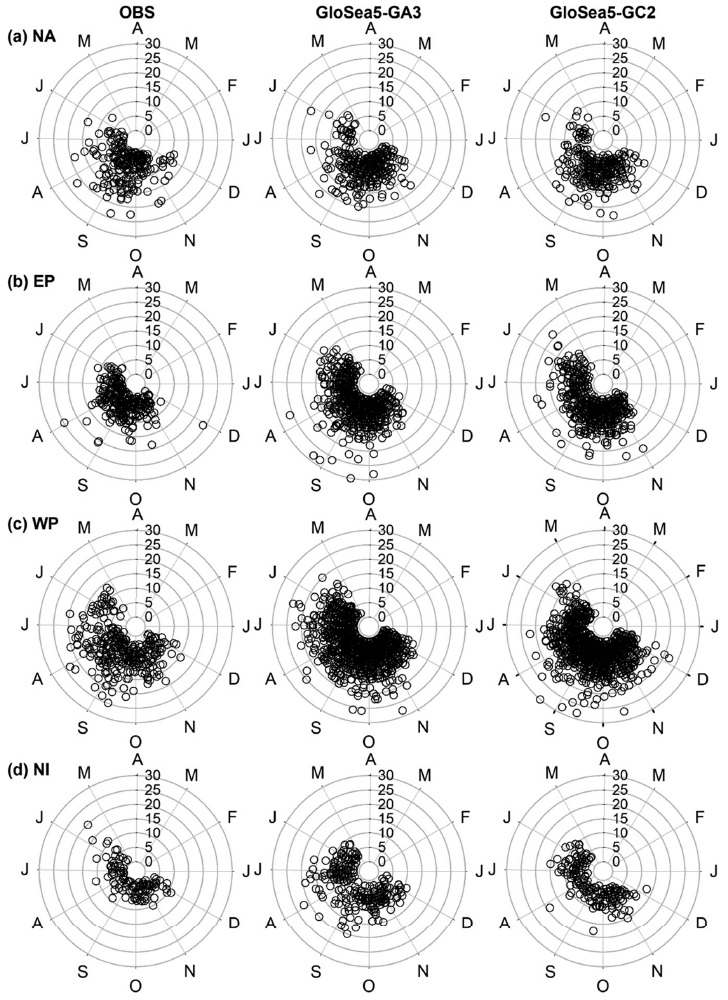
Scatterplot of tropical storm occurrence date against duration for individual ocean basins at observation, GloSea5-GA3, and GloSea5-GC2. Each radial axis and radius denote the first day of the month and duration, respectively.
해역 별로 보면 북아틀란타해는 관측에서 주로 20일 이하의 지속기간을 가진다. 8~9월 발생한 열대성 저기압의 지속기간이 길다. 두 모델의 경우 역시 8~9월 발생한 열대성 저기압의 지속기간이 길게 나타나며 전반적으로 관측과 유사하나 10월 발생한 열대성 저기압의 지속기간이 관측에 비해 상대적으로 긴 특성을 가진다. 동태평양 해역의 경우 지속기간이 15일 이하로 짧은 지속기간을 보이고 있으며 8~9월 발생한 열대성 저기압의 지속기간이 상대적으로 긴 특성을 보인다. 두 모델에서도 8~9월 발생한 열대성 저기압의 지속기간이 다른 월에 비해 상대적으로 길지만 관측대비 전반적으로 긴 지속기간이 나타난다. 또한 GloSea5-GA3의 경우 25일 이상의 지속기간을 가지는 열대성 저기압이 나타나 관측대비 과대 모의하는 경향을 보인다. 서태평양의 경우 관측에서는 8~9월 발생한 열대성 저기압의 지속기간이 긴 특성을 보이는 반면 GloSea5-GA3는 6~7월과 9~10월에서 높은 지속기간을 가지는 것으로 나타난다. GloSea5-GC2의 경우 8~9월 발생한 열대성 저기압의 지속기간이 길게 나타나며 관측에 비해 11월 발생한 열대성 저기압도 15일 이상의 지속기간을 가져 과대모의 경향이 나타난다. 북인도양 해역의 경우 관측은 5월에 발생한 열대성 저기압의 지속기간이 긴 특성을 가진다. 그러나 GloSea5-GA3는 7~9월 지속기간이 길게 나타나 과대모의 경향을 보이고, 상대적으로 GloSea5-GC2의 지속기간 분포가 GA3에 비해 관측과 유사한 특성을 보인다.
4. 열대성저기압 변동성
4.1 발생 수의 연별 변동성
1996~2009년 동안 4개 해역에 대한 열대성 저기압 발생 수의 연별 변동성을 분석하였다(Fig. 6). 각각의 해는 발생 수 평균을 이용하여 표준화하였다. 관측, GloSea5-GA3, GloSea5-GC2에 대해 연별 변동성을 분석하였으며 관측 대비 Pearson 상관 계수와 P-value를 Table 2에 나타내었다. 95% 신뢰수준에서 유의성을 보이는 상관은 GloSea5-GA3의 동태평양 해역(-0.76)과 북인도양 해역(0.56)에서 나타났으며 특히 동태평양 해역은 관측 대비 음의 상관을 보여 예측성능이 좋지 못한 특성을 보였다. 동태평양 지역 열대성 저기압 탐지의 경우 상당한 바이어스가 존재하는 것으로 생각되며, 추가적인 연구가 필요할 것으로 판단된다.
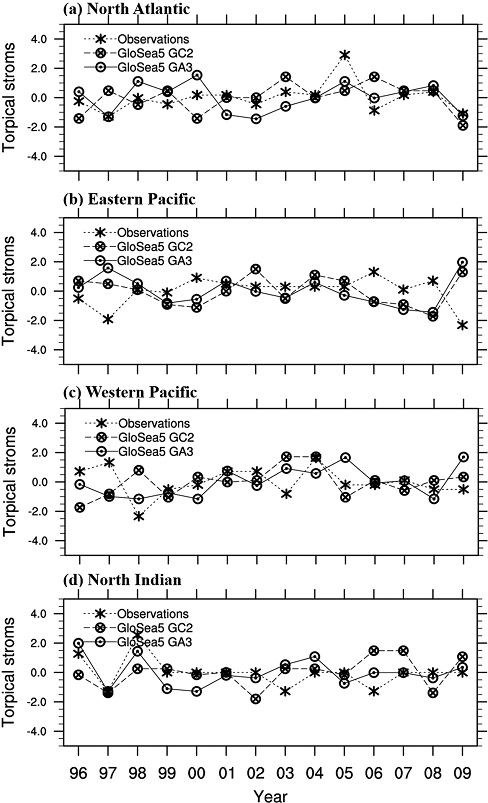
Normalized tropical storm frequency for (a) the North Atlantic, (b) eastern Pacific, (c) western Pacific and (d) North Indian in observation, GloSea5-GA3 and GloSea5-GC2 during the period 1996~2009. Results are normalized for each year by subtracting the mean of the whole ensemble for all years and then dividing by the standard deviation of the ensemble means.

Pearson linear correlations (p-values) of interannual variability of tropical storms frequency from GloSea5-GA3 and GloSea5-GC2 with observations for individual ocean basins as defined in Fig. 1 during the period 1996~2009. It is calculated using two-tailed Student’s t distributions with P values of 0.05. Bold implies statistical significance at the 95% level.
이와 관련하여 기후예측시스템의 해양 예측 성능은 이전 연구에서 크게 낮은 특성을 보이지는 않았다. Lim et al. (2018)은 기후예측시스템의 El Niño 발달부터 절정, 쇠퇴까지 동아시아 기온 및 강수 예측성을 검증한 결과 고위도로 갈수록 오차는 증가하지만, 한달 선행시간에서 여름철 El Niño 발달기의 예측 성능은 매우 높은 것으로 분석되었다. El Niño 절정기 겨울철에는 북서태평양의 양의 강수 편차 및 양의 기온 편차를 매우 잘 모의하였다. 또한 Lee et al. (2016)은 NINO3.4 지역에서 해수면온도 아노말리의 예측성능을 검증한 결과, 비록 1~12일까지의 중기 예측성을 검증하였지만 UM 모델에 비해 12일까지 예측성은 기후예측시스템의 성능이 더 높은 것으로 나타났다. 또한 M JO에 대한 예측성에서도 강도가 강한 경우와 약한 경우 모두 UM 모델과 유사하거나 뛰어난 예측성능을 보였다.
GloSea5-GC2의 경우 모든 해역에서 통계적으로 유의한 상관은 나타나지 않았으며 동태평양 해역에서 역시 음의 상관을 보였고, 서태평양에서 GloSea5-GA3 보다 높은 상관(0.23)을 보이는 것으로 분석되었다.
4.2 발생 수의 계절 주기성
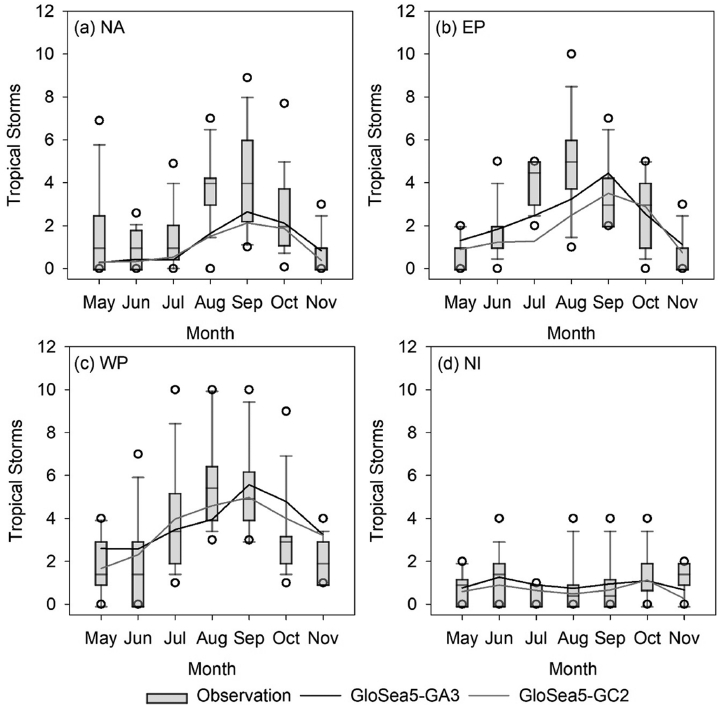
열대성 저기압의 월별 발생 수를 이용한 계절 주기성을 Fig. 7에 나타내었다. 전반적으로 두 버전 모두 관측에 유사한 계절 발생 수를 보이고 있으며 북아틀란타 해역의 경우 낮은 발생 수로 인해 과소모의 경향이 뚜렷이 나타난다. 10~11월을 제외하고 모든 월에서 관측대비 낮은 발생 수를 모의하고 있다. 동태평양 해역의 경우 7~8월은 과소 모의, 그 외 월에서는 관측과 유사한 발생 수를 보인다. GloSea5-GC2가 GA3에 비해 관측 중앙 값에 더 유사한 분포를 보인다. 8월에 관측 발생 수가 가장 높으나, 두 모델은 9월에 가장 높은 발생 수를 모의한다. 다른 해역에 비해 서태평양 해역에서 두 모델은 발생 수를 가장 잘 모의하고 있으며 GloSea5-GC2가 GA3에 비해 모든 월에서 발생 수를 잘 모의하고 있다. 최대 발생 수는 관측의 경우 8월, 두 모델은 9월로 모의되었다. 10~11월은 두 모델 모두 관측에 비해 과대 모의 경향이 나타난다. 북인도양 해역은 다른 해역에 비해 발생 수가 매우 낮으며 관측의 6월과 11월 발생 수 피크는 모델에서도 모의된다.
4.3 열대성 저기압의 기압과 풍속 관계
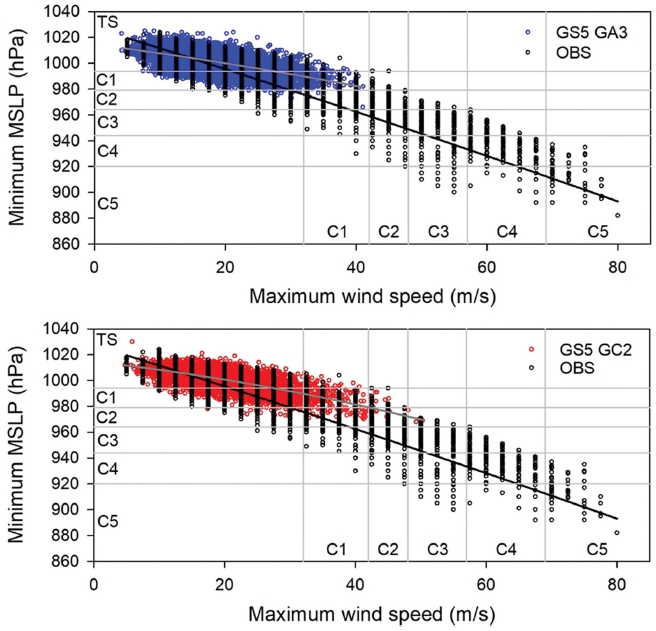
관측 대비 두 모델에서 모의된 열대성 저기압의 기압-풍속 관계를 Fig. 8에 나타내었다. 전반적으로 두 모델의 해상도가 N216이기 때문에 관측에서 나타나는 강한 열대성 저기압을 모의하지 못하는 한계는 잘 나타난다. GloSea5-GA3의 경우 기압과 풍속 모두 1등급 정도의 열대성 저기압을 모의하고 있다. 그러나 GloSea5-GC2에서는 기압과 풍속 모두 2등급까지의 열대성 저기압이 모의되고 있어 개선된 결과를 보였다. 이러한 결과는 처음 영국기상청에서 GC2 버전이 개발되었을 당시의 열대성 저기압 예측성능 결과(기압 3등급, 풍속 1등급까지 모의)와 비교하면(Williams et al., 2015) 영국 기상청 GC2 버전은 반경이 큰 열대성 저기압을 모의하는 반면 GloSea5-GC2 버전은 상대적으로 반경은 작지만 강한 풍속을 가지는 열대성 저기압을 모의하는 것으로 분석된다.
5. 요약 및 결론
본 연구는 한국기상청 기후예측시스템(GloSea5)의 2016년 이전 버전인 GloSea5-GA3와 이후 현재 현업 시스템인 GloSea5-GC2의 기후장(1996-2009)에 대해 관측(Best track) 대비 열대성 저기압 활동의 예측성과 변동성을 분석한 연구이다. 북반구 4개 영역(북아틀란타, 동태평양, 서태평양, 북인도양)을 대상으로 변동성 분석을 위해 계절 평균 발생 수, 연별 변동성, 월별 발생 수를 분석하였으며 발생지점, 이동경로, 지속기간와 강도에 대한 예측성을 관측자료와 비교하였다.
그 결과 열대성 저기압의 계절 평균 발생 수는 서/동태평양에서 관측과 유사한 예측성을 보였으며, 북아틀란타는 과소모의 경향이 뚜렷하였다. 발생 수의 연별 변동성을 분석한 결과 통계적으로 유의한 결과는 북인도양 GloSea5-GA3에서 양의 상관을 보였으며 다른 해역에서는 좋지 못한 모의성능을 보였다. 월별 발생 수의 경우 북아틀란타에서 계절 평균 발생 수와 같이 과소모의 경향을 보였으나 전반적으로 모든 해역에서 관측과 유사하게 월별 발생 수의 모의가 가능하였다.
발생 지점을 관측자료와 비교한 결과 두 모델 모두 중태평양에서 과대모의 경향이 나타났으며, 이동경로 밀도 분포의 경우 서태평양에서 북상하면서 전향하는 열대성 저기압의 모의성능이 매우 낮아 한반도 및 일본 해안을 따라 상륙하는 열대성 저기압을 모의하지 못했다. 열대성 저기압 발생일에 따른 지속기간의 경우 동태평양은 두 모델 모두 지속기간이 관측보다 더 길게 나타났으며 전반적으로 GloSea5-GC2가 GloSea5-GA3에 비해 관측과 유사한 분포를 보였다. 중심기압과 최대풍속 관계로 분석된 열대성 저기압 강도의 경우 GloSea5-GA3는 1등급, GloSea5-GC2는 2등급 강도까지 모의가 가능해 개선된 모의 성능을 보였으나 관측에 비해 매우 약했으며, 관측과 유사한 강도 예측을 위해서는 기후예측시스템의 해상도 업그레이드가 필요하다.
Acknowledgments
이 연구는 기상청 국립기상과학원 「장기예측시스템 개발」(KMA2018-00322)의 지원으로 수행되었습니다.
References
-
Bell, R., K. Hodges, P. L. Vidale, J. Strachan, and M. Roberts, 2014: Simulation of the global ENSO-tropical cyclone teleconnection by a high-resolution coupled general circulation model. J. Climate, 27, 6404-6422.
[https://doi.org/10.1175/JCLI-D-13-00559.1]

-
Bengtsson, L., K. I. Hodges, M. Esch, N. Keenlyside, L. Kornblueh, J.-J. Luo, and T. Yamagata, 2007: How may tropical cyclones change in a warmer climate? Tellus A, 59, 539-561.
[https://doi.org/10.1111/j.1600-0870.2007.00251.x]

-
Best, M. J., and Coauthors, 2011: The Joint UK Land Environment Simulator (JULES), model description – Part 1: Energy and water fluxes. Geosci. Model Dev., 4, 677-699.
[https://doi.org/10.5194/gmd-4-677-2011]

- Byun, H.-R., 2009: Comparative analysis of the drought diagnosis and related systems. J. Korean Soc. Hazard Mitig., 9, 7-18 (in Korean).
-
Camargo, S. J., 2013: Global and regional aspects of tropical cyclone activity in the CMIP5 models. J. Climate, 26, 9880-9902.
[https://doi.org/10.1175/JCLI-D-12-00549.1]

-
Camargo, S. J., A. H. Sobel, A. G. Barnston, and P. J. Klotzbach, 2010: The Influence of natural climate variability on tropical cyclones, and seasonal forecasts of tropical cyclone activity. In J. C. L. Chan et al. Eds., Global Perspectives on Tropical Cyclones, World Scientific, 325-360.
[https://doi.org/10.1142/9789814293488_0011]

-
Camp, J., M. Roberts, C. MacLachlan, E. Wallace, L. Hermanson, A. Brookshaw, A. Arribas, and A. A. Scaife, 2015: Seasonal forecasting of tropical storms using the Met Office GloSea5 seasonal forecast system. Q. J. R. Meteorol. Soc., 141, 2206-2219.
[https://doi.org/10.1002/qj.2516]

-
Chan, J. C. L., J.-E. Shi, and C.-M. Lam, 1998: Seasonal forecasting of tropical cyclone activity over the western North Pacific and the South China Sea. Wea. Forecast., 13, 997-1004.
[https://doi.org/10.1175/1520-0434(1998)013<0997:SFOTCA>2.0.CO;2]

-
Chan, J. C. L., J.-E. Shi, and K. S. Liu, 2001: Improvements in the seasonal forecasting of tropical cyclone activity over the western North Pacific. Wea. Forecast., 16, 491-498.
[https://doi.org/10.1175/1520-0434(2001)016<0491:IITSFO>2.0.CO;2]

-
Davies, T., M. J. P. Cullen, A. J. Malcolm, M. H. Mawson, A. Staniforth, A. A. White, and N. Wood, 2005: A new dynamical core for the Met Office’s global and regional modelling of the atmosphere. Q. J. R. Meteorol. Soc., 131, 1759-1782.
[https://doi.org/10.1256/qj.04.101]

- Finan, C., H. Wang, and J. Schemm, 2017: CFSv2-based hybrid dynamical-statistical model for week 3 to 4 forecast of Atlantic/Pacific tropical storm activity. Prepints, 42nd NOAA Annual Climate Diagnostics and Prediction Workshop, Norman, OK, Science and Technology Infusion Climate Bulletin, NOAA’s National Weather Service, 49-52.
-
Gray, W. M., 1984: Atlantic seasonal hurricane frequency. Part II: Forecasting its variability. Mon. Wea. Rev., 112, 1669-1683.
[https://doi.org/10.1175/1520-0493(1984)112<1669:ASHFPI>2.0.CO;2]

-
Ho, C.-H., J.-H. Kim, H.-S. Kim, W. Choi, M.-H. Lee, H.-D. Yoo, T.-R. Kim, and S. Park, 2013: Technical note on a track-pattern-based model for predicting seasonal tropical cyclone activity over the western North Pacific. Adv. Atmos. Sci., 30, 1260-1274.
[https://doi.org/10.1007/s00376-013-2237-6]

-
Hodges, K. I., 1995: Feature tracking on the unit sphere. Mon. Wea. Rev., 123, 3458-3465.
[https://doi.org/10.1175/1520-0493(1995)123<3458:FTOTUS>2.0.CO;2]

-
Hodges, K. I., 1996: Spherical nonparametric estimators applied to the UGAMP model integration for AMIP. Mon. Wea. Rev., 124, 2914-2932.
[https://doi.org/10.1175/1520-0493(1996)124<2914:SNEATT>2.0.CO;2]

-
Hodges, K. I., 1999: Adaptive constraints for feature tracking. Mon. Wea. Rev., 127, 1362-1373.
[https://doi.org/10.1175/1520-0493(1999)127<1362:ACFFT>2.0.CO;2]

- Hunke, E. C., and W. H. Lipscomb, 2010: CICE: The sea ice model documentation and software user’s manual, version 4.1. Tech. Rep. LA-CC-06-012, 76 pp.
-
Janiga, M. A., C. J. Schreck, J. A. Ridout, M. Flatau, N. P. Barton, E. J. Metzger, and C. A. Reynolds, 2018: Subseasonal forecasts of convectively coupled equatorial waves and the MJO: activity and predictive skill. Mon. Wea. Rev., 146, 2337-2360.
[https://doi.org/10.1175/MWR-D-17-0261.1]

-
Kim, H.-S., G. A. Vecchi, T. R. Knutson, W. G. Anderson, T. L. Delworth, A. Rosati, F. Zeng, and M. Zhao, 2014: Tropical cyclone simulation and response to CO2 doubling in the GFDL CM2.5 high-resolution coupled climate model. J. Climate, 27, 8034-8054.
[https://doi.org/10.1175/JCLI-D-13-00475.1]

-
Kim, H.-S., C.-H. Ho, J.-H. Kim, and P.-S. Chu, 2012: Track-pattern-based model for seasonal prediction of tropical cyclone activity in the western North Pacific. J. Climate, 25, 4660-4678.
[https://doi.org/10.1175/JCLI-D-11-00236.1]

-
Landsea, C. W., and J. L. Franklin, 2013: Atlantic hurricane database uncertainty and presentation of a new database format. Mon. Wea. Rev., 141, 3576-3592.
[https://doi.org/10.1175/MWR-D-12-00254.1]

-
LaRow, T. E., L. Stefanova, D.-W. Shin, and S. Cocke, 2010: Seasonal Atlantic tropical cyclone hindcasting/forecasting using two sea surface temperature datasets. Geophys. Res. Lett., 37, L02804.
[https://doi.org/10.1029/2009GL041459]

-
Lee, C.-Y., S. J. Camargo, F. Vitart, A. H. Sobel, and M. K. Tippett, 2018: Subseasonal tropical cyclone genesis prediction and MJO in the S2S dataset. Wea. Forecasting, 33, 967-988.
[https://doi.org/10.1175/WAF-D-17-0165.1]

-
Lee, S.-M., H.-S. Kang, Y.-H. Kim, Y.-H. Byun, and C. H. Cho, 2016: Verification and comparison of forecast skill between Global Seasonal Forecasting System version 5 and Unified Model during 2014. Atmosphere, 26, 59-72. (in Korean with English abstract).
[https://doi.org/10.14191/Atmos.2016.26.1.059]

- Lim, S.-M., Y.-K. Hyun, H.-S. Kang, and S.-W. Yeh, 2018: Prediction skill of East Asian precipitation and temperature associated with El Niño in GloSea5 hindcast data. Atmosphere, 28, 37-51, (in Korean with English abstract).
-
MacLachlan, C., and Coauthors, 2014: Global Seasonal Forecast System version 5 (GloSea5): A high-resolution seasonal forecast system. Q. J. R. Meteorol. Soc., 141, 1072-1084.
[https://doi.org/10.1002/qj.2396]

- Madec, G., 2008: NEMO ocean engine. Note du Pôle de modélisation No. 27, Institut Pierre-Simon Laplace (IPSL), 300 pp.
-
Megann, A., D. Storkey, Y. Aksenov, S. Alderson, D. Calvert, T. Graham, P. Hyder, J. Siddorn, and B. Sinha, 2014: GO 5.0: the joint NERC-Met Office NEMO global ocean model for use in coupled and forced applications. Geosci. Model Dev., 7, 1069-1092.
[https://doi.org/10.5194/gmd-7-1069-2014]

- Molteni, F., and Coauthors, 2011: The new ECMWF seasonal forecast system (system 4). ECMWF Tech. Memo. No. 656, 49 pp.
-
Nicholls, N., 1979: A possible method for predicting seasonal tropical cyclone activity in the Australian region. Mon. Wea. Rev., 107, 1221-1224.
[https://doi.org/10.1175/1520-0493(1979)107<1221:APMFPS>2.0.CO;2]

-
Pan, L. L., and Coauthors, 2015: Thunderstorms enhance tropospheric ozone by wrapping and shedding stratospheric air. Geophy. Res. Lett., 41, 7785-7790.
[https://doi.org/10.1002/2014GL061921]

- Pielke, R. A., Jr., and R. A. Pielke Sr., 1997: Hurricanes: Their Nature and Impacts on Society. Wiley, 279 pp.
-
Rae, J. G. L., H. T. Hewitt, A. B. Keen, J. K. Ridley, A. E. West, C. M. Harris, E. C. Hunke, and D. N. Walters, 2015: Development of Global Sea Ice 6.0 CICE configuration for the Met Office Global Coupled Model. Geosci. Model Dev. Discuss., 8, 2529-2554.
[https://doi.org/10.5194/gmdd-8-2529-2015]

-
Schreck, C. J., J. Molinari, and A. Aiyyer, 2012: A global view of equatorial waves and tropical cyclogenesis. Mon. Wea. Rev., 140, 774-788.
[https://doi.org/10.1175/MWR-D-11-00110.1]

-
Shaevitz, D. A., and Coauthors, 2014: Characteristics of tropical cyclones in high-resolution models in the present climate. J. Adv. Model. Earth Sy., 6, 1154-1172.
[https://doi.org/10.1002/2014MS000372]

- Southern, R. L., 1979: The global socio-economic impact of tropical cyclones. Aust. Meteor. Mag., 27, 175-195.
-
Strachan, J., P. L. Vidale, K. Hodges, M. Roberts, and M.-E. Demory, 2013: Investigating global tropical cyclone activity with a hierarchy of AGCMs: The role of model resolution. J. Climate, 26, 133-152.
[https://doi.org/10.1175/JCLI-D-12-00012.1]

- Valcke, S., R. Budich, M. Carter, E. Guilyardi, M.-A. Foujols, M. Lautenschlager, R. Redler, L. Steenman-Clark, and N. Wedi, 2006: The PRISM Software Framework and the OASIS Coupler. Proc. The 18 Annual BMRC Modelling Workshop, Melbourne [Available online at http://hdl.handle.net/11858/00-001M-0000-0028-52D2-5, ].
-
Vecchi, G. A., and G. Villarini, 2014: Next season’s hurricanes. Science, 343, 618-619.
[https://doi.org/10.1126/science.1247759]

-
Vecchi, G. A., and Coauthors, 2014: On the seasonal forecasting of regional tropical cyclone activity. J. Climate, 27, 7994-8016.
[https://doi.org/10.1175/JCLI-D-14-00158.1]

-
Villarini, G., and G. A. Vecchi, 2013: Multiseason lead forecast of the North Atlantic power dissipation index (PDI) and accumulated cyclone energy (ACE). J. Climate, 26, 3631-3643.
[https://doi.org/10.1175/JCLI-D-12-00448.1]

-
Vitart, F., M. R. Huddleston, M. Déqué, D. Peake, T. N. Palmer, T. N. Stockdale, M. K. Davey, S. Ineson, and A. Weisheimer, 2007: Dynamically-based seasonal forecasts of Atlantic tropical storm activity issued in June by EUROSIP. Geophys. Res. Lett., 34, L16815.
[https://doi.org/10.1029/2007GL030740]

-
Vitart, F., and A. W. Robertson, 2018: The Sub-seasonal to seasonal prediction project (S2S) and the prediction of extreme events. npj Clim. Atmos. Sci., 1, 3.
[https://doi.org/10.1038/s41612-018-0013-0]

-
Walters, D., and Coauthors, 2017: The Met Office Unified Model Global Atmosphere 6.0/6.1 and JULES Global Land 6.0/6.1 configurations. Geosci. Model Dev., 10, 1487-1520.
[https://doi.org/10.5194/gmd-2016-194-AC1]

-
Wang, H., and Coauthors, 2014: How well do global climate models simulate the variability of Atlantic tropical cyclones associated with ENSO? J. Climate, 27, 5673-5692.
[https://doi.org/10.1175/JCLI-D-13-00625.1]

-
Wang, Z., W. Li, M. S. Peng, X, Jiang, R. McTaggart-Cowan, and C. Davis, 2018: Predictive skill and predictability of North Atlantic tropical cyclogenesis in different synoptic flow regimes. J. Atmos. Sci., 75, 361-378.
[https://doi.org/10.1175/JAS-D-17-0094.1]

-
Wheeler, M., and G. N. Kiladis, 1999: Convectively coupled equatorial waves: Analysis of clouds and temperature in the wavenumber-frequency domain. J. Atmos. Sci., 56, 374-399.
[https://doi.org/10.1175/1520-0469(1999)056<0374:CCEWAO>2.0.CO;2]

-
Williams, K. D., and Coauthors, 2015: The Met Office Global Coupled model 2.0 (GC2) configuration. Geosci. Model Dev., 8, 1509-1524.
[https://doi.org/10.5194/gmd-8-1509-2015]

- Yamaguchi, M., F. Vitart, S. Maeda, and Y. Takaya, 2016: Were one-month global ensembles capable of predicting inactive TC activity in the western North Pacific basin during early 2016? Proc. 2016 Fall Meeting of Meteorological Society of Japan (In Japanese).
-
Zhang, G., and Z. Wang, 2019: North Atlantic Rossby wave breaking during the hurricane season: association with tropical and extratropical variability. J. Climate, 32, 3777-3801.
[https://doi.org/10.1175/JCLI-D-18-0299.1]

-
Zhang, G., Z. Wang, M. S. Peng, and G. Magnusdottir, 2017: Characteristics and impacts of extratropical Rossby wave breaking during the Atlantic hurricane season. J. Climate, 30, 2363-2379.
[https://doi.org/10.1175/JCLI-D-16-0425.1]

-
Zhao, M., I. M. Held, and G. A. Vecchi, 2010: Retrospective forecasts of the hurricane season using a global atmospheric model assuming persistence of SST anomalies. Mon. Wea. Rev., 138, 3858-3868.
[https://doi.org/10.1175/2010MWR3366.1]


