수도권 영역의 시간 후방 모드 WRF-FLEXPART 모의를 위한 입자 수에 따른 무작위 오차의 정량 분석
Abstract
Quantitative understanding of a random error that is associated with Lagrangian particle dispersion modeling is a prerequisite for backward-in-time mode simulations. This study aims to quantify the random error of the WRF-FLEXPART model and suggest an optimum number of the Lagrangian particles for backward-in-time simulations over the Seoul metropolitan area. A series of backward-in-time simulations of the WRF-FLEXPART model has conducted at two receptor points by changing the number of Lagrangian particles and the relative error, as a quantitative indicator of random error, is analyzed to determine the optimum number of the release particles. The results show that in the Seoul metropolitan area a 1-day Lagrangian transport contributes 80~90% in residence time and ~100% in atmospheric enhancement of carbon monoxide. The relative errors in both the residence time and the atmospheric concentration enhancement are larger when the particles release in the daytime than in the nighttime, and in the inland area than in the coastal area. The sensitivity simulations reveal that the relative errors decrease with increasing the number of Lagrangian particles. The use of small number of Lagrangian particles caused significant random errors, which is attributed to the random number sampling process. For the particle number of 6000, the relative error in the atmospheric concentration enhancement is estimated as -6% ± 10% with reduction of computational time to 21% ± 7% on average. This study emphasizes the importance of quantitative analyses of the random errors in interpreting backward-in-time simulations of the WRF-FLEXPART model and in determining the number of Lagrangian particles as well.
Keywords:
FLEXPART, Lagrangian particle dispersion model (LPDM), residence time, WRF1. 서 론
라그랑지안 입자 확산 모형(Lagrangian Particle Dispersion Model, LPDM)은 3차원 오일러리안(Eulerian) 모형과 함께 다양한 규모의 대기 중 기체/입자 물질의 수송과 확산 연구에 널리 활용되고 있다(예, Gerbig et al., 2003; Kort et al., 2008; Zhao et al., 2009; Brioude et al., 2011, 2013a; Jeong et al., 2012; Thompson and Stohl, 2014; Henne et al., 2016). LPDM은 오일러리안 모형에 내재된 수치 차분 오차(numerical discretization error)를 피할 수 있기 때문에 배출 강도가 높은 점원 배출원에 의한 대기 오염 물질의 대기 중 확산 연구에 유용하다(예, Zannetti, 1990; Stohl et al., 1998; Brioude et al., 2013a). 특히, 복잡지형 지역에서의 정확한 대기 확산의 계산을 위해서는 격자 규모 평활(smoothing)이 발생하는 오일러리안 모형에 비해 라그랑지안 대기 확산 모형을 적용하는 것이 유리하다(Pielke and Uliasz, 1998). 시간 후방 모드(backward-in-time mode) LPDM은 특정 지점으로부터 시간을 거슬러 공기 궤적을 추적하는 방식으로, 특정 수용지 지점의 배출원-수용지 관계(source-receptor relation)를 파악하기 위해 널리 활용되고 있다(예, Zhao et al., 2009; Brioude et al., 2011, 2013a; Jeong et al., 2012; Wen et al., 2012).
LPDM은 오일러리안 모형에 의해 생성된 입력 기상장의 불확실성과 함께 LPDM 모형에 내재된 다양한 불확실성 요소를 포함한다. Gerbig et al. (2003)은 LPDM 모형에 내재된 불확실성 요소로 난류 오차(eddy error), 수송 오차(transport error), 집합 오차(aggregation error), 그리고 해양 오차(ocean error)를 제시하였으며, 특히 라그랑지안 입자 수에 따른 오차를 무작위 오차(random error)로 구분하였다. 수송 오차는 수평 수송 오차와 대기 경계층 내의 연직 수송 오차로 세분된다(Lin and Gerbig, 2005). 이 외에도 시간 후방 모드 LPDM을 이용하여 지표 배출량의 기여 농도를 분석하는 연구에서는 배출량 오차와 배경 농도 오차가 있다(예, Zhao et al., 2009).
다양한 오차 요소 중에서 무작위 오차는 충분히 많은 라그랑지안 입자 수를 적용하여 줄일 수 있다. 하지만 라그랑지안 입자 수의 증가는 많은 계산 시간을 요구하므로 적절한 입자 수의 선택이 필요하다. 최적의 라그랑지안 입자 수의 선택과 이에 따른 불확실성의 정량적 해석을 위한 다양한 연구가 수행되었다(예, Gerbig et al., 2003; Folini et al., 2008; Zhao et al., 2009; Jeong et al., 2012; Wen et al., 2012; Ding et al., 2013). Gerbig et al. (2003)은 STILT (Stochastic Time-Inverted Lagrangian Transport) 모형을 이용한 이산화탄소(CO2) 농도 모의를 위해 50-1000 범위의 라그랑지안 입자 수를 적용하여 무작위 오차를 분석하였다. 그 결과 라그랑지안 입자 수 100을 선택하였을 때 입자 수 1000을 이용한 모의 결과에 비해 ~13%의 농도 차이를 나타냈다. Zhao et al. (2009)와 Jeong et al. (2012)은 미국의 연간 메탄(CH4) 배출량과 계절 변동을 검증하기 위해 STILT 모형을 이용하였으며, 무작위 오차를 정량적으로 파악하기 위해 Gerbig et al. (2003)에서 제시한 기준을 따라 수치 실험을 수행하였다. 이들 연구에서는 입자 수 100의 모의 농도는 기준 실험에 비해 약 5%의 차이를 보였다. Wen et al. (2012)은 STILT 모형을 이용하여 미국 오대호 연안지역의 질소산화물(NOx)과 오존(O3)의 화학 변환 과정이 고려된 배출량 검증 연구를 수행하였으며, 라그랑지안 입자 수를 10에서 3000까지 8 종류를 선택하여 모의 농도의 불확실성을 추정하였다. 이전 연구들에서 기준 라그랑지안 입자 수로 사용된 1000보다 큰 3000을 기준 값으로 적용하였으며, 입자 수 1000의 모의 결과는 5% 이내의 농도 차이를 보였다. 이 연구에서 라그랑지안 입자 수의 증가는 무작위 오차의 감소로 나타남을 보였다. Ding et al. (2013)은 STILT 모형을 이용하여 기준 입자 수를 3000보다 훨씬 큰 20000을 선택하여 모의 농도의 불확실성을 추정하였다. 라그랑지안 입자 수 3000과 20000으로 모의된 농도 차이는 1.1%로 산정되었으며, 이를 통해 특정 기준 값 이상의 입자 수를 적용할 경우 모의 농도의 불확실성은 일정 수준으로 수렴됨을 보였다. 한편, Folini et al. (2008)은 FLEXPART (FLEXible PARTicle dispersion model) 모형을 이용하여 스위스 융프라우요크(jungfraujoch)의 복잡 지형 지역을 대상으로 대기 확산 모델링을 수행하였으며, 안정적인 체류 시간(residence time)과 농도의 계산은 라그랑지안 입자 수 6250 이상의 값을 필요로 하였다.
LPDM의 무작위 오차는 적용한 모형과 연구 대상지역의 국지 기상장의 특징에 따라 달라진다. 기존 연구들은 라그랑지안 입자 수에 따른 민감도 실험을 통해 모의 농도의 무작위 오차를 단순히 제시하고 있지만 복잡한 기상 조건하에서 나타나는 무작위 오차의 특성 분석은 제시하지 않았다. 특정 연구 대상 지역에서 LPDM의 무작위 오차 특성에 대한 정량적 이해는 모의 결과의 정량적 이해를 위해 필수적인 요소이다. 앞서 제시한 바와 같이 국외 연구들은 LPDM 모형의 적용을 위해 특정 지역에서의 무작위 오차에 대한 정량적 평가 연구를 다수 수행하였으나, 이에 대한 국내 연구는 찾아보기 어렵다. 본 연구에서는 중규모 기상 모형 WRF (Weather Research and Forecasting)와 결합된 FLEXPART 모형(WRF-FLEXPART)을 이용하여 수도권 지역의 복잡한 기상 조건에서 나타나는 무작위 오차의 정량적 특성을 분석하고, 시간 후방 모드의 WRF-FLEXPART 확산 모델링을 위한 최적 입자 수를 제시하고자 한다. 이를 위해 수도권 영역 내에 위치한 대표 수용지를 선정하고, 이들 지점을 중심으로 주간과 야간의 입자 확산 특성을 분석하였다. 본 논문의 나머지 부분은 다음과 같이 구성되어 있다. 제 2 절에서는 WRF-FLEXPART 모형에 대해 간략히 소개하고, 무작위 오차의 정량 분석을 위한 라그랑지안 입자 수에 따른 민감도 실험 설계를 제시한다. 제 3 절에서는 WRF 모형의 모의 기상장 검증, 민감도 실험에서 모의된 체류 시간과 기여 농도의 특성, 그리고 라그랑지안 입자의 거동과 주/야간, 수용지 위치, 배출량 공간 분포에 따른 무작위 오차의 상대 오차 특성을 분석한다. 또한, 민감도 실험에서 나타나는 상대 오차의 원인 분석을 위해 라그랑지안 입자의 거동 특성을 난수 생성 특성과 관련하여 분석하였다. 제 4 절에는 본 연구의 요약과 결론을 제시하였다.
2. 연구 방법
2.1 라그랑지안 입자 확산 모형: WRF-FLEXPART
본 연구에서는 LPDM인 FLEXPART와 중규모 기상 모형 WRF가 연동되도록 개조된 WRF-FLEXPART Version 3.1 (Fast and Easter, 2006; Brioude et al., 2013b)를 이용하였다. 3차원 평균과 난류 기상장을 얻기 위해 사용된 WRF (Version 3.6.1) 모형은 미국 국립기상연구소 NCAR (National Center for Atmospheric Research)에서 개발/배포되고 있으며, 지배 방정식계는 σ 연직 좌표계를 채택하며 3차원 압축 비정역학(fully compressible and non-hydrostatic) 대기를 다룬다. 현실적인 기상 모의를 위해 복사 전달 과정, 난류 혼합 과정, 구름 물리 과정, 대기-지표 상호 작용 등의 다양한 물리 과정의 모수화를 포함하고 있으며, 다양한 규모의 기상 현상에 대한 연구와 날씨 예측에 널리 활용되고 있다(Skamarock et al., 2008).
FLEXPART는 WRF 모형으로 모의된 입력 기상장을 이용하여 대기 중으로 배출되는 기체상/입자상 물질을 라그랑지안 입자로 가정하여 대기 중 수송과 확산 과정을 모의한다. 3차원 공간에서 바람에 의해 이동하는 개별 라그랑지안 입자의 위치는 다음과 같이 계산된다.
| (1) |
여기서 X는 입자의 위치 벡터, t는 시간, ∆t는 경과 시간, v(= v + v')는 바람 벡터로, 평균 바람(mean wind) (v)과 난류 바람(turbulent wind) (v')의 합으로 나타내어 진다. v는 WRF 모형의 격자에서 계산된 바람을 사용하며, v'은 마코프 과정(Markov process)을 가정하는 Langevin 방정식을 통해 다음과 같이 계산된다(Thompson, 1971; Hall, 1975; Reid, 1979; Legg and Raupach, 1982; Thompson, 1987).
| (2) |
식(2)는 dt 동안 입자의 속도 변화를 표현하는 식으로, ai(x, v', t)는 이동항, bij(x, v', t)는 확산항을 의미한다. dWj는 시간과 무관한 Wiener process (Legg and Raupach, 1982)의 평균이 0이고 표준편차가 dt인 확률밀도함수(probability density function)이다. WRF-FLEXPART는 가우시안 난류(Gaussian turbulence)를 가정하여 난류에 의한 수송을 표현한다. 가우시안 난류는 엄밀히 안정이나 중립 대기 안정도 조건에만 적용이 가능하나, 대류 경계층에서도 오차가 작다고 가정하여 식(2)의 Langevin 방정식을 다음과 같이 사용한다(Stohl et al., 2005).
| (3) |
여기서, σi는 난류 성분의 표준 편차, τLi는 라그랑지안 시간 규모(Lagrangian timescale), ρ는 공기의 밀도를 의미한다. 우변의 세번째와 네번째 항은 각각 연직 방향 난류 속도의 표준 편차가 급격히 변하는 대기 경계층과 지표 부근에서 입자의 비정상적 축적을 완화하기 위한 이동 보정항(drift correction term)(McNider et al., 1988)과 고도에 따른 공기 밀도의 감소를 고려하기 위한 밀도 보정항(density correction term) (Stohl and Thomson, 1999)을 나타낸다. 모형에서 식(3)은 라그랑지안 시간 규모에 따라 다음과 같이 사용된다.
| (4) |
| (5) |
식(4)의 γi = exp(-∆t/τLi)는 바람의 자기상관계수(autocorrelation coefficient)이며, ζ는 평균이 0이고 1의 표준편차를 가지는 난수(random number)이다. 식(5)는 ∆t/ τLi < 0.5인 조건에서 식(4)의 1차 근사식이다. 식(1)~(5)를 통해 매 시각 라그랑지안 입자의 위치가 결정된다.
2.2 시간 후방 모드 WRF-FLEXPART
WRF-FLEXPART는 배출원으로부터 대기 중으로 배출되는 물질을 시간의 흐름에 따라 라그랑지안 입자들의 궤적을 모의할 수 있다. 뿐만 아니라, 수용지에서 측정된 공기괴의 궤적을 시간을 거슬러 역추적할 수 있으며, 이를 시간 후방 모드라 한다. 수용지에서 배출된 라그랑지안 입자의 시간 후방 적분을 통해 계산된 체류 시간과 지표면 배출 강도의 곱으로 지표배출량에 의한 기여 농도를 다음과 같이 산출할 수 있다(Seibert and Frank, 2004).
| (6) |
여기서 ∆C (ppm)는 수용지 위치(xr, yr)와 시간(tr)의 지표 배출량에 의한 기여 농도를 나타내며, Mair은 건조 공기의 분자량(= 28.97 g mole-1), h는 라그랑지안 입자의 혼합 높이(m), T는 공기 밀도로 나누어진 체류 시간(s m3 kg-1), n은 적분 시간, E는 지표면 배출 플럭스(μg m-2 s-1)를 나타낸다. 배출 플럭스와 체류시간은 시간별 자료이며, 라그랑지안 입자의 혼합 높이는 200m로 설정하였다. 지표 배출 플럭스는 라그랑지안 입자 수에 따른 무작위 오차의 분석을 위해일평균 플럭스를 적용하였다. 참고로, 수용지에서 측정되는 대기 농도와 라그랑지안 입자 확산 모델링을 통해 계산된 모의 농도를 직접 비교하기 위해서는 지표 배출량에 의한 기여 농도 뿐만 아니라 배경 농도와 수송 과정 중의 화학 반응과 건/습식 침적 과정을 함께 고려하여야 한다(예, Brioude et al., 2011, 2013a; Wen et al., 2012).
2.3 모의 영역과 실험 설계
Figure 1a는 WR F 모형의 기상장 모의 영역을 나타낸다. 종관 규모의 대기 운동 뿐만 아니라 한반도 주변의 상세 규모 대기 운동을 현실적으로 모의할 수 있도록 동아시아 지역을 넓게 포함하는 최외곽 도메인(D01)과 한반도 주변 지역(D02)과 한반도 상세 지역(D03)을 둥지 격자로 구성하였다. 각 도메인의 수평격자 해상도는 32.4 km, 10.8 km, 3.6 km이며, 연직 격자는 55층으로 동일하게 구성하였으며, 모형의 상단은 50 hPa (~20 km)로 설정하여 대류권과 하부 성층권을 포함하도록 하였다. 최외곽 도메인의 기상장 초기/경계 조건은 NCEP (National Center for Environment Prediction)에서 제공하는 재분석 자료(Final operational global analysis: FNL)를 사용하였으며, 이 자료는 6시간 시간 해상도와 1o × 1o의 수평 격자 해상도를 가진다. 내부 도메인(D02와 D03)들은 단방향 둥지 격자방안(one-way nesting approach)를 따라 상위 수준 도메인의 예측 결과를 초기/경계 조건으로 하여 순차적으로 계산하였다. Table 1은 WRF 모형의 세부 격자구성과 선택한 물리 과정 옵션을 보여준다. 이를 바탕으로 WRF 모형은 2010년 4월 1일 0000UTC부터 4월 30일 0000 UTC까지 29일간의 기상장 적분을 수행하였다.
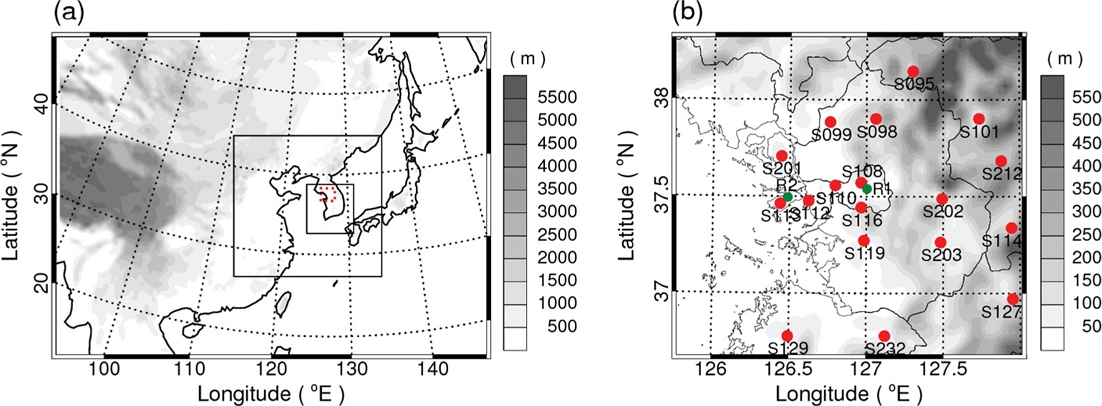
(a) Domains of the WRF-FLEXPART model and (b) the analysis area of the Seoul metropolitan area. Solid circles in (b) denote the surface meteorological measurement sites (red) and the receptor locations (green). Shaded contours denote topographic heights.
WRF-FLEXPART 모의는 한반도 상세 도메인(D03)을 대상으로 수행하였다. 수도권 영역 내에 위치한 서울 도시 대기 측정소(R1) (127.004oE, 37.540oN)와 인천 도시 대기 측정소(R2) (126.488oE, 37.495oN)의 두 곳을 시간 후방 라그랑지안 입자 확산 모델링을 위한 수용지로 선정하였다(Fig. 1b). 두 지점은 비슷한 위도에 위치하나, 각각 도심과 해안에 위치하여 국지 순환과 대기 경계층의 발달 특성이 뚜렷이 구분될 뿐만 아니라 지표 배출량의 공간 분포 특성도 잘 구분된다. 따라서 다양한 기상 조건에서의 라그랑지안 입자 수에 따른 체류 시간과 기여 농도의 불확실성을 평가하기 용이하여 선정하였다. 각 수용지에서 라그랑지안 입자는 지표에 위치한 200 × 200 × 200 m3 영역에서 10분간 시/공간적으로 균일하게 배출되도록 설정하였으며, 시간 후방 모드로 72시간 동안 배출된 입자들은 각 입자의 역 궤적을 계산하였다. 라그랑지안 입자들의 위치를 이용하여 체류 시간을 매 시간 지상으로부터 5 연직층(200, 500, 1000, 2000, 20000 m)에서 각각 계산하였다. WRF-FLEXPART 모형의 모의 기간은 4월 4일 0000UTC부터 4월 30일 2100UTC까지 3시간 간격으로 모의하였으며, 강수가 없었던 15일을 분석에 사용하였다.
라그랑지안 입자 수에 따른 무작위 오차의 정량적 평가와 최적 입자 수 선정을 위해 입자 수 500, 1000, 2500, 4000, 5000, 6000, 10000, 25000, 50000의 9가 지 민감도 실험(N500, N1000, N2500, N4000, N5000, N6000, N10000, N25000, N50000)을 수행하였다. WRF 모형에서 기본으로 산출하는 1시간 간격의 순간 바람장(instantaneous wind field)을 시간 내삽하여 라그랑지안 입자 확산을 계산할 경우 복잡 지형 지역에서 입자 확산의 계산 오차를 야기할 수 있으므로 이를 최소화하기 위해 질량 가중된 시간 평균 바람장(mass-weighted time-averaged wind field)을 적용하였다(Brioude et al., 2012). 시간 후방 모드로 모의된 체류 시간을 이용하여 수도권 지역 내에 위치한 두 수용지 지점의 일산화탄소(CO) 지표 배출량에 의한 기여 농도를 분석하였다. 인위적 배출량 자료는 MICS-Asia 2010 (Carmichael et al., 2002) (0.25o × 0.25o)을 이용하였으며, 이를 모형 격자 해상도인 3.6 km× 3.6 km로 공간 상세화 후 적용하였다. Figure 2는 수도권 영역의 인위적 CO 배출량과 두 수용지로부터 거리에 따른 배출량의 공간 분포를 보여준다. 격자 배출량은 남한 전체 배출량으로 나눈 값을 나타낸다. 인위적 CO 배출량의 점원, 선원, 면원 오염원의 배출 비율은 12%, 77%, 12%를 차지하며, 도시 지역에서는 주로 차량 엔진 내에서 화석 연료의 불완전 연소에 의해 발생한다(NIER, 2012). 따라서 교통과 인구가 밀집 되어있는 R1 지점 부근에서 배출량이 높고 약 10~20 km 떨어진 영역에 최대 배출 강도가 나타나며, 해안에 위치한 R2 지점에서는 이보다 먼 50~60 km 영역에서 최대 배출량을 보인다.
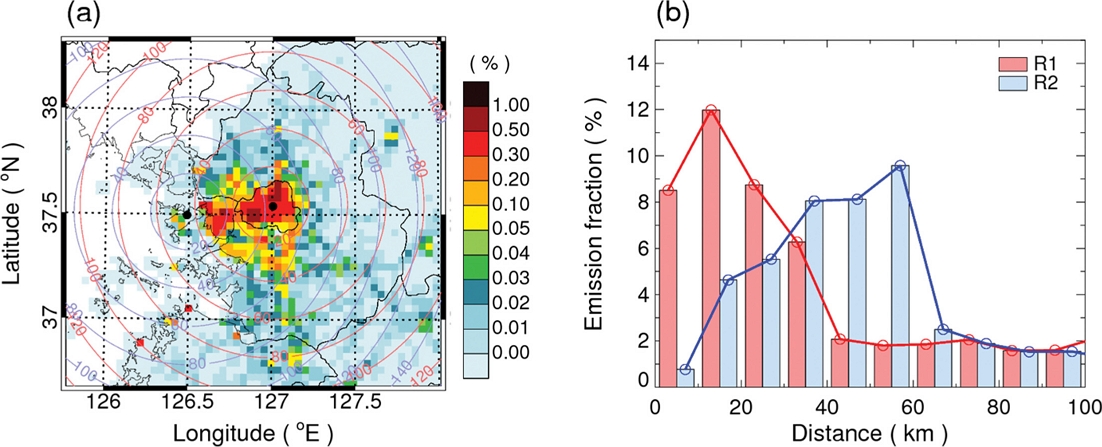
(a) Spatial distribution of daily mean carbon monoxide (CO) emissions and (b) the emissions as a function of a distance from the receptor locations of R1 and R2. The CO emissions are presented as fractions normalized by total emission amount in South Korea. Black dots denote the two receptor points of R1 and R2 and solid circles denote distances from the receptor points with an interval of 20 km.
2.4 기상장 검증과 무작위 오차 평가
라그랑지안 입자 확산 모델링의 입력 기상장의 신뢰도를 평가하기 위해 기상청 정규기상관측소에서 측정된 기상 자료를 이용하여 통계 검증을 수행하였다. 평균(mean, M), 표준 편차(standard deviation, σ), 평균 제곱근 오차(root mean square error, RMSE), 피어슨 상관 계수(Pearson’s correlation coefficient, R)를 사용하였으며 다음과 같이 정의된다.
| (9) |
| (10) |
여기서, Pi와 Oi는 각각 모의 값과 관측 값을 나타내며, n은 자료 수를 나타낸다. RMSE는 모형과 관측의 평균적인 차이를 의미하며, 두 독립 자료의 일치도가 높을수록 0에 가까운 값을 나타낸다. R은 두 변수간 선형 관계의 강도를 나타내는 측도로, 1에 가까울수록 양(positive)의 선형 관계를, -1에 가까울수록 음(negative)의 선형 관계를 나타낸다. 0에 가까운 값은 두 변수의 선형 상관성이 낮음을 의미한다.
라그랑지안 입자 수에 따른 모의 결과의 불확실성을 정량적으로 평가하기 위해 상대 오차(relative error: RE)를 다음과 같이 정의하였다(Folini et al., 2008).
| (11) |
여기서, Xi와 XRef는 라그랑지안 입자 수에 따른 민감도 실험과 기준 실험(N50000)에서 계산된 값을 의미하며, 체류 시간과 기여 농도에 대한 상대 오차를 분석하였다. 각 수용지 지점에서 3시간 간격으로 계산한 체류 시간과 기여 농도의 상대 오차의 통계 분포를 이용하여 무작위 오차의 정량적 분석을 수행하였다. 상대 오차의 평균은 모의되는 체류 시간이나 기여 농도의 계통 오차(systematic shift)를 의미하고 표준 편차는 불확실성(uncertainty)을 나타낸다.
3. 결 과
3.1 기상장 검증
수용지 주변의 모의 지상 기상장 검증을 위해 각 수용지에서 가까운 서울과 인천 종관기상관측소(Automatic Synoptic Observation Station: ASOS)의 측정 기온, 풍향, 풍속에 대해 통계 검증을 수행하였다(Table 2). 모의 기온은 두 지점에서 모두 관측의 일변화 경향을 대체로 잘 모의하였으며, 0.9 이상의 높은 상관 계수를 보였다. 풍향도 측정과 높은 선형 상관성을 보여(R > 0.8) 해륙풍 국지 순환이 주요한 대상 지역의 특성을 잘 반영하였다. 모의 풍속은 서울과 인천 지점에서 각각 0.8m s-1와 0.3m s-1의 약한 과대 모의 경향을 보였으며, 상관 계수도 0.66과 0.75로 풍향에 비해 다소 낮게 나타났다.

Statistical validation of the WRF model simulation against surface meteorological measurements near the receptor sites during the period of April 2010.
수도권 분석 대상 영역의 모의 기상장을 ASOS와 레윈존데(rawinsonde) 측정 자료를 이용하여 분석하였다. Figure 3은 2010년 4월 5일의 지상 10m 모의 바람장의 일 변화를 측정 바람과 비교하고 있다. 종관강제력이 약한 날로 국지 순환인 해륙풍과 산곡풍이 뚜렷하게 모의되고 있다. 새벽 시간(0300 LST)에는 약한 육풍이 나타나고 있으며 경기만 지역은 북서풍이 0900 LST까지 지속되고 있다. 1500 LST에는 해풍이 강하게 발달하여 내륙 깊이 침투하고 있는 모습을 보이며 2100 LST까지 서풍이 지속되고 있다. 모의 풍속은 측정 풍속에 비해 다소 강하게 모의하는 특징을 볼 수 있으나, 측정된 국지 바람을 대체로 잘 모의하고 있다. Table 3은 백령도와 오산 고층기상관측소 지점의 모의 기상장과 관측 기상장의 통계 검증 결과를 보여준다. 라그랑지안 입자 확산에 중요한 대기 고도를 고려하여 하층 표준 등압면(1000, 850, 700 hPa)에서 측정된 온위, 풍향, 풍속을 모의 기상장과 비교하였다. 온위는 관측과 좋은 일치도를 보여주고 있으며, 풍속은 지상과 마찬가지로 약한 과대 모의 특성을 보여준다. 도심 지역 R1에서의 대기 경계층 높이는 야간에 약 400m에서 주간에 약 1200 m까지 뚜렷한 일 변화 경향이 모의되었으며, 해안 지역 R2에서는 주간과 야간에 큰 변화없이 300~400 m로 유지되는 해양 경계층의 특징을 모의하였다(not shown).
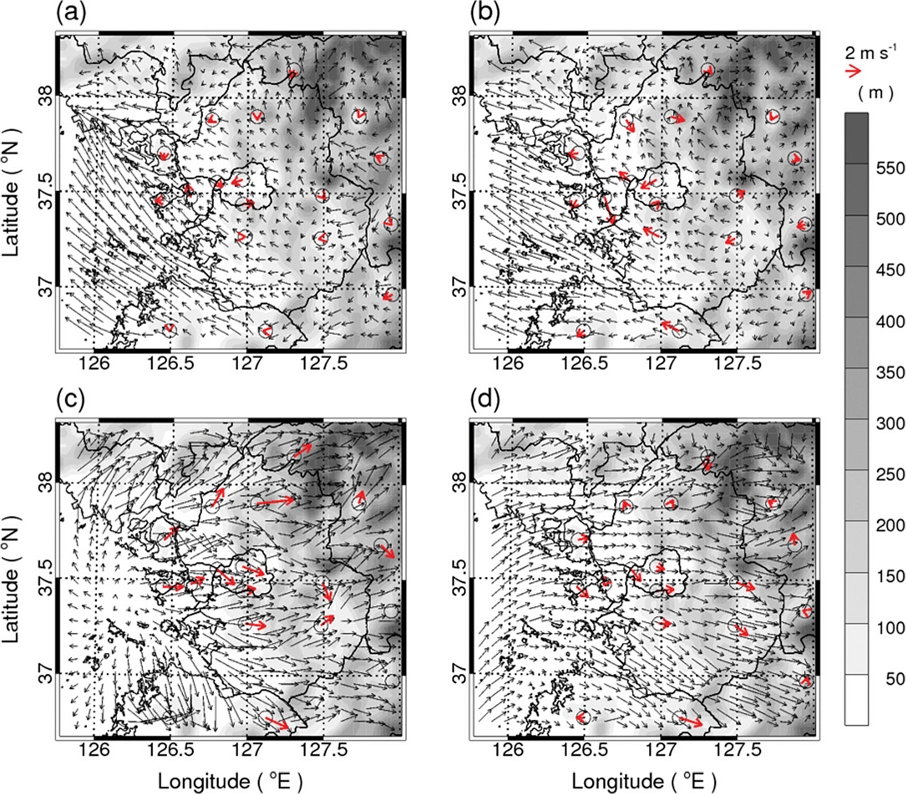
Spatial distributions of the simulated and observed 10-m wind fields over the Seoul metropolitan area on a clear day of 5 April 2010: (a) 0300 LST, (b) 0900 LST, (c) 1500 LST, (d) 1800 LST. Red arrows indicate the observed 10-m winds at 18 surface meteorological measurement sites. Shaded contours denote topography with an interval of 50 m.
3.2 라그랑지안 체류 시간
모의된 역 궤적 체류 시간을 이용하여 먼저 R1과 R2 수용지 지점의 공기 유입 특성을 분석하였다. Figure 4는 기준 실험(N50000)에서 계산된 각 수용지에서의 주간과 야간의 24시간 역 궤적 체류 시간의 누적 공간 분포를 나타낸다. 라그랑지안 입자 배출 시간에 따라 1200, 1500, 1800 LST를 주간으로, 0000, 0300, 0600 LST를 야간으로 구분하였다. R1과 R2 지점 모두 체류 시간은 수용지 근처에서 높은 값을 보이며, 대체로 서풍 계열의 의한 기류의 유입이 우세한 것으로 분석된다. R1 지점은 주간에 비해 야간에 수용지 부근에 높은 체류 시간을 보이는데, 이는 야간에 약한 풍속과 난류 혼합에 의해 기류가 주간에 비해 상대적으로 정체됨을 의미한다. 해안에 위치한 R2 지점은 R1 지점에 비해 주간과 야간의 차이가 상대적으로 작은 특징을 보인다. 24시간 누적 체류 시간은 72시간 누적 체류 시간에 비해 평균 80~85%를 차지하며, 야간이 주간에 비해 약 5% 높은 값을 보였다.
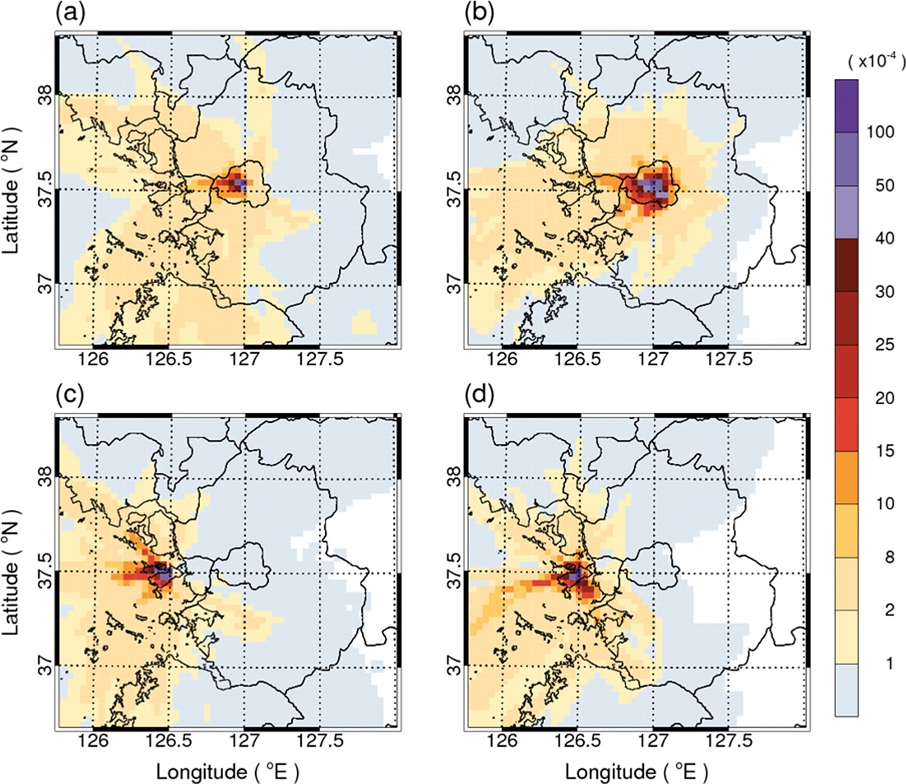
Spatial distributions of simulated residence time (influence function) at the receptor sites. (a) Daytime (1200, 1500, 1800 LST) in R1, (b) Nighttime (0000, 0300, 0600 LST) in R1, (c) Daytime in R2, (d) Nighttime in R2. The residence time values (in fraction) are cumulated for 15 clear days, and then normalized by a total residence time of the model domain 3. The reference simulation of N50000 was used.
라그랑지안 입자가 수용지에서 배출되어 모의 영역(D03) 내에 머무는 시간을 파악하기 위해 배출 입자수의 63.3%가 모의 영역을 빠져나가는 시각(e-folding time)을 이탈 시간 규모(escape time scale)로 정의하고, 각 라그랑지안 궤적에서 이를 계산하였다. Figure 5는 R1과 R2 지점에서 계산된 이탈 시간 규모의 빈도를 주간과 야간으로 구분하여 보여준다. 풍속이 강한 경우 수용지에서 배출된 입자는 빠르게 모의 영역 밖으로 빠져나가게 되며, 이 때 이탈 시간 규모는 짧아진다. R1과 R2 지점에서 이탈 시간 규모는 국지 기상조건에 따라 6시간 이내에서 72시간까지 다양한 분포를 보여주고 있다. 이탈 시간 규모는 두 지점 모두 주간에 약 50%는 24시간 이내에 존재하며, 48시간 이내에는 80% 이상이 포함된다. 야간의 경우에는 주간에 비해 모의 영역 내에 머무는 시간이 다소 높은 특징을 보인다. 기상 조건에 따라 48시간 이상 기류가 모의 영역에 오랫동안 머무는 경우도 10~30% 차지하고 있다.
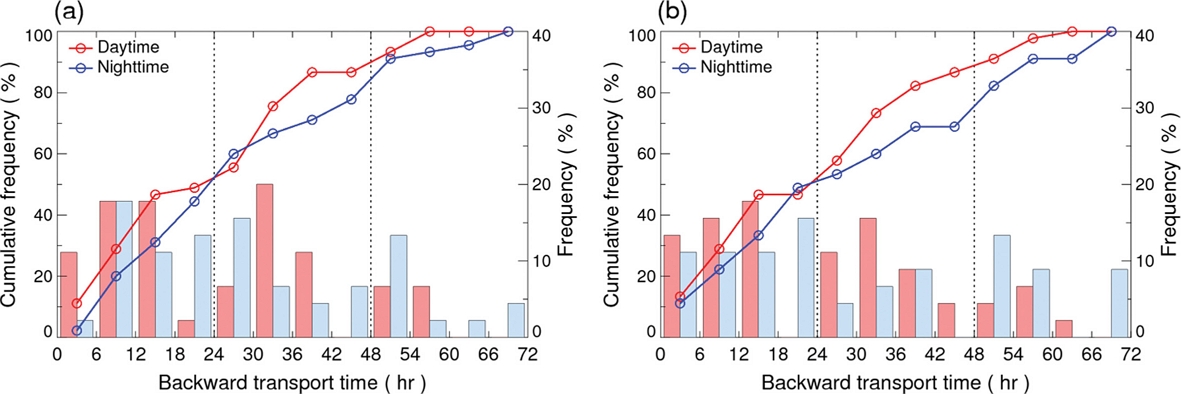
Cumulative frequency of the escape time scale at the receptor site of (a) R1 and (b) R2. The daytime includes the particle releases at 1200, 1500, 1800 LST and the nighttime includes the particle releases at 0000, 0300, 0600 LST. Filled boxes denote frequencies at every 6-hr intervals. The residence time scale is defined by a backward transport time at which total air mass released at a receptor site reduced to an e-folding scale. The reference simulation of N50000 is used.
3.3 라그랑지안 지표 배출량 기여 농도
모의된 역 궤적 체류 시간과 지표면 배출 플럭스를 결합하여 수용지별 주간과 야간의 기여 농도를 계산하였다. Figure 6은 R1과 R2 지점에서 계산된 CO에 대한 24시간 누적된 지표면 인위적 배출량 기여 농도의 공간 분포를 보여준다. R1 지점은 수용지 근처에서 높은 체류 시간과 배출 강도를 보이므로 수용지에서 가까운 지역의 배출량 기여 농도가 높게 나타난다. 주간에는 야간에 비해 상대적으로 넓은 지역의 지표면 배출 영향을 받으며 강한 분산에 의해 격자에서의 기여 농도 값은 상대적으로 낮은 특징을 보인다. 이 지점의 측정 농도는 주간과 야간 모두 대체로 서울 지역의 지표면 배출에 의해 영향을 받는 것을 볼 수 있다. 반면, R2 지점은 수용지 부근의 지표면 배출 영향 뿐만 아니라 인천과 경기 내륙 지역으로도 기여 농도가 높은 지역이 넓게 나타난다. 내륙 지역의 배출량에 의한 기여 농도는 주간보다 야간에 상대적으로 높게 나타나는 특징을 보인다. 72시간 누적 기여 농도에 비해 계산된 24시간 누적 기여 농도는 R2 지점의 주간(84%)을 제외하고는 96% 이상의 높은 값을 보였다. 이는 두 수용지 지점의 지표 배출량에 의한 기여 농도는 대부분 수도권 분석 영역에 포함된 배출량에 기인하는 것을 의미한다.
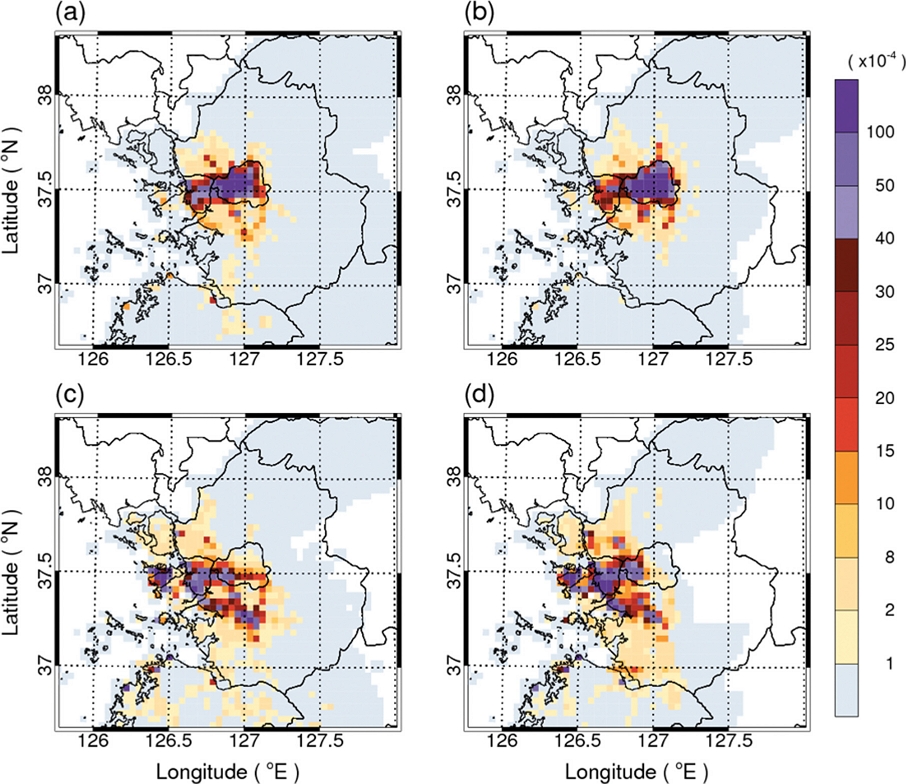
Spatial distributions of simulated atmospheric CO enhancement (∆C) at the receptor sites of R1 and R2. (a) Daytime (1200, 1500, 1800 LST) at R1, (b) Nighttime (0000, 0300, 0600 LST) at R1, (c) Daytime at R2, (d) Nighttime at R2. The atmospheric concentration enhancement values (in fraction) are cumulated for 15 clear days, and then normalized by a total concentration enhancement by the surface emissions over the whole South Korea region. The reference simulation of N50000 is used.
Figure 7은 수용지로부터 후방 분산 시간에 따른 CO 기여 농도의 누적 분포를 나타낸다. R1 지점은 평균 3시간 이내의 수송 거리에 포함되어 있는 배출량에 의해 87% 농도 기여가 나타나며 평균 6시간 이내에서 약 90% 이상의 기여가 나타난다. 야간의 기여 농도는 주간에 비해 후방 분산 시간에 따라 높아지는 특징을 나타내며, 이는 야간의 낮은 풍속과 난류 강도에 기인한 영향으로 판단된다. R2 지점에서도 R1 지점과 유사하게 짧은 후방 분산 시간에 높은 기여 농도 값이 나타나는 특징이 나타나지만 최대 농도에 도달하는 후방 분산 시간은 상대적으로 길다. 이는 R1 지점이 R2 지점에 비해 수용지 부근에서 높은 지표면 배출 플럭스를 가진 배출 영역이 분포하는 특징에 기인한다. 수용지 지점의 기여 농도에서 나타나는 이러한 특징들은 국지 기상장에 의한 분산과 배출원 특성에 의해 결정되며, 시간 후방 모드의 라그랑지안 입자 확산 모의를 통해 기류와 농도의 ‘발자국(footprint)’ 분석을 이용하여 효율적으로 분석할 수 있음을 보여준다.
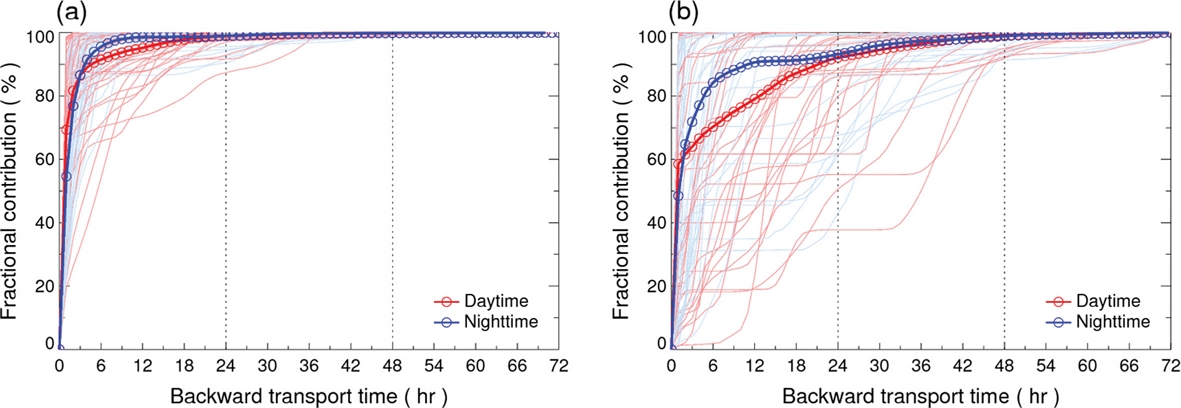
Fractional atmospheric CO enhancement (∆C) as a function of backward transport time at the receptor sites of (a) R1 and (b) R2. Daytime release includes 1200, 1500, and 1800 LST and nighttime release includes 0000, 0300, and 0600 LST. A fractional ∆C is defined by the percentage ratio of cumulative ∆C at each backward transport time to the total 72-hr cumulative ∆C. Thin lines in (a) and (b) denote fractional ∆C from the daytime and nighttime Lagrangian trajectories calculated at the receptor sites of R1 and R2 and thick lines denote the mean values for daytime and nighttime releases, respectively. The reference simulation of N50000 is used.
3.4 체류 시간과 기여 농도의 불확실성
Figure 8은 라그랑지안 입자 수에 따라 계산된 24시간 누적 체류 시간의 연직 분포를 보여준다. 연직누적 체류 시간은 대부분 2000m 이내의 고도에 분포하며, R1 지점은 R2 지점에 비해 약간 낮은 값을 보이나 대체로 두 지점에서 비슷한 특징을 보인다. 두지점에서 주간의 체류 시간이 야간에 비해 낮은 값을 보인다. 주간에 배출된 입자들은 잘 발달된 대기 경계층에서 연직 분산이 강하게 일어나고 이들 대기 경계층 상부로 수송된 입자들은 상대적으로 강한 풍속에 의해 모의 영역 외부로 빠져나가 풍속과 연직 확산이 상대적으로 낮은 야간 시간에 배출된 입자에 비해 연직 누적 체류 시간이 낮게 나타난다. 대기 경계층 내부의 난류 강도와 평균 바람의 분포에 따라 체류 시간의 연직 분포가 비균질적으로 변화한다. 서울도심에 위치한 R1 지점은 인천 해안 지역에 위치한 R2 지점에 비해 대기 경계층이 높게 발달하고, 이에 따라 대기 경계층 상부(하부) 지역의 체류 시간은 R1 지점이 R2 지점에 비해 높게(낮게) 나타나는 특징을 보인다. 연직 누적 체류 시간의 라그랑지안 입자 수에 따른 차이는 두 수용지에서 주간과 야간 모두 평균 2% 이내의 작은 차이를 보였다. 이는 라그랑지안 입자의 공간 분포는 지역에 따라 평균 바람과 난류강도에 따라 비균질적으로 분포하지만 모의 영역 내에 존재하는 라그랑지안 입자들의 총 질량은 큰 차이를 보이지 않음을 의미한다. 한편, 최하층 격자(0~200 m)의 체류 시간은 라그랑지안 입자 수가 작을수록 작은 값을 나타내며, 반면 입자 수가 증가함에 따라 모의 실험 간의 차이는 점차 작아지는 특징을 보여준다.
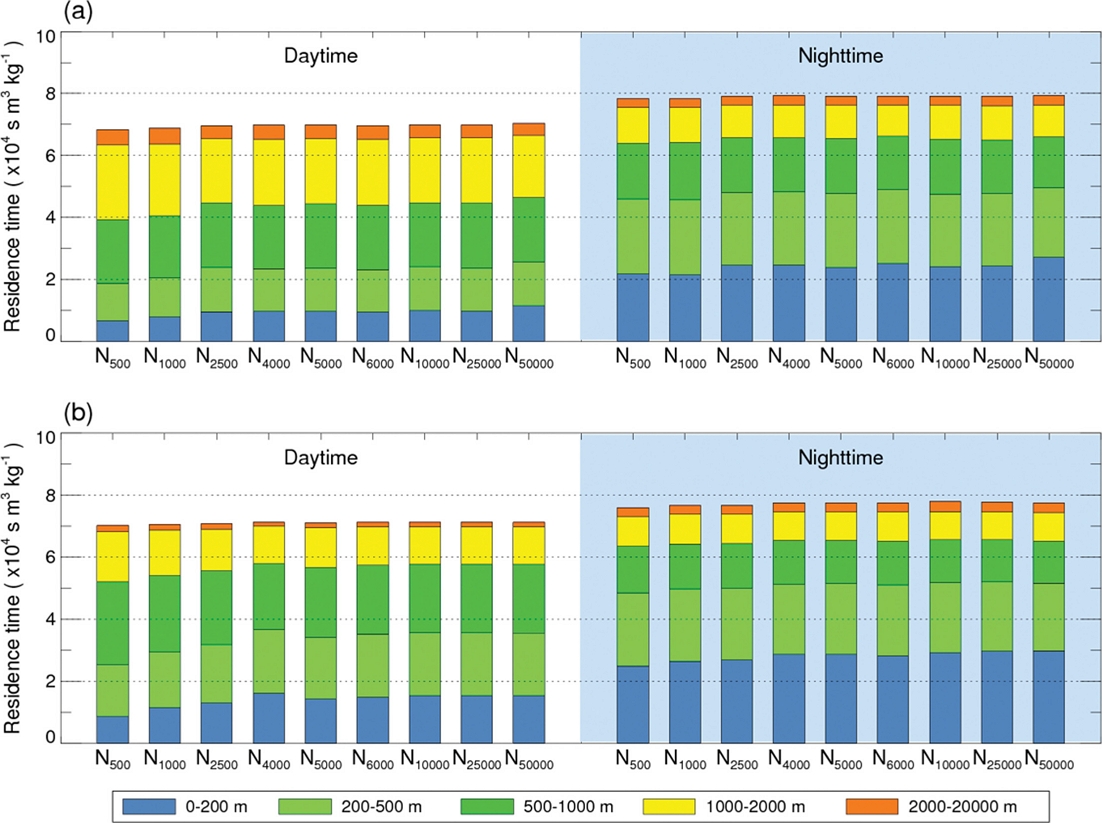
Vertical distributions of 24-hr cumulative residence time calculated from sensitivity simulations at the receptor sites of(a) R1 and (b) R2. Daytime release includes 1200, 1500, and 1800 LST and nighttime release includes 0000, 0300, and 0600 LST. The presented is the residence time normalized by air density.
최하층 격자에서 계산된 체류 시간은 지표면 배출량에 의한 기여 농도 계산에 직접 적용되기 때문에 시간 후방 모드의 라그랑지안 확산 모의에서 지표 배출량에 의한 기여 농도의 계산 정확도와 밀접하게 연관되어 있다. Figure 9는 라그랑지안 입자 수에 따른 최하층 격자에서 계산된 체류 시간의 기준 실험에 대한 상대 오차를 보여준다. R1 지점에서 계산된 주간(야간)의 평균 상대 오차는 입자 수 N25000 실험에서 -15% (-9%), N500 실험에서 -41% (-22%)로 나타났으며, R2 지점의 경우 N25000 실험에서 -0% (-0%), N500 실험에서 -49% (-20%)으로 나타났다. 수용지위치와 입자 배출 시간에 상관없이 라그랑지안 입자 수가 증가할수록 상대 오차는 감소하는 경향을 보이지만, 연직 난류 확산이 활발한 주간에 배출된 경우야간에 비해 상대 오차가 크게 나타나는 특징을 볼 수 있다.

Comparison of relative errors in residence time calculated from sensitivity simulations at the receptor sites of (a) R1 and(b) R2. Daytime release includes 1200, 1500, and 1800 LST and nighttime release includes 0000, 0300, and 0600 LST. Open circle on each box-and-whisker denotes a mean value in each sensitivity simulation.
Figure 10은 라그랑지안 입자 수에 따른 민감도 실험에서 계산된 지표면 CO 배출량의 기여 농도와 기준 실험에서 계산된 기여 농도에 대한 상대 오차를 보여준다. 지표면 배출량에 의한 기여 농도는 야간이 주간보다 더 높은 농도 값을 보인다. 여기서, 기여 농도의 계산을 위해 일 평균 지표면 배출 플럭스를 적용하였기 때문에 계산된 기여 농도는 하층 체류 시간과 배출량의 비균질적인 공간 분포에 의해 결정됨을 유의해야 한다. 기준 실험에서 모의된 지표면 배출량기여 농도는 R1 지점의 경우 주간과 야간에 각각 52 ppb ± 27 ppb와 190 ppb ± 109 ppb로 계산되었다(Fig. 10a). R2 지점은 R1 지점보다 낮은 기여 농도를 보이며, 주간과 야간에 각각 8 ppb ± 11 ppb와 18 ppb ± 34 ppb로 나타났다(Fig. 10b).
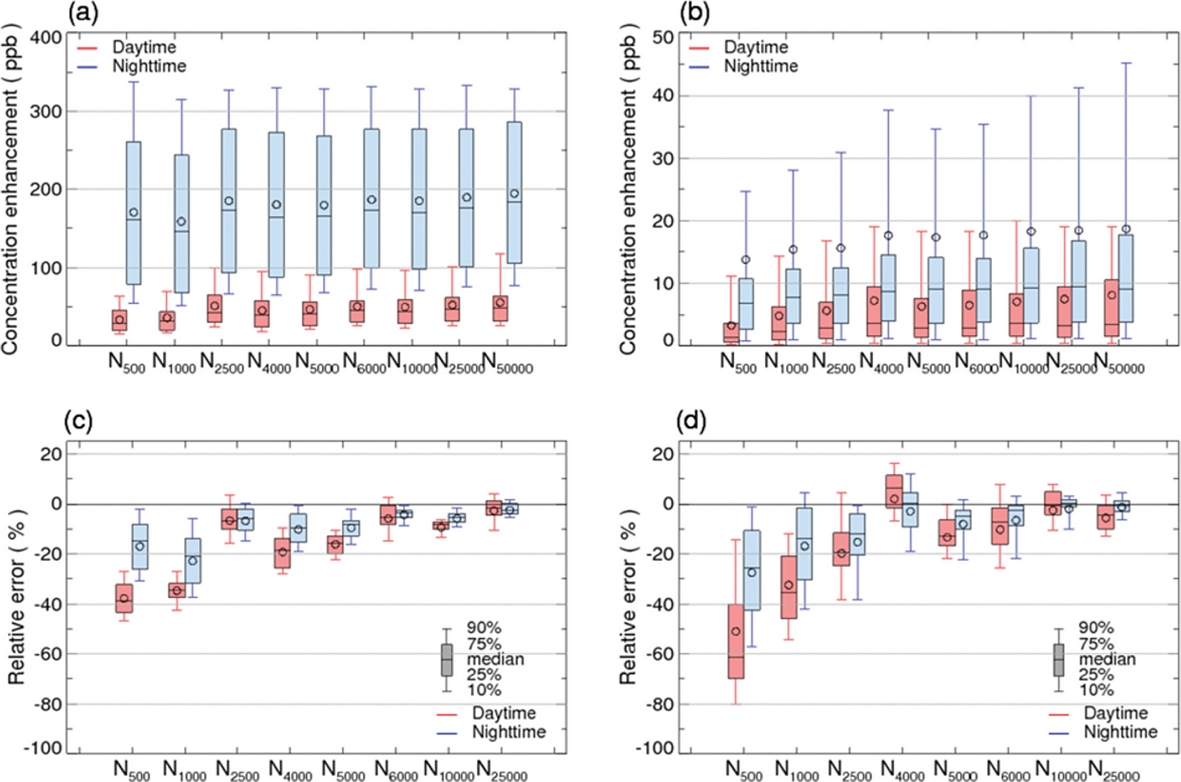
Comparison of atmospheric CO enhancements and relative errors calculated from sensitivity simulations at the receptor sites of (a and c) R1 and (b and d) R2. Daytime release includes 1200, 1500, and 1800 LST and nighttime release includes 0000, 0300, and 0600 LST. Open circle on each box-and-whisker denotes a mean value in each sensitivity simulation.
라그랑지안 입자 수가 증가함에 따라 기여 농도의 상대 오차는 감소하였으며, 주간에 비해 야간에 낮은 값을 보였다. R1 지점에서 주간과 야간의 상대 오차는 N500 실험에서 각각 평균 -38%와 -17%를 보였으며, R2 지점에서 주간과 야간의 최대 상대 오차는 N500 실험에서 각각 -51%와 -33%를 보였다. 두 지점에서 주간과 야간 모두 라그랑지안 입자 수가 늘어날수록 상대 오차는 낮아지면서 수렴하는 특성을 보인다. R1 지점에서는 N500과 N1000 실험은 다른 실험에 비해 상대적으로 높은 상대 오차를 보였으며 입자 수 2500 (N2500) 이상인 실험에서 상대 오차는 주간(야간)에 -19% (-10%) 이내의 값을 보였다. R2 지점에서는 입자 수 4000 (N4000) 이상인 실험에서 주간(야간)에 -20% (-15%) 이내의 상대 오차를 보이며 수렴하였다. 입자의 배출 시간에 대한 민감도가 높게 나타나는 이유는 Fig. 7에 제시한 바와 같이 기여 농도가 수용지 부근의 짧은 분산 거리에 위치한 배출량에 의해 주로 영향을 받기 때문이다.
시간 후방 모드의 라그랑지안 입자 확산 모의를 통해 계산되는 기여 농도의 상대 오차는 수용지의 위치와 입자 배출 시간에 따라 달라진다. 모의 오차와 계산 시간을 고려한 최적의 라그랑지안 입자 수를 결정하기 위해 대상 지역에서 계산된 모든 라그랑지안 궤적을 고려하였다. Figure 11은 전체 모의 기간 동안의 라그랑지안 입자 수에 따른 기여 농도의 상대 오차와 기준 실험에 대한 상대적 계산 시간을 보여준다. 수용지 R1과 R2에서 15일간의 기여 농도 계산 시간(0000, 0300, 0600, 0900, 1200, 1500, 1800, 2100 LST)에 배출된 라그랑지안 궤적을 모두 포함한다. 기여 농도의 상대 오차는 N500과 N1000에서 각각 평균 -37%와 -29%의 높은 오차를 보이며, N6000 이상의 실험에서는 평균 -6% 이내의 상대 오차를 보인다(Fig. 11a). 한편, 계산 시간은 라그랑지안 입자 수에 비례하여 대체로 단조 증가하는 양상을 보였으며, 입자 수 1000 증가 시 평균 계산 시간은 평균 약 18% 증가하는 것으로 나타났다. 하지만 계산 영역 내에 머무는 체류시간에도 비례하여 증가 또는 감소하며, 입자들이 계산 영역에 가장 오래 머무는 경우(체류 시간이 긴 경우)에는 최대 70%의 계산 시간이 소요되었으며 반대로 체류 시간이 짧은 경우에는 3%의 계산 시간이 소요되었다(Fig. 11b). 결과에 따르면, N6000 실험에서 기여 농도의 상대 오차는 평균 -6% ± 10%, 계산 시간은 평균 21%± 7%를 보여 오차와 계산 시간의 효율적인 균형을 보이는 것으로 판단된다.
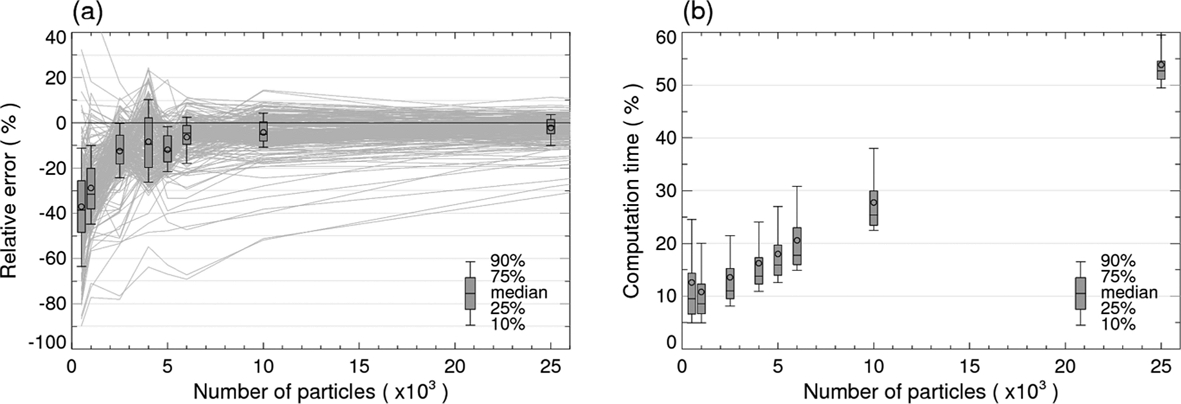
Comparison of (a) relative errors in atmospheric CO enhancement and (b) computation time calculated from sensitivity simulations. Thin lines in (a) denote relative errors from all Lagrangian trajectories calculated at the receptor sites of R1 and R2. The computation time is presented as a percentage value with respect to that of the reference simulation. Open circle on each box-and-whisker denotes a mean value in each sensitivity simulation.
3.5 라그랑지안 입자 확산의 불확실성
라그랑지안 입자 수에 대한 민감도 실험을 통해 배출 입자 수가 증가할수록 상대 오차가 작아지면서 수렴하는 특징은 수용지 지점과 입자의 배출 시간에 관계없이 일관적으로 나타냈다. 따라서 입자 확산 모의 결과에서 나타나는 체계적 오차의 원인을 파악하기 위해 WRF-FLEXPART 모형에서 나타나는 입자의 거동 특성을 추가로 분석하였다. 라그랑지안 입자의 위치 변화는 입자 위치의 평균 기상장과 난류 확산에 의해 식(1)~(5)를 따라 계산된다. 여기서 무작위 난류특성은 난수 생성을 통해 결정된다. 입자 수에 따른 민감도 실험에서 격자 규모 평균 바람장은 모든 실험에서 동일하므로, 난류에 의한 확산이 미치는 영향을 조사하였다. Figure 12는 R1 지점에서 계산된 확산 시간 별 모의 질량의 연직 분포를 상대 오차로 보여준다. 각 실험의 상대 오차는 기준 실험(N50000)에서 모의된 질량의 연직 분포를 이용하여 고도 100m 간격으로 계산하였다. 배출 초기 시각에 입자 수에 따른 질량의 연직 분포에 뚜렷한 차이를 보여준다(Fig. 12a). 입자 수가 작은 N500과 N1000 실험은 기준 실험에 비해 하층에는 상대적으로 적은 입자가 분포하고, 상층에는 상대적으로 많은 입자가 분포하는 특징을 볼 수 있다. 반면 N6000 이상으로 입자 수가 커지면 질량의 연직 분포에서 나타나는 상대 오차는 줄어드는 특징을 보여준다. 한편, 배출 시작 후 확산 시간이 길어지면 입자 수에 따른 연직 질량 분포의 상대 오차는 어느 정도 줄어드는 특징을 보인다(Fig. 12b). 즉, 입자 수가 작은 경우에도 확산 시간이 충분히 지나면 입자 수에 따른 무작위 오차는 초기 확산 시간에 비해 감소함을 추정할 수 있다.
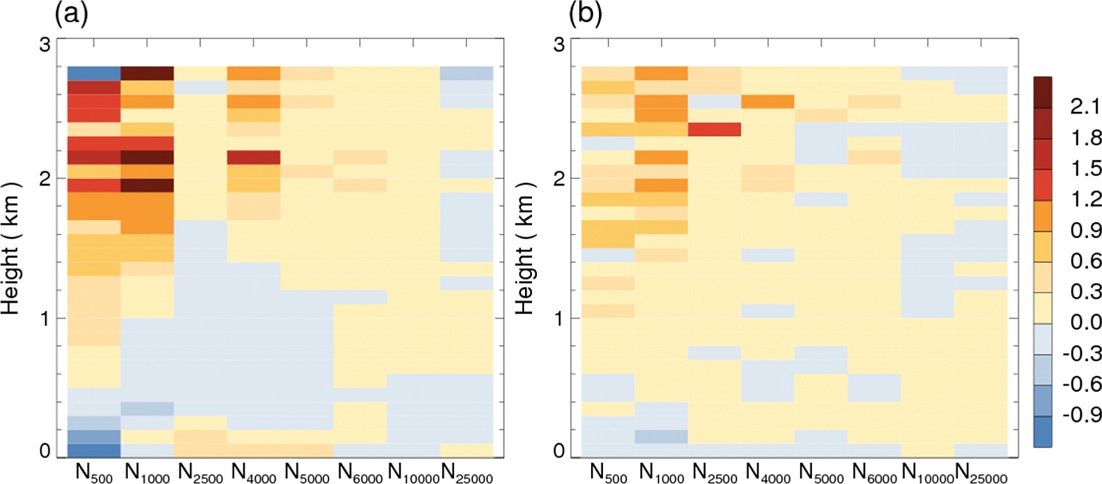
Mean vertical distributions of the relative errors in particle masses of sensitivity simulations at transport time of (a) 1 hr and (b) 12 hr.
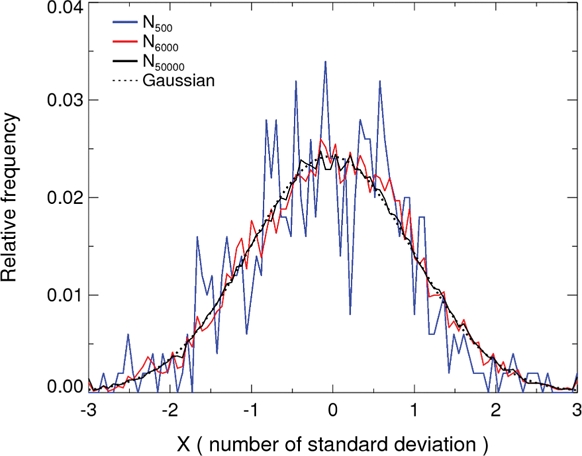
Figure 13은 WRF-FLEXPART 모형의 N500, N6000, 그리고 N50000 실험의 난수 생성 결과를 비교하고 있다. N50000 실험의 최초 난류 생성 결과는 정규 분포 곡선과 매우 잘 일치함을 볼 수 있는 반면에, N500의 난류 생성 결과는 정규 분포와 큰 차이를 보인다. N6000 실험을 비교하면 입자 수가 증가할수록 모형의 난류 생성 과정은 정규 분포에 가까워짐을 알 수 있다. Figure 12에서 보인 배출 입자 수에 따른 입자거동의 차이는 WRF-FLEXPART 모형의 난수 생성 과정에 기인하는 것으로 판단된다. 앞서 언급한 바와 같이 수도권 영역의 경우 수용지 위치로부터 수 시간 이내의 확산이 모의 결과에 중대한 영향을 미치므로 무작위 오차를 줄일 수 있는 최적 배출 입자 수의 결정을 위해서는 충분한 입자 수의 선택이 요구된다.
4. 요약 및 결론
라그랑지안 모형은 복잡 지형 지역의 대기 오염 물질의 분산을 정확히 모의하기 위한 도구로 유용하지만 내재된 오차 요소에 대한 정량적 분석이 요구된다. 본 연구에서는 수도권 영역을 대상으로 WRF-FLEXPART 모형을 이용한 시간 후방 모의에서 라그랑지안 입자수의 선택에 따른 무작위 오차의 특성을 정량적으로 분석하고, 이를 바탕으로 대상 영역의 시간 후방 확산 모델링을 위한 최적 입자 수를 제안하고자 하였다. 이를 위해 2010년 4월 기간에 대해 WRF 모형을 수행하고, 수도권 영역 내 특징적인 수용지 지점(R1과 R2)에 대한 시간 후방 모드 FLEXPART 민감도 모의를 수행하였다. 라그랑지안 역궤적 계산을 기반으로 체류 시간과 지표면 인위적 CO 배출 플럭스에 의한 기여 농도를 계산하고, 입자 수에 따른 모의 결과의 상대 오차에서 나타나는 특징을 정량적으로 분석하였다.
WRF 모형의 모의 기상장은 수도권 지역의 측정 기상장과의 비교를 통해 국지 순환을 현실적으로 모의 할 수 있음을 보였다. 도심과 해안 지역에 설정한 두 수용지에서 계산된 체류 시간과 지표면 CO 배출 플럭스의 기여 농도의 공간 분포는 대상 지역의 해륙풍 순환과 배출량 공간 분포 특성을 잘 반영하였다. 도심에 위치한 R1 지점은 평균 6시간 이내의 수송 거리에 포함되어 있는 지표면 배출량에 의해 90% 이상의 농도 기여가 나타났으며, R2 지점에서도 R1 지점과 유사하게 짧은 후방 분산 시간에 높은 기여 농도 값이 나타나는 특징이 나타나지만 최대 농도에 도달하는 후방 분산 시간은 상대적으로 길게 나타났다. 수용지 지점의 기여 농도에서 보이는 이러한 특징들은 국지 기상장에 의한 분산 특성과 배출원 특성에 의해 결정되며, 시간 후방 모드의 라그랑지안 입자 확산 모의를 통해 기류와 농도의 ‘발자국’을 효율적으로 분석할 수 있음을 보였다.
체류 시간과 기여 농도에 나타나는 무작위 오차는 라그랑지안 입자 수가 증가함에 따라 감소하는 특징을 보였으며, 연직 난류 확산이 큰 주간에 배출된 입자가 야간에 배출된 입자에 비해 상대 오차가 크게 나타나 입자 배출 시각에 따른 영향이 큼을 알 수 있었다. 입자 수가 적은 N500 실험에서 최대 상대 오차를 보였으며, R1 지점의 주간과 야간의 상대 오차는 각각 평균 -38%와 -17%를, R2 지점은 주간과 야간에 각각 -51%와 -33%를 보였다. 배출 초기 시각에 나타나는 입자 수에 따른 질량 연직 분포의 차이는 모형의 무작위 난류 확산항의 계산 방안에 기인하였으며, 입자 수가 작은 실험에서 나타나는 상대 오차의 발생 원인으로 판단되었다. 종합하면, 기준 실험에 비해 N6000 실험에서 기여 농도의 상대 오차는 평균 -6% ± 10%, 계산 시간은 평균 21%± 7%를 보여, 무작위 오차와 계산 시간의 효율적인 균형을 보였다.
본 연구는 수도권 영역의 시간 후방 모드 WRF-FLEXPART 모의 시 무작위 오차에 대한 정량적 평가의 중요성을 강조하였으며, 무작위 오차와 계산 시간의 효율적 균형을 이룰 수 있는 최적 입자수를 제시하였다. 연구 결과는 향후 시간 후방 모드의 확산 모델링을 통한 역궤적 기류 분석이나 하향식 배출량 검증 기법의 적용 연구에 활용될 수 있다.
Acknowledgments
논문이 개선될 수 있도록 세심한 심사 의견을 주신 두 분의 심사위원에게 감사드립니다. 이 논문은 2017년도 정부(교육과학기술부)의 재원으로 한국연구재단의 지원을 받아 수행된 기초연구사업임(No. NRF-2017R1A2B4012975).
References
-
Brioude, J., and Coauthors, 2011: Top-down estimate of anthropogenic emission inventories and their interannual variability in Houston using a mesoscale inverse modeling technique. J. Geophys. Res. Atmos., 116, D20305
[https://doi.org/10.1029/2011JD016215]

-
Brioude, J., W. M. Angevine, S. A. McKeen, and E.-Y. Hsie, 2012: Numerical uncertainty at mesoscale in a Lagrangian model in complex terrain. Geosci. Model Dev., 5, 1127-1136
[https://doi.org/10.5194/gmd-5-1127-2012]

-
Brioude, J., and Coauthors, 2013a: Top-down estimate of surface flux in the Los Angeles Basin using a mesoscale inverse modeling technique: assessing anthropogenic emissions of CO, NOx and CO2 and their impacts. Atmos. Chem. Phys., 13, 3661-3677
[https://doi.org/10.5194/acp-13-3661-2013]

-
Brioude, J., and Coauthors, 2013b: The Lagrangian particle dispersion model FLEXPART-WRF version 3.1. Geosci. Model Dev., 6, 1889-1904
[https://doi.org/10.5194/gmd-6-1889-2013]

-
Carmichael, G. R., and Coauthors, 2002: The MICS-Asia study: model intercomparison of long-range transport and sulfur deposition in East Asia. Atmos. Environ., 36, 175-199.
[https://doi.org/10.1016/S1352-2310(01)00448-4]

-
Chen, F., and J. Dudhia, 2001: Coupling an advanced land surface-hydrology model with the Penn State-NCAR MM5 modeling system. PART I: Model implementation and sensitivity. Mon. Wea. Rev., 129, 569-585.
[https://doi.org/10.1175/1520-0493(2001)129<0569:CAALSH>2.0.CO;2]

- Chou, M.-D., and M. J. Suarez, 1994: An efficient thermal infrared radiation parameterization for use in general circulation models. NASA Tech. Memo. 104606, 85 pp.
-
Ding, A., T. Wang, and C. Fu, 2013: Transport characteristics and origins of carbon monoxide and ozone in Hong Kong, South China. J. Geophys. Res. Atmos., 118, 9475______9488
[https://doi.org/10.1002/jgrd.50714]

- Fast, J. D., and R. C. Easter, 2006: A Lagrangian particle dispersion model compatible with WRF, 7th Annual WRF User’s Workshop, Boulder, CO, USA, 5 pp.
-
Folini, D., S. Ubl, and P. Kaufmann, 2008: Lagrangian particle dispersion modeling for the high Alpine site Jungfraujoch. J. Geophys. Res. Atmos., 113, D18111.
[https://doi.org/10.1029/2007JD009558]

-
Gerbig, C., J. C. Lin, S. C. Wofsy, B. C. Daube, A. E. Andrews, B. B. Stephens, P. S. Bakwin, and C. A. Grainger, 2003: Toward constraining regional-scale fluxes of CO2 with atmospheric observations over a continent: 2. Analysis of COBRA data using a receptor-oriented framework. J. Geophys. Res. Atmos., 108, 4757
[https://doi.org/10.1029/2003JD003770]

-
Grell, G. A., 1993: Prognostic evaluation of assumptions used by cumulus parameterizations. Mon. Wea. Rev., 121, 764-787.
[https://doi.org/10.1175/1520-0493(1993)121<0764:PEOAUB>2.0.CO;2]

-
Hall, C. D., 1975: The simulation of particle motion in the atmosphere by a numerical random-walk model. Q. J. Roy. Meteor. Soc., 101, 235-244.
[https://doi.org/10.1002/qj.49710142807]

-
Henne, S., D. Brunner, B. Oney, M. Leuenberger, W. Eugster, I. Bamberger, F. Meinhardt, M. Steinbacher, and L. Emmenegger, 2016: Validation of the Swiss methane emission inventory by atmospheric observations and inverse modelling. Atmos. Chem. Phys., 16, 3683-3710
[https://doi.org/10.5194/acp-16-3683-2016]

- Jeong, S., C. Zhao, A. E. Andrews, L. Bianco, J. M. Wilczak, and M. L. Fischer, 2012: Seasonal variation of CH4 emissions from central California. J. Geophys. Res. Atmos., 117, D11306
-
Kort, E. A., and Coauthors, 2008: Emissions of CH4 and N2O over the United States and Canada based on a receptor-oriented modeling framework and COBRA-NA atmospheric observations. Geophys. Res. Lett., 35, L18808.
[https://doi.org/10.1029/2008GL034031]

-
Legg, B. J., and M. R. Raupach, 1982: Markov-chain simulation of particle dispersion in inhomogeneous flows: The mean drift velocity induced by a gradient in Eulerian velocity variance. Bound.-Layer Meteor., 24, 3-13.
[https://doi.org/10.1007/BF00121796]

-
Lin, J. C., and C. Gerbig, 2005: Accounting for the effect of transport errors on tracer inversions. Geophys. Res. Lett., 32, L01802.
[https://doi.org/10.1029/2004GL021127]

-
Lin, Y.-L., R. D. Farley, and H. D. Orville, 1983: Bulk parameterization of the snow field in a cloud model. J. Climate Appl. Meteor., 22, 1065-1092.
[https://doi.org/10.1175/1520-0450(1983)022<1065:BPOTSF>2.0.CO;2]

-
McNider, R. T., M. D. Moran, and R. A. Pielke, 1988: Influence of diurnal and inertial boundary-layer oscillations on long-range dispersion. Atmos. Environ., 22, 2445-2462.
[https://doi.org/10.1016/0004-6981(88)90476-3]

-
Mlawer, E. J., S. J. Taubman, P. D. Brown, M. J. Iacono, and S. A. Clough, 1997: Radiative transfer for inhomogeneous atmospheres: RRTM, a validated correlated-k model for the longwave. J. Geophys. Res. Atmos., 102, 16663-16682.
[https://doi.org/10.1029/97JD00237]

-
Nakanishi, M., and H. Niino, 2006: An improved Mellor-Yamada level-3 model: Its numerical stability and application to a regional prediction of advection fog. Bound.-Layer Meteor., 119, 397-407.
[https://doi.org/10.1007/s10546-005-9030-8]

- NIER, 2012: National air pollutants emission 2010. National Institute of Environmental Research, NIER-GP2012-318, 243 pp (in Korean).
-
Pielke, P. A., and M. Uliasz, 1998: Use of meteorological models as input to regional and mesoscale air quality models – limitations and strengths. Atmos. Environ., 32, 1455-1466.
[https://doi.org/10.1016/S1352-2310(97)00140-4]

-
Reid, J. D., 1979: Markov chain simulations of vertical dispersion in the neutral surface layer for surface and elevated releases. Bound.-Layer Meteor., 16, 3-22.
[https://doi.org/10.1007/BF02220403]

-
Seibert, P., and A. Frank, 2004: Source-receptor matrix calculation with a Lagrangian particle dispersion model in backward mode. Atmos. Chem. Phys., 4, 51-63.
[https://doi.org/10.5194/acp-4-51-2004]

- Skamarock, W. C., J. B. Klemp, J. Dudhia, D. O. Gill, D. M. Barker, M. G. Duda, X.-Y. Huang, W. Wang, and J. G. Powers, 2008: A description of the advanced research WRF version 3. NCAR Tech. Note, NCAR/TN-475+STR, 113 pp.
-
Stohl, A., 1998: Computation, accuracy and applications of trajectories-a review and bibliography. Atmos. Environ., 32, 947-966.
[https://doi.org/10.1016/S1352-2310(97)00457-3]

-
Stohl, A., and D. J. Thomson, 1999: A density correction for Lagrangian particle dispersion models. Bound.-Layer Meteor., 90, 155-167.
[https://doi.org/10.1023/A:1001741110696]

-
Stohl, A., C. Forster, A. Frank, P. Seibert, and G. Wotawa, 2005: Technical note: The Lagrangian particle dispersion model FLEXPART version 6.2. Atmos. Chem. Phys., 5, 2461-2474.
[https://doi.org/10.5194/acp-5-2461-2005]

-
Thompson, R., 1971: Numeric calculation of turbulent diffusion. Q. J. R. Meteorol. Soc., 97, 93-98.
[https://doi.org/10.1002/qj.49709741109]

-
Thompson, R. L., and A. Stohl, 2014: FLEXINVERT: an atmospheric Bayesian inversion framework for determining surface fluxes of trace species using an optimized grid. Geosci. Model Dev., 7, 2223-2242
[https://doi.org/10.5194/gmd-7-2223-2014]

-
Thomson, D. J., 1987: Criteria for the selection of stochastic models of particle trajectories in turbulent flows. J. Fluid Mech., 180, 529-556.
[https://doi.org/10.1017/S0022112087001940]

-
Wen, D., J. C. Lin, D. B. Millet, A. F. Stein, and R. R. Draxler, 2012: A backward-time stochastic Lagrangian air quality model. Atmos. Environ., 54, 373-386
[https://doi.org/10.1016/j.atmosenv.2012.02.042]

-
Zannetti, P., 1990: Air pollution modeling: theories, computational methods and available software, Springer US, 444 pp.
[https://doi.org/10.1007/978-1-4757-4465-1_12]

-
Zhao, C., A. E. Andrews, L. Bianco, J. Eluszkiewicz, A. Hirsch, C. MacDonald, T. Nehrkorn, and M. L. Fischer, 2009: Atmospheric inverse estimates of methane emissions from Central California. J. Geophys. Res. Atmos., 114, D16302.
[https://doi.org/10.1029/2008JD011671]

